CHAPTER 6
Live Data Collection from Unix Systems
The initial response to prospective incidents on Unix systems is similar to the initial response for incidents on Windows systems. Your goal is to obtain the volatile system data before forensic duplication. You can expand the scope of your initial response to obtain log files, configuration files, system files, and relevant files (such as hacker tools and suspicious programs) to rapidly confirm whether or not an incident occurred.
One difference between working with Windows and Unix systems is the difficulty of recovering deleted files on some Unix variants. When you execute a process in the Windows environment, you cannot delete the file corresponding to the running process from the hard drive. However, the Unix operating system allows you to delete a program after it has been executed—the process is running, yet the program’s file has been deleted from the hard drive. In this chapter, we discuss why you should recover these files before shutting down the system, as well as how to create your response toolkit, obtain volatile data, and conduct a live response.
Preparing your trusted toolkit is more difficult and time-consuming than it sounds, because practically every variant of Unix requires a unique toolkit. Since many of the tools we recommend are not included with the standard release of all Unix operating systems, you must compile the source code on your own. For example, if the victim machine is a Sparc server running Solaris 2.8, you need to compile your tools on a clean copy of Solaris 2.8 on a system with the same architecture.
NOTE
When we refer to Unix, we are collectively referring to all Unix variants. Specifically, we are most familiar with Sun Solaris, Hewlett-Packard’s HP-UX, FreeBSD, and Linux (RedHat, SuSE, and Corel). Our examples and response strategies are based on our experiences with these operating systems, which are the most common. If you know how to respond to incidents of these Unix flavors, you should be able to handle any other variants that you may encounter (such as IBM’s AIX).
To complicate matters further, many Unix versions are not backward or forward compatible. For example, programs compiled to run on a Solaris 2.6 system may not work correctly on Solaris 2.7, and vice versa.
All these issues increase the amount of resources and time required for creating your Unix response toolkits. Therefore, it is essential to create the response toolkits prior to an incident. You may not have the time to create one after an incident occurs.
GO GET IT ON THE WEB
Statically linked Unix response toolkits/compiling trusted tools statically: http://www.incident-response.org
Regardless of the type of incident, it is critical that you use trusted commands. For responding to Unix systems, we maintain a number of CDs and floppy disks with the following tools:

CAUTION
The system commands in Unix are often trojaned by attackers (an approach rarely seen on Windows systems). If you are responding to a root-level compromise, anticipate that all common commands may not be functioning as intended, because they have been trojaned by the attacker.
When you respond to an incident, you must choose where to store information retrieved during the initial response. You have the following storage options:
netcat (or cryptcat) to transfer the retrieved data to a forensic workstation over the network.Storing data on the local hard drive should be avoided whenever possible. If data recovery or forensic analysis is required, the data you store on the local hard drive will overwrite deleted data that was in unallocated space that may be of investigative and/or evidentiary value.
Since only newer versions of Linux support USB drives, they are not as useful for data collection by direct physical connection. However, you can overcome this limitation by using netcat to transfer the data over the network to a forensic workstation equipped with a USB drive or other adequate storage. We use Linux on our forensic workstations to provide a faster response. This way, we are rarely impeded by limitations of storage space. We use
netcat to transfer the information across the network, and “pipe” the netcat stream through des to encrypt the transfer. The cryptcat command offers an encrypted TCP channel in a single step. (See Chapter 5 for details on using netcat and cryptcat.)After selecting how you will retrieve the data from the target system, you must consider the best time to respond (usually when the attacker or most users are not online). You will also want to determine whether the target system must maintain network connectivity or if you will pull the network cable to prevent users and attackers from connecting to the system during your initial response. When these issues have been resolved, you are prepared to respond at the console of the target system.
When you collect volatile data, you will want to respond to the target system at the console, rather than access it over the network. This eliminates the possibility of the attacker monitoring your response and ensures that you are running trusted commands.
If you are certain that you will be creating a forensic duplication of the target system, you should concentrate on obtaining the volatile system data before powering down the system. The volatile data includes currently open sockets, running processes, the contents of system RAM, and the location of unlinked files.
The unlinked files are files marked for deletion when processes that access it terminate. The files marked for deletion will “disappear” when the system is powered down. Therefore, the initial response should recover each type of volatile evidence, including the files marked for deletion! This will save you some grief, because recovering a deleted file in most flavors of Unix is not as simple as running a file undeletion tool.
CAUTION
Lesson number one when dealing with Unix systems is that you should not shut off the machine before performing an initial response to find files marked for deletion! Although these files may be recoverable during the static analysis of the media, it is much more difficult.
At a minimum, you should collect the following information:
To collect the live data in this list, you can take these steps:
1. Execute a trusted shell.
2. Record the system time and date.
3. Determine who is logged on to the system.
4. Record modification, creation, and access times of all files.
5. Determine open ports.
6. List applications associated with open ports.
7. Determine the running processes.
8. List current and recent connections.
9. Record the system time.
10. Record the steps taken.
11. Record cryptographic checksums.
Keep in mind that the steps we outline are merely a game plan. You will certainly need to tailor the order and the tools used based on the totality of the circumstances. You may opt to include tools we do not mention, as well as conduct your steps in a different manner.
How Unix Deletes a File
When an attacker runs a process, he usually deletes the program file he executed from the file system in an effort to hide his actions. He is not truly deleting the program on the hard drive. The attacker is unlinking the file.
Unix tracks a file’s link count, which is a positive integer representing the number of processes currently using the file. When the link count equals zero, that means no process is using or needs the file, so it will be deleted. When an attacker deletes his rogue program, the program on the hard drive is removed from the directory chain (so it will not be displayed in an
ls listing), the link count is decremented by one, and the file’s deletion time is set. However, note that the link count does not equal zero until the process terminates.Files marked for deletion (these are the unlinked files) at the time a system is powered down—whether gracefully (through normal shutdown procedures) or not (you pulled the power cord)—will ultimately end up deleted on the system. Let’s examine why.
When Unix mounts a file system, a “file system dirty” bit is set. When the operating system goes through a normal shutdown, every process is forced to close. The attacker’s process terminates normally, and all file handles are closed. This means that the link count on the deleted file is set to zero. After all processes have exited and other general housekeeping items have been completed, the file system is unmounted, and the file system dirty bit is cleared.
If the operating system goes through a traumatic shutdown, the file system is left in an unstable state. Unlinked files may still have false link counts, and the dirty bit remains set. On the next bootup, the file system is mounted, and the operating system detects the nonzero value of the dirty bit. Most of the time, the administrator will be forced to wait while the system performs a file system check (
fsck). The fsck utility will scan the entire file system for damage. If the utility comes across a file with a positive link count and a deletion time set, it will decrement the link count, rendering the file “deleted.” Some versions of fsck will relink the orphaned file to the lost+found directory, but this is not something that you can rely on.Legal Issues
As we stressed in Chapter 5, document the steps that you take on the system with utmost diligence. Remember the chain of custody, and how to handle and control access to potential evidence.
Executing a Trusted Shell
When you respond to a target system running Unix, you will encounter one of two scenarios:
To avoid common X Windows-based vulnerabilities that allow the attacker to log keystrokes, you should exit X Windows before you initiate your response. If you are responding to a Linux system, you may be able to switch to another virtual console by pressing ALT-F2.
Log on locally at the victim console to avoid generating network traffic, and be sure to log on with root-level privileges. At this point, you need to mount your trusted toolkit and respond with trusted tools. The following is the command syntax to mount a floppy drive when responding to a Linux system:
This command mounts your trusted toolkit on the mount point /mnt/floppy. When you change directories to /mnt/floppy, you will be able to access your trusted files.
The first step in all response is to be certain you are executing a trusted command shell. The Unix shells can be trojaned by attackers to log all the commands executed or to perform nefarious and evil operations invisible to the investigator. Therefore, you will want to execute your own trusted shell (we use the Bourne Again shell, called
bash). Once you have executed your trusted shell, set your PATH environment variable equal to dot (.). This will decrease the chances of someone accidentally executing untrusted commands that are in the target system’s PATH.Rename Your Trusted Tools
Another good measure is to give all your trusted tools a slightly different name than the standard Unix filename. For example, each filename in our toolset begins with the letter t. For example, we execute
tnetstat when we want to run a trusted netstat command. This way, we avoid accidentally running an untrusted version of netstat.Recording the System Time and Date
The local date and time settings are important for later correlation of time/date stamps, and they also show when you were on the system. To capture this information, use the date command:
Determining Who Is Logged on to the System
Determining who is logged on is quite simple. Just execute the
w (what) command. The w command displays the user IDs of logged-on users, what system they logged on from, and what they are currently executing on the system. It also provides the date and system time.Legal Issues
We begin and end each initial response with the w command, so we can identify the exact timeframe we performed operations on the target system, as well as who may have been on the system at the time we were collecting potential evidence.
Here is an example of using the
w command: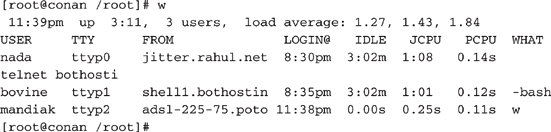
The header line in the output indicates the current system time, how long the system has been running, how many users are currently logged in, and the system load averages for the past one, five, and fifteen minutes. Here is a breakdown of each of the fields:
USER field shows the username currently logged on to the system.TTY field shows the control terminal assigned to the user’s session. There are some important things to note about this column. A ttyn (where n is zero or a positive integer) signifies a logon at the console (a user logging on to the system from the local console, or keyboard). A ptsn or ttypn may signify a connection over the network.FROM field contains the fully qualified domain name or numerical IP address of the remote host. A hyphen (-) in this field corresponds to a local logon at console.LOGIN@ field shows the local starting time of the connection.IDLE field shows the length of time since the last process was run.JCPU field shows the time used by all processes attached to that console (tty) or other connection (pts).PCPU field shows the processor time used by the current process under the WHAT column.WHAT column shows the process that the user is currently running. In other words, if the user executed the command find / -name *.tgz, this command will take quite a while to run. Thus, executing the w command will show the syntax of the find command in the WHAT column.CAUTION
Keep in mind that the
wcommand retrieves information from the utmp/wtmp logs (covered in Chapter 13). If a hacker has modified these logs, the information retrieved will not be accurate!Recording File Modification, Access, and Inode Change Times
You will want to retrieve all the time/date stamps on the file system. As with Windows systems, Unix systems have three time/date stamps to collect for each file and directory: access time (
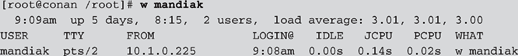
atime), modification time (mtime), and the inode change time (ctime). You can use a trusted ls command with the proper command-line arguments to obtain these times for each file. The following lines demonstrate how to obtain the time/date stamps and save the output on a trusted floppy disk:During several computer-intrusion cases, we were legally bound by U.S. prosecutors to retrieve information from the system logs that dealt with a specific user ID. This led to many frustrating discussions regarding the low probability that an attacker would use a single account on a system. Nevertheless, we were not permitted to execute the w command without minimizing the output to a single user. Therefore, we used the w command with an argument of the user ID under suspicion. The following command illustrates how to limit w output to a single user account:
The
R option used in the ls command forces a recursive listing, which takes some time. On very large file systems, this data may not fit on a 1.44MB floppy, so you may be forced to use other media or netcat/cryptcat.Determining Which Ports Are Open
The
netstat command is king when it comes to enumerating the open ports on a Unix system. The complex part is determining which applications are responsible for the open network sockets, as explained in the next section.Use the
netstat – an command to view all open ports. The -n option tells netstat to not resolve hostnames, which reduces the impact on the system and speeds the execution of the command. The following is an excerpt from the output of netstat:
On this server, we see listening TCP ports 80, 21, and 22, and a listening UDP port 69.
Listing Applications Associated with Open Ports
On Linux, the
netstat command has a –p option that maps the name of the application and its process ID (PID) to the open ports. Here is an abbreviated example of the netstat -anp output (we added the line numbers for clarity).
This output displays seven open TCP sockets and one open UDP socket. Line 9 indicates a raw socket is listening for ICMP, and line 10 reveals that the kernel is also listening for TCP packets. If you examine line 2, you can see that the secure shell daemon,
sshd, with a PID of 395, is listening for connections on TCP port 22. Lines 1, 3, 4, 5, 6, and 7 show that the inetd, with a PID of 385, is listening on TCP ports 143, 512, 513, 514, 23, and 21. You now can discern which processes are responsible for opening the specific Internet ports.Mapping an open port to the process listening on that port is a bit more challenging on other flavors of Unix. For Solaris, HP-UX, IBM’s AIX, FreeBSD, BSDI, older versions of Linux, and Ultrix, you must obtain and compile
lsof. This is the list-of-open-files utility, which lists all running processes and the file descriptors they have open. The lsof utility will show you all the regular files, directories, libraries, Unix streams, and network files (such as NFS or Internet sockets) that are currently opened and the corresponding process that opened them.To use
lsof to list only the processes that have opened network sockets, use the following command line:When you use
lsof on a live initial response, always include the –D r options on the command line. If you do not, lsof will create a device cache file named .lsof_hostname in your (the root user’s) home directory if the file does not exist, or it will update the access time on the existing file. Remember that your primary goal is to change as little as possible on the system!What Can Happen
You are responding to a Solaris server that has been a source of a distributed denial-of-service (DDoS) attack that has crashed your company’s router. You need to enumerate the running process that is the DDoS agent so you can terminate it without needing to reboot the whole system. (The rogue DDoS agent would probably start again during the reboot process anyway.)
Where to Look for Evidence
You execute
lsof on the Solaris server to locate the suspicious process, as shown below (with line numbers added for this discussion). You notice in lines 10 and 11 that PID 647, the lpq process, opens two ICMP sockets. You should immediately suspect that this process is up to no good. Why would any process other than the kernel or a running ping client be listening for ICMP? The following lsof output was taken from a victim Solaris server that had the Stacheldraht DDoS agent running on it.

GO GET IT ON THE WEB
Stacheldraht DDoS agent: http://www.sans.org/y2k/stacheldraht.htm
Determining the Running Processes
It is critical to take a snapshot of all the running processes during the initial response. This can be accomplished by using the standard
ps (process status) command. The output varies a bit among the different Unix flavors. We use ps -eaf on Solaris systems, and we use ps -aux on FreeBSD and Linux systems. The following illustrates the results of the ps command on a Linux system: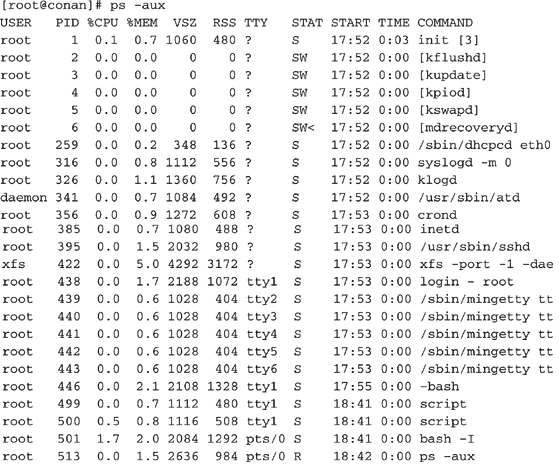
You may notice that the average Unix system has many more processes running than you will find on Windows servers. This makes it easier for attackers to hide rogue processes. System administrators must peruse hundreds of executing processes on live Unix servers when looking for any rogue processes.
One of the most important fields in the ps command output is the
START field, which indicates when a process began. This is extremely helpful when you isolate the time an attack occurred. You can identify suspect processes merely by the time they were executed.What Can Happen
You execute a
ps command and notice some very bizarre process running on your system. You are certain that you have not initiated the process, and you wonder who did.Where to Look for Evidence
Here is the abbreviated output to the
ps command that created alarm: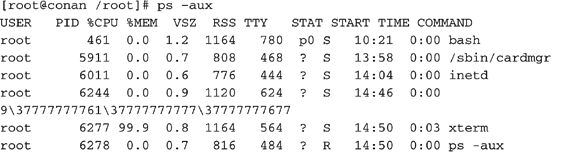
What in the heck is process 6244? It appears to be a process named
9377777777613777777777737777777677. What kind of attack would create such a bizarre entry in the process listing? Here is another example of a bizarre running process:These two command lines are indicators that someone is currently running a buffer-overflow attack on the system. This may mean that someone has unauthorized access to the system. You should immediately execute a
netstat command to see what IP addresses are currently connected to the system. (Further investigation is also possible using the -l option with ps, which will provide the parent process ID (PPID).Listing Current and Recent Connections
The
netstat command provides information about another aspect of live response: current and recent connections. The command usage is identical to that for determining which ports are open, as described earlier (step 5 in the live data collection process).Recording System Time
Use the
date command again (repeat step 2) to record the current system time. The reason for another timestamp is so that you will know the exact time window during which you manipulated the system. Thus, any changes that take place outside this time window are not due to your investigation.Recording the Steps Taken
Finally, record all of the commands you have issued to the system. There are several possibilities here: use
script, history, or even vi if you performed your live response from the editor. Since you issued all commands from a trusted shell, using the history command will record all of the commands you’ve executed. However, a better choice is the script command, which will record your keystrokes and the output. If you choose to use the script command, you’ll need to run this command before you perform the live response.Recording Cryptographic Checksums
Finally, record the cryptographic checksums of all recorded data. Simply run the md5sum program against all files in the data directory, as shown here:
It’s not uncommon for investigators to make typing mistakes. To reduce the risk of these mistakes, consider scripting your initial response. A simple shell script can easily automate the live data collection steps described in the previous sections. Place your script in the same directory as the response toolkit and have it call the local tools.
The live data collection steps covered in the previous section provide much of the information that investigators will need in most cases. However, there will be times when you are responding to a target system that must remain online. In cases where forensic duplication seems unlikely, but you still want to obtain enough information to prove an allegation, you can use dd,
cat, netcat and des, or cryptcat to obtain the log files, configuration files, and any other relevant files. Here, we will explore some of the other information that you may choose to collect should the circumstances of your investigation warrant it.Rootkits are collections of commonly trojaned system processes and scripts that automate many of the actions attackers take when they compromise a system. Rootkits are freely available on the Internet, and one exists for practically every release of Unix. The most advanced rootkits are loadable kernel modules (LKMs), also called kernel loadable modules. Solaris, Linux, and nearly all other Unix flavors support LKMs.
The Unix kernel is a single program. LKMs are programs that can be dynamically linked into the kernel after the system has booted up. Let’s say you want to add a network adapter to your Unix system. You can simply load the drivers for the new adapter as an LKM. This makes the driver part of the kernel, and you can now use the new network adapter without rebooting the system.
Technicians were fixing a router problem when they detected random ICMP packets leaving their network. The source of these rogue ICMP packets was an internal Solaris server used by the organization on a wide-scale and frequent basis. We analyzed the ICMP packets and discovered that they contained the string “skyllz” in their payload, which was indicative of a DDoS beacon packet emitting from a Stacheldraht agent.
We told the client we could fix the problem, but the managers had numerous concerns about disruption of service. They requested that we find all trojaned code, backdoors, and rogue processes, and properly remove them without disrupting any services provided by the victim machine (or overtaxing the CPU). In other words, we couldn’t shut off the machine, disable network connections, or use Safeback and En-Case (or any other popular Windows/DOS-based forensic software)!
This is somewhat contrary to traditional computer forensics, but it appears to be a growing trend in the requirements for incident response. Many organizations want investigators to retrieve forensically sound data without disrupting the operation of the victim computer. We used the techniques outlined in this chapter to respond to the incident while minimizing the disruption of the Solaris server operation.
This ability to change the way an operating system behaves is a key concept of LKMs. It was not long before attackers recognized that LKMs afforded them the ability to change the behavior of each command a system administrator executed. What a great mechanism for a rootkit! Rogue LKMs installed by attackers can intercept system commands such as
netstat, ifconfig, ps, ls, and NOTE
All operating systems provide access to kernel structures and functions through the use of system calls. This means that whenever an application or command needs to access a resource the computer manages via the kernel, it will do so through system calls. System calls are made for practically every command a user types!
LKM rootkits—such as
knark, adore, and heroin—provide quite a challenge to investigators. The typical system administrator who uses any user space tools (any normal Unix commands) to query running processes could overlook critical information during the initial response.What Can Happen
You respond to a suspected intrusion. The system administrator has detected and captured traffic that suggests someone is using a sniffer on your system. You mount your trusted toolkit and begin your response. Your
ps listings don’t reveal anything suspicious; yet, other evidence leads you to believe that a sniffer is running.Where to Look for Evidence
The attacker may have installed an LKM. When an attacker has control of the system at the kernel level, she can force user-level programs, such as
ps, to return false information. One tool that may have been used is knark. This Linux LKM trojan allows an attacker to hide any process she desires. Once the LKM is installed, the attacker simply sends a signal 31 (via kill–31) to the process she wants to hide. The knark LKM takes care of the rest. The only way to work around an LKM is to have one in your toolkit. Also, you might want to obtain kstat, which is a very handy tool for detecting rootkit modules.GO GET IT ON THE WEB
adore rootkit: http://www.team-teso.net
knark LKM rootkit: http://packetstormsecurity.nl/UNIX/penetration/rootkits/knark-2.4.3.tgz
Interview with the author of knark: http://jclemens.org/knark/creed_interview1.html
Solaris LKMs: http://packetstormsecurity.nl/groups/thc/slkm-1.0.html
Linux LKMs Tutorial: http://www.ddj.com/articles/1995/9505/9505a/9505a.htm?topic=unix
Unix has a myriad of logs that seem to be scattered on the file system in a completely random fashion. Adding to the complexity, system administrators can easily change the name and location of these logs to suit their needs.
Most Unix flavors keep their log files in /var/adm or /var/log subdirectories. You will need to be familiar with each variant and know where the logs are stored. In Chapter 13, we cover the locations and purposes of Unix logging. Here, we concentrate on the retrieval of the log files.
We use a combination of
netcat, cryptcat, dd, and des to obtain the log files on a system. At a minimum, you want to acquire the three binary log files and the common ASCII text log files. The following binary log files are of particular interest:w utilitylast utilitylastlog utilitylastcomm utilityThe following are the common ASCII text log files:
You will also want to review the /etc/syslog.conf file to determine if there are any additional logs maintained on the system, such as TCP Wrapper logs or specific application logs. (We cover the purpose of each of these logs in Chapter 13.)
Here is an example of how to obtain /var/log/messages from a target Linux system with an encrypted transfer. Execute the following command line on the victim machine:
On the forensic workstation, run the following:
You now have the messages log and an MD5 sum of the evidence file.
NOTE
The binary utmp, wtmp, and lastlog log files have proprietary formats and require the correct version of
w, last, and lastlog to review them. The same rule applies to process accounting logs, accessed with the lastcomm command. This becomes a problem, for example, when you have a copy of an HP-UX utmp log, but you do not have an HP-UX system to run the HP-UX version of w to review the contents of the binary file.Unix maintains certain configuration files that are commonly accessed or altered by attackers. It is important to review each one of these configuration files to locate backdoors, unauthorized trust relationships, and unauthorized user IDs. We explain the purpose of these files and what the investigator looks for in Chapter 13, but we list them here so you know which files to obtain during initial response:
Discovering a sniffer on a target system heightens the severity of an attack. It suggests that the compromise is likely to be more widespread than a single system, and it also means that the attacker had root-level access. (You normally cannot run a sniffer unless you have root-level privileges.)
To determine whether a sniffer is running on a system, you must find out whether the Ethernet card is in promiscuous mode. The command to determine whether an interface is in promiscuous mode is
ifconfig. The following is an example of the ifconfig command querying the first Ethernet interface (with line numbers added). If you want to query all network adapters on a system, use the -a option (ifconfig–a). Note that you ordinarily need to have root-level access to query the interface.
Notice that in line 3, the word PROMISC is absent. Therefore, the network adapter is not operating in promiscuous mode, and a sniffer is not currently executing (unless you have a trojaned system).
Now let’s take a look at another example:

In this version, line 3 contains PROMISC, indicating that a sniffer is currently running on the system. You must now determine which running process is the illicit sniffer program.
NOTE
The
PROMISC flag does not work on every Unix variant. Solaris systems will never show the PROMISC flag when an ifconfig command is executed. The technique we use to determine if a Solaris system has a sniffer running is a combination of lsof and ps.What Can Happen You suspect that a Solaris server is being unlawfully accessed by several IP addresses from the Middle East. As you witness more and more of your employee accounts being used by hackers from another country, you begin to suspect there is a sniffer on the system.
Where to Look for Evidence
Since lsof shows all open files, it is also very good at identifying illicit sniffer programs that attackers run to steal valid user accounts and passwords. In general, sniffers open log files where they will store the usernames and passwords they intercept. The attacker does not want to overwrite the data he has already captured, so the files are typically opened in append mode. Therefore, these files can get pretty big relatively fast. You should run lsof and look for suspicious processes that have opened a large, unidentified file. Here is the relevant output from an lsof command showing a rogue sniffer program (line numbers added for clarity):
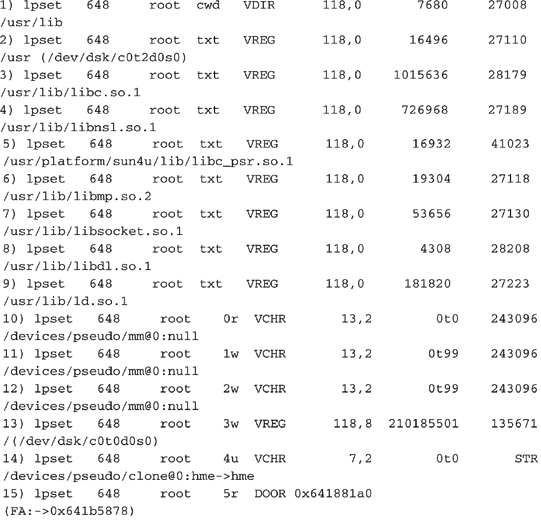
Line 14 shows that the
lpset process is accessing the network via a raw socket; hme is the 10/100 Ethernet card on a Sparc. (Seeing le here would suggest a process is accessing a 10Mbps Ethernet card.) Notice in line 13 that the process lpset has opened file descriptor 3 for writing, and the file is 210,185,501 bytes in size. That’s a pretty big file. What do you think it is?Now, all you need to do is find the 210MB file to confirm that it is a sniffer log. A
ps command on the victim Solaris server reveals where you could find the sniffer log:From this output, you can guess that the sniffer program is located in the /usr/lib directory and that the output file is named /dev/ttyt/sn.1.
The next step is to record the time/date stamps on the system, then transfer the suspected sniffer log to your forensic workstation using trusted
dd, des, and netcat commands:Make sure that the forensic workstation is receiving the connections on port 2222 and storing the data it is receiving by using the following command:
This command creates a file called sn.1 on the forensics station. You can document where you obtained the file by recording the output of an
ls -al command on the full pathname of the file.The /proc file system is a pseudo-file system that is used as an interface to kernel data structures on some Unix flavors. By changing directories into /proc, you are really accessing kernel data structures, not a true directory. Each process has a subdirectory in /proc that corresponds to its PID. Therefore, each running process will have a numerical subdirectory structure. Within this directory is vital process information that an investigator will want to review. The following illustrates the directory contents for a process called
/root/ir/lo executed on a Linux system:We execute a process called
/root/ir/lo. We then execute a ps command to obtain the PID for /root/ir/lo:
The
/root/ir/lo program is PID 970. We change directories to the /proc/970 directory to review the contents: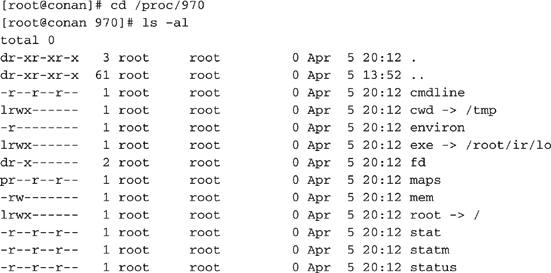
The features with the most investigative significance are the exe link, the fd subdirectory, and the cmdline file.
The Exe Link in the /Proc File System
The exe link allows investigators to recover deleted files as long as they are still running. For example, suppose that you issue the following commands:
The
/root/ir/lo program is unlinked from the file system. An ls command in the /root/ir directory will not show the lo program on the file system. However, when you review the contents of the /proc/970 directory, you see this output (again, the line numbers were added for this discussion):
Line 7 shows that the program the exe link represents has been deleted. If you are using
ls -color, it will actually display processes marked for deletion (which are the same as unlinked files) flashing in red!The Fd Subdirectory in the /Proc File System
By examining the fd (file descriptor) subdirectory, you can identify all of the files a process has open. When the Unix kernel opens, reads, writes, or creates a file or network socket, it returns a file descriptor (a positive integer) that is used to reference the file or network socket. You can usually ignore file descriptors 0,1, and 2, which are predefined file descriptors for standard input, standard output, and standard error, respectively.
In lines 6 and 7 of the following excerpt, you can see that the
lo program uses file descriptors 3 and 4 to reference network sockets. Whatever the lo process does, it is listening for some kind of network connections. In this case, lo is the Loki daemon, a backdoor server that transmits and receives input via the ICMP protocol.
The Cmdline File in the /Proc File System
Viewing the cmdline file shows the exact command-line arguments used to run an application. Normally, this is displayed when a user executes a
ps command. Here is an example of the contents of the cmdline file: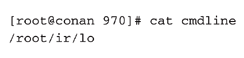
What Can Happen
An attacker runs a sophisticated program that alters the command-line file in /proc. She also unlinks any files that her rogue process created in order to hide them from a system administrator.
Where to Look for Evidence
Suppose you saw the following process:
An attacker ran a program called s in the background (hence the
& symbol). The rogue process received a PID of 827. You need to find out what this program does. Is it a rogue server that opened a network socket, or could it be a keystroke-capture program or a network sniffer logging data somewhere on your system?You immediately know to investigate the /proc/827 directory to determine which file descriptors the process opened.

When you look at the exe link in line 7, you see that the file executed is
/root/ir/s. However, the cmdline file in line 16 contains a different name: the innocuous process /usr/bin/autorun--interval=100--c.When you perform a ps on this system, you will see
/usr/bin/autorun--interval=100--c executing, rather than /root/ir/s. This is one way that an attacker can hide an evil process. You can look at the file descriptors opened by the process to gain better insight into its purpose.
Remember that file descriptors 0, 1, and 2 are just standard input, standard output, and standard error. On line 7, you see file descriptor 3 and recognize that a network socket is open. You examine file descriptor 4 (line 8) and see that a deleted file called /tmp/.xbackground is open. The attacker’s process is a clever sniffer that is logging user accounts and passwords from the network and appending them to a file that has been marked for deletion! Since the /tmp/.xbackground file is unlinked, only the
/root/ir/s process can access it. When the /root/ir/s process terminates, the /tmp/.xbackground file may be very difficult to detect and recover.There is no pretty way to dump the system RAM on Unix machines. We usually transfer the /proc/kmem or /proc/kcore file from the target system. This file contains the contents of system RAM in a noncontiguous arrangement. It is mostly used for string searches to acquire information; very few people can conduct core-dump-type analysis.
How to Change a Program’s Command Line at Runtime
We have encountered many attacks where the command line the attacker issues is changed at runtime. Let’s delve into a bit of C programming to see how attackers rename the programs they execute at runtime to hide their evil processes.
Every C program has a function called
main as its starting point. The main function can accept two parameters: argv and argc. argv is an array of string values that represent the command-line arguments. For example, argv[0], the first string in the array, is the name of the executed program. argc is an integer representing the number of command-line arguments. If you simply ran a command with no arguments, argc would equal one.Suppose that you executed the following command:
Then the
argv and argc parameters are as follows:argv[0] = tcpdumpargv[1] = -xargv[2] = -vargv[3] = -nargc = 4An attacker can change the values of the arguments by copying different values over the argv array. For example, if you add the following line of C code to tcpdump’s main function, you change the name of the program to xterm:
Now
argv[0] is equal to xterm rather than tcpdump. Then you could also copy spaces or null characters over the command-line arguments to hide what the process may be doing. This is a simple technique that attackers use to hide their processes.The kcore or kmem file analysis is conducted in a manner similar to executable file analysis. Unfortunately, the raw file must be reconstructed and resorted before you can get to the point where a standard executable file review can take place.
Most powerful Internet servers still run a Unix operating system. Many high-dollar and perhaps high-profile incidents will occur on these servers. Therefore, you will need to sharpen your initial response skills when confronted with a target system running Unix. Experiment and practice these skills as much as possible. In the next chapter, we’ll discuss forensic duplication.
1. What step is repeated twice in the live data collection process? Why is this important?
2. What is the difference between
netcat and cryptcat? Why is this important during initial data collection?3. Why is it important to record time/date stamps as one of the first steps in the live response?
4. Why perform a live response on a Unix system rather than just shut down the system and perform a hard drive duplication?
5. In what cases are
lsof and netstat similar? Why are these tools so important during initial response?..................Content has been hidden....................
You can't read the all page of ebook, please click here login for view all page.