
CHAPTER 8
Collecting Network-based Evidence
You think that your organization’s system has been attacked, or maybe an insider is emailing your organization’s trade secrets to a friend at a rival corporation. What should you do? The single most helpful network-based incident response activity is to deploy computer systems that do nothing but intercept or collect network communications. Capturing network communications is a critical and necessary step when investigating alleged crimes or abuses.
In this chapter, we will demonstrate how to capture network traffic the ugly and bare-metal way, with software such as tcpdump and WinDump. We will discuss how to assemble a robust, secure, network-monitoring system and conduct full-content monitoring of network traffic.
We refer to the result of full-content network monitoring or the interception of electronic communications as network-based evidence. Collecting network-based evidence includes setting up a computer system to perform network monitoring, deploying the network monitor, and evaluating the effectiveness of the network monitor.
Catching the traffic is only a portion of the work; extracting meaningful results is the other challenge. After you have collected the raw data that composes your network-based evidence, you must analyze that data. The analysis of network-based evidence includes reconstructing the network activity, performing low-level protocol analysis, and interpreting the network activity. We will introduce the tools that you can use to analyze the data (reassemble and display the packet captures in a usable format) in Chapter 14.
If a law enforcement officer suspects an individual of a crime such as minor drug dealing, the suspect is usually placed under surveillance to confirm suspicions, accumulate evidence, and identify co-conspirators. The same approach works with suspected crimes against computer networks. Network monitoring is not intended to prevent attacks. Instead, it allows investigators to accomplish a number of tasks:
Network monitoring can include several different types of data collection: event monitoring, trap-and-trace monitoring, and full-content monitoring. When responding to computer security incidents, you will likely rely on collecting full-content data with tools such as tcpdump. However, there may be occasions when you will intercept solely the transactional data with a trap-and-trace.
Event monitoring is based on rules or thresholds employed on the network-monitoring platform. Events are simply alerts that something occurred on your network. Traditional events are generated by a network IDS, but events can also be created by network health monitoring software like MRTG (Multi Router Traffic Grapher) or NTOP.
The following is an example of event capture by Snort, an event data generator:

GO GET IT ON THE WEB
NTOP: http://www.ntop.org
Snort: http://www.snort.org
Noncontent monitoring records the session or transaction data summarizing the network activity. Law enforcement refers to such noncontent monitoring as a pen register or a trap-and-trace. It typically includes the protocol, IP addresses, and ports used by a network communication. Additional data may include flags seen during the conversation (if TCP is used), counts of bytes of information sent by each side, and counts of packets sent by each side.
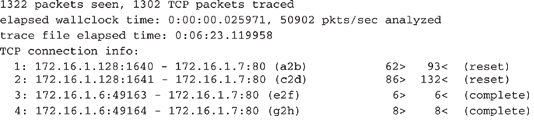
Session data does not care about the content of a conversation. Here is a sample of session data, generated by tcptrace, which is a tool that can summarize sessions. It shows four sessions from a web server listening on port 80:
Collecting noncontent data is discussed in more detail in the “Performing a Trap-and-Trace” section later in this chapter.
GO GET IT ON THE WEB
Full-content monitoring yields data that includes the raw packets collected from the wire. It offers the highest fidelity, because it represents the actual communication passed between computers on a network. Full-content data includes packet headers and payloads. The following is a sample packet captured in its entirety and displayed using tcpdump:

Collecting full-content data is discussed in more detail in the “Using tcpdump for Full-Content Monitoring” section later in this chapter.
Remember being yelled at for trying to light a cherry bomb with a blowtorch when you were a kid? Neither do we, but it brings up a good point about using the right tool for the job. Hardware and software-based network diagnostic tools, IDS sensors, and packet-capture utilities all have their specialized purposes.
Network diagnostic and troubleshooting hardware can capture data reliably and usually are the most efficient at capturing data at the full rate of the monitored network segment. However, network diagnostic and troubleshooting tools have several drawbacks that make them unsuitable for performing network surveillance. For example, they lack remote management capabilities and proper storage space, and they usually cost a lot of money.
Intrusion-detection solutions have addressed the problems of remote management and storage, and they are easily deployed. However, these platforms cannot reliably perform both intrusion detection and network surveillance duties simultaneously. Still, it is very common for an organization to use its IDS sensors as network-monitoring devices. Just remember that once you instruct an IDS sensor to begin full-content capture, its effectiveness as a sensor will diminish.
Setting up a sniffer box to perform network surveillance requires a bit of planning and preparation. Your ability to deploy a monitor may be affected by your network architecture, the bandwidth being monitored, and even external influences such as corporate politics or a limited budget.
Creating a successful network surveillance system involves the following steps:
A flaw in any one of these steps could produce unreliable and ineffective surveillance capabilities within your organization. Let’s take a closer look at how to determine your network surveillance goals, choose monitoring hardware and software, deploy your network monitor, and evaluate your monitor.
The first step to performing network surveillance is to know why you are doing it in the first place. Determine the goals of your network monitoring, because they will influence the hardware, software, and filters you use to collect evidence. Decide what you intend to accomplish, such as:
Once you have established your goals for network surveillance, make sure that the policies you have in place support these goals. For example, it is never a good idea to intercept your employees’ email in a wanton fashion. However, your organization may adopt a policy in which, under extenuating circumstances, an employee’s email activities are placed under surveillance. Make sure these policies are clearly outlined before surveillance begins.
You can buy a commercial system or build your own network monitor. The key issue is to ensure your system has the horsepower required to perform its monitoring function. It can be exceptionally difficult to collect and store every packet traversing links exceeding a T-3 or fractional OC-3. Organizations that possess such links should invest in professional-grade equipment for network monitoring. Companies selling such sturdy boxes include Niksun, Sandstorm Enterprises, and Network Associates.
GO GET IT ON THE WEB
Niksun monitoring and analysis systems: http://www.niksun.com
Sandstorm monitoring and analysis systems: http://www.sandstorm.net
Network Associates’ monitoring and analysis systems: http://www.sniffer.com
Organizations with small budgets will need to rely on homegrown solutions. In some respects, these solutions are preferable because you can customize them to suit local needs. Choose a stable, robust system and dedicate it to network surveillance.
Table 8-1 shows some suggested hardware configurations that you can use as guidelines for your monitoring system.

These three specifications—CPU type, RAM amount, and hard drive—define your collection capabilities, and we’ll take a closer look at them in the following sections. More is better in all cases (although a Pentium III with 1GB of RAM and 72GB of storage is overkill when monitoring a small firm’s ISDN line).
What’s the Best Network Monitor Form?
We have employed laptops, desktops, and rack-mounted systems for network surveillance, with varying degrees of success. Laptop systems are typically our hands-down favorite because they are portable, they have integrated displays and built-in uninterruptible power supply (UPS) systems, and they can be physically secured with relative ease. The few drawbacks of laptops include the unavailability of specialized network hardware and local storage limitations. If you need to monitor a token-ring network, for example, we have found only one PCMCIA token-ring card that can go into promiscuous mode. Local storage is becoming less of an issue, as the capacities of laptop drives are increasing at a rate only slightly slower than their full-size counterparts.
Rack-mounted systems win in the appearance and “cool points” categories, but unless it is a permanent or a WAN monitoring solution, the effort and cost for such systems are generally prohibitive. Besides, shouldn’t the decision of form factor be based on the number of systems you can fit in the back of your Jeep?
NOTE
Keep in mind that all of these configurations should have at least one network interface card (NIC) for management access, and one or more NICs for monitoring. Obviously, the NICs will need to match the media they will access, with 10/100/1000 Mb/second Ethernet NICs for Ethernet, for example.
CPU and RAM
In most cases, the system running the monitor should be at least a Pentium-class machine with 300 MHz or higher. Ensure that the system has at least 256MB of RAM. If the local segment is running at fast Ethernet speeds (100 Mb/second), a RAM amount of 512MB or more is recommended. In short, the more RAM it has, the better the network monitor will perform.
NOTE
If you are going to be running a monitor on a Sparc processor (perhaps using Snoop software), anything older than a Sparc 20 (running Solaris) will increase the possibility of dropped packets. The memory requirements of this monitor should be the same as those on the Intel platform.
Hard Drive
The amount of hard drive space your system requires depends on the specificity of your filters and the amount of network traffic traversing the monitored segment. Hard drive space is getting cheaper, so splurge and get at least a 40GB drive on a laptop and a 80GB drive on a tower. The bottom line is that you should buy a big drive. You can overcome storage deficits by continually transferring your capture files to external media. It is good practice to transfer the binary files to an external Iomega Zip, Jaz, or hard drive periodically for duplication, in case of an emergency.
Legal Issues
Be sure to control access and maintain proper chain of custody on any external media or drives used to harbor backups of the surveillance logs.
Perhaps the most difficult challenge in assembling a network monitor is choosing its software. Monitoring tools can cost a lot of money, and you might need different tools to meet different needs. You will discover that many free tools capture network traffic as well as, or better than, their commercial counterparts. However, the commercial tools generally outperform the free utilities when it comes to analyzing and interpreting the captured traffic. Each utility seems to offer something the others do not, so you should know what you need to get out of your network surveillance software before you acquire it.
Here are some factors that can affect which software you choose:
Some common commercial sniffer software packages include Sniffer Network Analyzer for Ethernet, Surveyor/Explorer, and Lan Analyzer. Choosing an appropriate operating system is as important as choosing the appropriate sniffer software that you decide to use for network surveillance. The following sections discuss operating system issues, as well as remote access, silent sniffers, and data file formats.
GO GET IT ON THE WEB
Sniffer Network Analyzer for Ethernet, by Network Associates: http://www.nai.com
Surveyor/Explorer, by Shomiti Systems: http://www.shomiti.com
Lan Analyzer, by Agilent Technologies: http://onenetworks.comms.agilent.com/lananalyzer/ default.asp
Operating System
Certain operating systems lend themselves well to performing network sniffing. Obviously, the more CPU and I/O time that is available to the network monitoring application, the better the system will operate under a heavy network load.
When you build the monitoring platform, be sure that you eliminate all applications and processes that are not essential to the operation of the operating system, sniffer, and administrative functions. This includes removing any unnecessary graphical user environments. You do not want to miss packets because the CPU is busy attempting to move an icon around on the screen!
In the dozens of systems we’ve employed, a stable Unix platform has outperformed all others. In particular, the FreeBSD operating system has provided the most efficient capturing environment, because the developers have streamlined the movement of network frames from the kernel memory space (the point of capture) to user memory space (the point of storage).
We choose FreeBSD as the operating system for our monitoring stations because it offers the following features:
You’ll see FreeBSD in use in the examples later in this chapter.
GO GET IT ON THE WEB
FreeBSD: http://www.freebsd.org
Remote Access
If you need remote access to the monitor, you can use a network connection or a modem. One approach is to install a second network adapter, connect it to a separate network or virtual LAN (VLAN), and then install remote command-level software such as OpenSSH. You should restrict the incoming IP addresses to those sites that are under your control.
Another option is to access the system via a modem line for “out-of-band” communications, or communications that cannot be intercepted easily by an attacker. Ensure that the remote access via modem is secure by requiring a minimum of user ID/password authentication. You might also want to configure the remote access via modem line so that it accepts only calls that come from specific phone numbers.
Silent Sniffers
It’s difficult for intruders to erase evidence that they are not aware of. Implementing a silent sniffer is the most foolproof way of preventing intruders from discovering your monitoring system. A silent sniffer is a system that will not respond to any packets it receives—directed IP datagrams, broadcast, or multicast. Many commercial sniffer applications will configure the network adapters for you, putting your listening interface into “stealth mode.”
To achieve the maximum stealth, you must configure your interface to speak only TCP/IP. Some other protocols, such as NetBIOS, create a lot of traffic that would compromise the location of your monitor. Unix systems are generally configured out of the box to communicate with TCP/IP only. On Windows systems, you need to make sure that you unbind all protocols (NetBIOS and IPX) except for TCP/IP. You should also disable your system from responding to Address Resolution Protocol (ARP) packets, or your monitor may be detected by the attacker. Most Unix systems support
ifconfig command-line options to turn off ARP on your listening interface. If the monitoring software requires an IP address on the listening interface, assign the system a null IP address (0.0.0.0).Another way to implement a silent monitor is to use a one-way Ethernet cable. Many agencies disconnect the transmit wires on their network cabling, which offers an inexpensive, yet effective way to minimize the chances of your sniffer system being discovered or exploited. The one-way connection protects the machine from any interactive attacks. Before deploying your monitor, it is a good idea to run a port scanner (such as Nmap) against it, as well as a sniffer detection tool (such as L0pht’s AntiSniff).
GO GET IT ON THE WEB
Data File Formats
When choosing a tool for full-content monitoring, it is prudent to consider how the information captured on your system is stored. Most commercial applications have proprietary file formats, which can make case preparation difficult when other commercial or law enforcement entities get involved. Choosing software that creates files in an open-standard format will save you (and others) many headaches.
Here are some examples of sniffers, both commercial and freely available, that use their own proprietary format for the binary capture files they create:
NOTE
Remember that apart from verifying the proper operation of the monitor, capturing and replaying traffic are never performed concurrently.
In the examples in this chapter, we use tcpdump and WinDump to capture traffic. When we move into the analysis phase in Chapter 14, we will use Ethereal to replay and view the traffic. We use Ethereal because it is included under the GNU license, it can read most types of sniffer data files, and it can run on most versions of Linux, Solaris, BSD, and Windows. It also runs on Tru64 (Digital Unix), SGI Irix, and IBM’s AIX.
An Example of Network Monitor Setup
When we set up network monitors, we start off by performing a bare-bones installation of FreeBSD on a laptop system. We create partitions using the entire drive for FreeBSD. We create a BSD disk label and use the following partition sizes:
Then, we choose the Custom Distribution Set and select individual packages to install. We install the bin, crypto, man, and ports packages. When configuring networking, we select the Secure Shell Daemon as the only service that should be active. Thus, we allow for remote access to the monitor using SSH.
FreeBSD allows you to select your security level during installation. We highly recommend that you choose the Extreme Security Setting, which provides very restrictive security settings. A pop-up window informs you that Extreme simply means that all popular network services such as inetd are disabled by default. Under the Startup Services menu, enable all PCMCIA options (pccard, pccard mem, and pccard ifconfig) when using a laptop. Exit the configuration, and it will install the services and applications that you requested.
After the system reboots, we issue a
netstat-a command to ensure that the only listening TCP/IP service is *.ssh. We then initialize the PCMCIA Ethernet adapter by issuing the ifconfig ep0 up command. This activates our Ethernet card without assigning an IP address to it. If you want to use the SSH remote access, you will need to assign an IP address and keep ARP enabled. If you wish to shut off ARP, issue the ifconfig ep0 -arp command. Without an IP address or ARP enabled, your system will run stealthily.Both tcpdump and Perl are installed by default. We run tcpdump using the appropriate filters needed to catch the desired traffic. The tcpdump utility can perform filtering even without an IP address (some tools cannot). It is important to run tcpdump with the
-n option to shut off DNS name resolution, or someone might detect your sniffer system requesting a DNS lookup. We generally process the traffic using Ethereal specialized Perl scripts that often need tweaking for each individual incident. We use the Perl scripts to separate our capture files by IP addresses, date, and other fields (which most software tools are unable to do).We also make sure that any other network-based nodes that are logging have the same system time as the sniffer box we install. We want to make sure that the traffic our monitor catches at 3:44:23 is logged at the same time by any other logging device. This way, we can have corroboration, and time correlation between host-based logs and other network logs is much simpler.
The placement of the network monitor is possibly the most important factor in setting up a surveillance system. Newer devices and network technology such as network switches, VLANs, and multiple data-rate networks (10/100 Mb/second Ethernet) have created some new challenges for investigators.
The usual goal of network surveillance is to capture all activity relating to a specific target system. Switches will segment a network by detecting the presence of workstations based on their MAC addresses. Once the switch builds a port to a MAC address relationship table, it will release packets from a port only if the receiving system is present. This means, for example, that a network monitor on switch port 4 will never see packets destined for a system on switch port 2 (unless the monitor is involved in the session). Modern switches have a feature known as switched port analysis, or SPAN, which allows one port of the switch to transmit all frames, regardless of whether the switch has detected the presence of the destination address on that port.
NOTE
If the SPAN port is already in use when you’re ready to install your network monitor, you have two choices: you can install a hub that matches the data rate of the switch (10 Mb/second or 100 Mb/second) or you can use an Ethernet tap. If you choose the former, use a single-rate hub, not one that is capable of both 10 and 100 Mb/second. On most dual-rate hubs, the data rates use different backplanes, and traffic on one backplane usually does not pass to the other reliably. If you use an Ethernet tap, be sure that your listening interface cannot transmit; using taps in a full-duplex environment may cause havoc. Finisar (http://www.finisar.com) sells reliable taps for a variety of media types.
It is also important to place the surveillance system in a physically secure location. In general, physical access means logical access. In other words, anyone who can physically access your surveillance machine can circumvent any software controls you have on it (passwords, file access permissions, and so on). When you’re deploying a system to perform network surveillance, you need to secure the system in a locked room where only a select number of trusted employees can gain access. Remember the chain of custody.
Secure the system as you normally would, including unbinding unnecessary protocols (such as NetBIOS and IPX) and removing all network services. When you issue a
netstat command, there should not be any applications or daemons listening on the TCP or UDP ports. Refer to Chapter 3 for more information about hardening systems. The operating system should be capable of communicating over IP and nothing else.When performing network monitoring, you cannot merely start tcpdump and walk away from the console. You’ll want to check to make sure the disk isn’t filling rapidly, verify that the packet capturing program is executing appropriately, and see what sort of load the network monitoring is carrying. First, use the df command to check the status of the partitions:

This output from the df command shows our /var partition has 66MB of data and 6.6GB of free space.
Next, we use the top command to check the load on the network monitor:

This output shows that the network monitor isn’t even breaking a sweat. High numbers for the load averages denote danger; here, we see zeros, which show virtually no load. However, if your disk is filling rapidly, beyond the means of your hardware, you may need to alter the sort of data you collect, as described in the “Filtering Full-Content Data” section later in this chapter.
NOTE
For more information about troubleshooting performance issues on FreeBSD, see Chapter 18 of Absolute BSD: The Ultimate Guide to FreeBSD, by Michael Lucas (No Starch Press, 2002).
As mentioned earlier in the chapter, to capture noncontent information from a network, you can use what law enforcement refers to as a pen register or trap-and-trace. On Internet-based networks, applying a trap-and-trace on your network means monitoring the IP headers and the TCP headers (or other Transport layer protocol header), without monitoring any content within the packets themselves. This is a nonintrusive way of determining the source of a network-based attack. It also can be used to detect network traffic anomalies, such as backdoor programs that allow covert file transfers that subvert detection by a normal IDS.
Trap-and-trace monitors are extremely helpful in DoS cases, where they may provide the only evidence other than oral testimony that “the router crashed six times yesterday.” If your network has an IDS, router, or web server that mysteriously crashes on a routine basis, a trap-and-trace of all network traffic to and from the victim system not only helps pinpoint the source of the problem, but will probably offer good clues about the proper technical fix. It may also be used as evidence that the attack occurred.
You can perform a trap-and-trace by using free, standard tools such as tcpdump, a long-time industry standard. There is also a tcpdump utility for Windows systems (Windows 95 and later) called WinDump, which is extremely helpful when performing trap-and-trace monitoring. WinDump is fully compatible with tcpdump and can be used to watch and diagnose network traffic according to the same rules as tcpdump. WinDump uses a libpcap-compatible library for Windows called WinPcap. Thus, tcpdump and WinDump capture files have the same binary format, so you can capture traffic using tcpdump and view it using WinDump.
GO GET IT ON THE WEB
tcpdump distribution: http://www.tcpdump.org
WinDump distribution: http://netgroup-serv.polito.it/windump/install/Default.htm
Legal Issues
The concern with trap-and-trace monitoring is to make sure you do not invade someone’s privacy by capturing any user-supplied data. For law enforcement, it is important to verify that your trap-and-trace does not capture any content. Many tools catch a certain amount of bytes by default, and you may accidentally catch some content of the packet.
The IP and TCP headers are usually 40 bytes total, but various options can make this value grow. The default for tcpdump is to capture 68 bytes per packet, but if you opt to print the output to the screen, you get a nonintrusive look at the traffic on your network.
The following command line initiates a trap-and-trace using tcpdump with no filtering and prints the output to the screen:
If you are on a busy network, you will see something like the header line shown in Figure 8-1 (repeated many times). The tcpdump program creates a header with numerous fields translated from the IP and TCP header, which gives you quicker insights than looking at plain hex.

CRIME SCENE DO NOT CROSS CRIME SCENE DO NOT CROSS CRIM
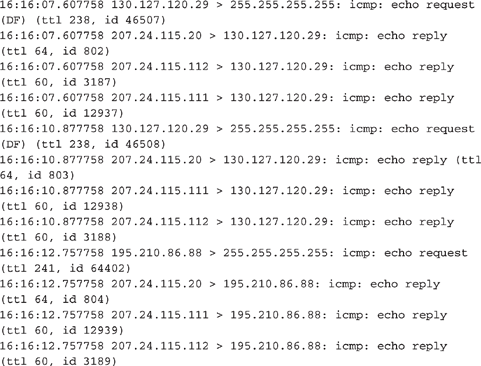
Suppose you have a machine that continues to crash but you have no idea why. You place another machine on the same segment as the crashing machine and do a trap-and-trace to see all traffic that touches that machine. The following listing shows one way to initiate a trap-and-trace using tcpdump, printing the header information to the screen.

When examining the trap-and-trace (or any network capture) output, ask yourself the following questions:
Let’s consider these questions applied to the first nine packets of the sample capture and see if we can discern a pattern.
Are the source IP addresses suspect? They are all different, and they are most likely spoofed. Packet 2 has a source IP address of 244.47.221.0. The first octet of the IP address is 244, which is part of an address space that has not been assigned to anyone. All the source IP addresses have a last octet of 0, which is ordinarily the network address, not an IP address of a specific system.
What type of TCP packets are these? If you noticed they are all SYN packets, then good job young Skywalker. Based on the time of the packets, each arriving within microseconds of each other to a Windows service port (139), some kind of flooding is going on. This appears to be a SYN flood attack against IP address 192.168.0.1. Regardless of what type of attack it is, it should be apparent that this trap-and-trace output shows that something isn’t right here.
As noted earlier, you can also use WinDump, a tcpdump-like tool for the Windows operating system, to perform a trap-and-trace. Figure 8-2 shows an example of a trap-and-trace performed using WinDump to view traffic on a network.

Notice 192.168.0.200 sending echo requests to host Thundar. Also notice that 192.168.0.200 sends UDP port 137 ICMP “port unreachable” messages to a host system named Thundar. This is because 192.168.0.200 is a Linux machine without Samba support. Therefore, there is no response to the NetBIOS packets sent by Thundar. 192.168.0.200 does not speak the Microsoft “Network Neighborhood” language.
When performing a trap-and-trace, it is simpler to create a permanent output file than it is to view the data live on the console. Without an output file, the information is lost the minute you terminate your tcpdump or WinDump process. The following command line will start capturing header information on all traffic (no filters) that touches the network adapter on the sniffing box:
If you are on a busy network, it is a good idea to stop this command line quickly, because the traptrace1 file may grow very large in a short period of time.
To view the capture file, you can use standard Unix commands such as cat and more, or Linux’s fancy less command. Here’s an example:
Usually, for computer security incident response, you will conduct full-content monitoring. Let’s think about that. If you have an employee suspected of transferring trade secrets to a conspiring party, do you just want the transaction information or would you also prefer to intercept the content of the data transmitted? When an attacker breaches the security of one of your servers, do you also want to intercept the full amount of data he sends and receives from the victim system?
We remember assisting on a military computer intrusion case where a monitor was configured to watch all telnet and ftp traffic to and from a known victim system. However, the implementers of the wiretap made a short-lived mistake. They configured the sniffer to monitor all port 21 and port 23 traffic because a known intruder was accessing those ports. However, the investigators quickly learned the flaw of their filters: The attacker logged into the victim system with valid credentials and stole hundreds of files. Although the wiretap captured the commands issued via ftp (port 21), we did not capture the content of the files transferred (the data channel).
After you have your network monitor system set up, you are ready to begin full-content monitoring, collecting the raw packets from the network. The following command line begins the writing of packets to disk with tcpdump:
Here is what the switches mean for modern tcpdump implementations (libpcap 3.6.2 and tcpdump 3.6.2 and newer):
-n Do not resolve hostnames to IP addresses or ports to port names. This avoids seeing “www” instead of “80” as the port number.-i dc0 Listen on interface dc0. The interface doesn’t need an IP address to capture packets. To bring up an interface in Unix without an IP address and without a capability to transmit packets on the wire, use the following command (replace dc0 with the name of your sniffing interface): ifconfig dc0 up -arp.-s 1514 Set the “snap” length to 1514 bytes. This will capture entire Ethernet frames and avoid tcpdump’s default snap length of 68 bytes.-w/var/log/tcpdump Write tcpdump’s output to a file in the /var/ tcpdump directory called emergency_capture.lpc. (This filename and .lpc extension are arbitrary.)& Send the process into the background.In situations where you are collecting too much traffic for your monitoring system to handle, you will need to filter the full-content data. The simplest way to implement filtering in tcpdump relies on building Berkeley Packet Filters. The tcpdump manual page offers numerous options for pointing the tool’s attention toward specific packets.
During computer security incidents, we often depend on watching traffic either from hosts of interests or to hosts of interests. For example, to record all traffic to or from the 12.44.56.0/24 network block, we would use the following command line:
The following command line can be used to collect all traffic to and from a specific host (IP address 172.16.1.7):
In order to collect all network traffic from a network block of 12.44.56 and to collect all packets to and from the system with an IP address of 172.16.1.7, you can use the following command line:
When your filters start becoming complex, you can put them in a file and reference them from the command line. The following file could be used to implement the previous example in a simpler, neater format. For example, you can create a file called tcpdump.ips (this filename is arbitrary) with these contents:
Now you can reference tcpdump.ips from the command line using the
-F switch:Two other aspects of collecting full-content data merit attention: filenaming and ensuring file integrity.
Giving capture filenames unique elements helps identify their origin and purpose. We like to include a timestamp, hostname, and interface in the capture filename. To expand on our previous collection example, we could use the following:
This command would produce a file with the following name, if started on February 10, 2003, at 15:18:50, on a system named archangel, listening on interface dc0:
We include the DMY to remind us that the characters that follow are the day, month, and year. The HMS specifies that the hours, minutes, and seconds follow. Of course, you can use a different system to suit your personal preferences.
Beyond using a unique naming convention, it is forensically useful to perform MD5 or SHA hashing of full-content data files. Both Unix (md5 or md5sum) and Windows (via third-party applications, like md5sum.exe) provide this capability. Ensuring the integrity of evidence is as important with network traffic as it is with information collected from host forensic investigations.
GO GET IT ON THE WEB
md5sum.exe for Windows: http://unxutils.sourceforge.net
Do not overlook all the potential sources of evidence when responding to an incident! Most network traffic leaves an audit trail somewhere along the path it traveled. Here are some examples:
When you combine all the existing pieces of network-based evidence, it may be possible to reconstruct specific network events such as a file transfer, a buffer overflow attack, or a stolen user account and password being used on your network.
TIP
Network-based logging offers some advantages over standard system-based logging. Anyone who has access to a system, whether remotely or locally at the console, may alter any file or a function that the system performs. Therefore, there is a compelling argument that properly handled network-based logs may be more reliable and valid than host-based system logs from a victim machine. This is especially true when physical access and command-level access to the network devices are rigidly controlled. Surveillance logs are specifically generated as network-based evidence that was collected in a controlled manner with an established chain of custody.
While all these sources of network-based information can provide investigative clues, they often present unique challenges to the investigator. Network-based logs are stored in many formats, may originate from several different operating systems, may require special software to access and read, are geographically dispersed, and sometimes use an inaccurate current time. The challenge for investigators is in locating all these logs and correlating them. It is time-consuming and resource-intensive to obtain geographically dispersed logs from many different systems, maintain a chain of custody for each of them, and reconstruct a network-based event. Many times, the proper combination of all these logs still paints an ugly, incomplete picture. Therefore, many organizations perform network surveillance, as explained in the previous sections of this chapter, to augment the data they obtain from other relevant logs.
Evildoers are becoming too competent for your organization to simply rely on host-based logging (or host-based logging can be that bad!). Many times, the attackers have root-level access on hosts, and they can alter or destroy the evidence they may have left behind for investigators to mull over. Network monitoring may offer the only clues to what types of attacks are occurring. Therefore, during a computer security incident, you may opt to follow the quick and simple steps outlined in this chapter to start collecting network traffic. Managing the information collected and deciding how to proceed becomes the next challenge.
1. What are some of the devices that harbor network-based evidence?
2. Why do you want to shut off the ARP protocol on your network security monitor’s sniffing interface?
3. List four different scenarios in which you would initiate full-content monitoring on an insider (such as an employee, co-worker, or student).
4. A small ISP requests your help. The technicians report that they have had no downstream access to the Internet. They believe the problem lies with their access provider. They provide you with the following logs. What type of attack is this? What can be done to fix the problem?
5. A local ISP receives a phone call from a user who states that he cannot access the mail server. The ISP technician conducts a review of the mail server and does not see any problems. She decides it is not the host itself creating the problem, but rather some sort of network-based attack. She decides to capture network traffic using tcpdump. Looking at the tcpdump output below, what common attack is she faced with? What is the cure?

..................Content has been hidden....................
You can't read the all page of ebook, please click here login for view all page.