
CHAPTER 15
Investigating Hacker Tools
During investigations of computer crime, particularly computer intrusions, you will encounter rogue files with an unknown purpose. You know that the rogue file is doing something that the attacker wants, but all you have is a binary file and perhaps a few theories about what that file does.
Tool analysis would be much simpler if attackers left their source code behind. But most attackers have something in common with Microsoft: They protect their source code. Without it, you are left to muddle through object code and trace the functionality of the program.
In this chapter, we outline a sound scientific approach to performing tool analysis. You will learn how to take an executable file with an unknown function and perform operations on it to gain insight into the file’s intended purpose.
If you are lucky, the hacker tools have filenames that give enormous clues about their function. A file called sniffer or esniff is likely to be a sniffer tool. However, it is more likely that the attackers have renamed their code to some innocuous system filename such as xterm or d.1. These names offer few clues about the function of a rogue program. Therefore, you will need to analyze these tools to achieve the following goals:
A compiler, such as the GNU C compiler, reads an entire program written in a high-level language, such as C or Pascal, and converts it to object code, which is often called machine code, binary code, or executable code. Think of compilers as programs that translate human-readable source code into the machine language that a system understands. Machine language can be directly executed by the system’s processor.
There are many ways for attackers to compile their source code. Some methods of compilation make tool analysis easier than others. It is common sense that the larger the binary file is, the more information investigators can obtain when performing analysis of the file. In the next few sections, we explain the different ways a program can be compiled and how each affects the amount of information available to the investigator during tool analysis.
A statically linked executable file contains all the code necessary to successfully run the application. It typically does not have any dependencies. This means that the program will run without relying on a specific version of an operating system. Some commercial applications that you download from the Internet may be statically compiled so that they do not depend on any libraries on your system. For example, Sun Microsystems’ StarOffice is distributed as a statically linked package. Sun distributes StarOffice in this format to overcome the differences in the various distributions of the Linux operating system.
Here is an example of a command to statically compile a program within the Linux operating system using the GNU compiler:
In this command line, the source code zap.c was compiled to create a statically linked object file called zapstatic.
NOTE
As you learned in Chapter 13, zap is a log-wiping tool that erases a specific user’s entries from the utmp, wtmp, and lastlog files.
Nearly all modern operating systems support the use of shared libraries, which contain commonly used functions and routines. By compiling a program to use the shared libraries, a programmer can reference them somewhere in memory when the program needs to use those functions and routines, rather than incorporating all that code in the application itself. This reduces the size of the executable file, conserves system memory, and permits updates to the shared libraries without the need to change any of the original programs. Programs that use shared libraries are dynamically compiled. Each dynamically compiled program references the single copy of the shared library located in memory. Figure 15-1 illustrates how dynamically compiled and statically compiled programs use system memory.

Dynamically linked programs are the standard type. Using the GNU compiler, the following command line yields a dynamically compiled executable file:
The default behavior of the GNU compiler creates a dynamically linked executable.
On rare occasions, you will be lucky enough to encounter hacker tools that have been compiled in debug mode. Debug compilations are normally used by software developers during the early stages of the program’s development to help them troubleshoot problems and optimize their code. When debug options are enabled, the compiler will include a lot of information about the program and its source code.
The following command line shows how you would use the GNU compiler to compile the source code file zap.c with the debug options enabled. Notice that this is accomplished by adding the -g option to the command line.
There are three debug levels that display increasing amounts of information. The default is level 2. Depending on the debug level, GCC may produce information to facilitate backtraces, descriptions of functions and external variables, local variables, and macro definitions.
The following is a listing of a directory that contains the log-wiping tool zap compiled dynamically, statically, and with debug options.

Notice the size of each version. The dynamically compiled zap is 13,217 bytes, and the static zap is 1,587,273 bytes in size. The static zap binary file is more than 120 times larger than the dynamic zap binary file. The debug version contains additional data, making it nearly twice the size of the dynamically compiled zap.
Strip is a function that discards all symbols from the object code to make a file much smaller and perhaps more optimal for execution. Since stripped, dynamically compiled programs result in the smallest size executable, these types of files are usually the most difficult for an investigator to analyze when using string and symbol extraction techniques. For example, if the file has not been stripped and contains symbols, the nm command will display them. Conversely, the
strip command will remove that information.The following command line demonstrates using the GNU version of
strip and shows how much smaller the dynamically compiled, stripped version of zap is compared to the files created with other types of compilation.NOTE
Most utilities generate a new file, but
strip modifies the actual content of the object file specified on the command line.
Notice that stripping the dynamically linked zap program (zapdynamic) shrinks the file size from its original size of 13,217 bytes (as shown in the previous section) to 4,400 bytes.
UPX, or the Ultimate Packer for eXecutables, is becoming increasingly popular as an effective compression tool for executable files. Perhaps another reason for its popularity is that attackers can use it to obscure their illicit programs from signature-based IDS. UPX will pack and unpack Linux and Win32 applications, as well as DOS 16-bit executable and .com files, DOS 32-bit COFF files, DOS 32-bit executables, and Atari TOS/MiNT executables.
A review of the ASCII-formatted strings within the rogue code will show whether UPX was used to compress the executable, as shown in the example in Figure 15-2. If you find an executable packed with UPX, you should decompress it using UPX in order to be able to review the strings contained within the normal executable file. You can review the strings in a file using the strings command, as described in the “Reviewing the ASCII and Unicode Strings” section later in this chapter.

Symbol Extraction
If a file has not been stripped (with the
strip command), an investigator may be able to analyze it using string and symbol extraction techniques. To extract symbols from a Unix object file, use the nm command (-a means list all):
In the nm command output, the first column is the symbol value in hexadecimal, followed by the symbol type, and then the symbol name. For symbol types, if the character is lowercase, it represents a local variable. Uppercase characters represent global (external) variables.
Here are some examples of symbol types:
A indicates an absolute value (it won’t be changed by further linking).B indicates an uninitialized data section.C indicates a common section (uninitialized data).D indicates an initialized data section.N indicates a debugging symbol.R indicates a symbol in a read-only data section.T indicates a symbol in a text or code data section.U indicates an undefined symbol.When debugging information is included, nm’s list line numbers command-line option, –l, may provide valuable information:

Compare this to the previous non-debug output, and you will notice that the
kill_utmp function started at line 17 of the file zap.c, which was in the directory /home/johndoe. The kill_wtmp function started at line 33 of the source code, and kill_lastlog started at line 59. Even without the source code, the line numbers provide valuable information, such as the procedure names and number of lines of code for each procedure, along with path information. In this particular case, the procedure names also shed light on the capabilities of the utility.TIP
Any version of UPX can handle all supported formats. For example, the Win32 version can unpack UPX-compressed Linux executable linked format (ELF) binary files.
GO GET IT ON THE WEB
Now that you’ve been exposed to several compilation techniques, let’s examine a suspect file called Z, found recently on a Linux system.

The
file command output (discussed in the “Determining the Type of File” section later in this chapter) clearly indicates that UPX was used to pack this file. The next step is to use UPX to unpack (decompress) the suspect binary.The following command decompresses (unpacks) the suspect file and stores the output in the file named foo.

Since the previous
file command was executed on the compressed file, we run the file command again. As you can see, the uncompressed object file was not stripped.While a previous
strings command showed little of value (since the file was compressed), executing strings -a on the unpacked output file immediately reveals material of interest:

From this
strings output, you can see the program looks for the /var/run/utmp, /var/log/wtmp, and /var/log/lastlog files; has functions kill_utmp, kill_wtmp, kill_lastlog; and contains the word “Zap.” Additional debug information is present, and we can see that the GNU version 3.2 of GCC for Red Hat Linux version 8.0 was used to compile the tool.Static analysis is tool analysis performed without actually executing the rogue code. Because you do not intend to execute the rogue code during static analysis, you can perform static analysis on any operating system, regardless of the type of object code. For example, you can use the Solaris operating system to perform static analysis of a Win32 application.
The general approach to static analysis involves the following steps:
1. Determine the type of file you are examining.
2. Review the ASCII and Unicode strings contained within the binary file.
3. Perform online research to determine if the tool is publicly available on computer security or hacker sites. Compare any online tools identified with the tool you are analyzing.
4. Perform source code review if you either have the source code or believe you have identified the source code via online research.
Once you have identified the executable files that require tool analysis, your next step is to determine how the executable files were compiled, as well as their native operating system and architecture. There are many different types of executable files you may encounter, including the following common types:
Fortunately, both Unix and Windows provide a command that retrieves the needed information.
Using the Unix File Command
The standard command for determining a file type on Unix systems is
file. The following example shows the results of using the file command on several different types of executable programs:
You can see that the
file command can accurately determine how files were compiled and can also identify the operating system and architecture on which the file will execute. (ELF executables are the most common type of executable files for Linux and other Unix flavors.) The /usr/share/magic file offers approximately 5,000 different file types that Linux will recognize with the file command.Using the Windows Exetype Command
The Windows equivalent of the file command is the NT Resource Kit tool exetype. This tool recognizes fewer file types than the file command, but it is still extremely useful. Figure 15-3 demonstrates how the exetype command is used.

Basic static analysis of object code involves examining the ASCII-formatted
strings of the binary file. By identifying keywords, command-line arguments, and variables, you will acquire some insight into the purpose of a program.The command used to extract ASCII
strings is strings. The strings command is standard on most Unix variants and is available for Windows from the Sysinternals web site. The strings command has the following syntax:This command line will display all ASCII
strings contained in the object code that are four characters or longer. Notice the -a option. If this option is omitted, the Unix variant will scan only portions of the binary file.On Windows-based executables, it is important to perform Unicode string searching as well. Windows 2000 is built on Unicode, and many Windows-based applications use Unicode. The
strings utility available for Windows defaults to performing a Unicode search when used with only the filename as the command-line argument.NOTE
Unicode is a standard character set that uses 2-byte values to represent a character. Because Unicode uses 16 bits to represent a single character, there are more than 65,000 characters available, which makes Unicode capable of encoding characters from many different languages. Currently, Unicode values are defined for Arabic, Chinese, Cyrillic, Greek, Hebrew, Japanese Kana, Korean Hangul, English, Armenian, and several other languages.
Hex editors are to the computer investigator what a hammer and nails are to a carpenter. When all analysis fails, the hex editor is our friend. However, when performing static tool analysis, the hex editor is only slightly better than the
strings command. It allows you to see Unicode and ASCII strings within a file at the same time.Anything that the program does not dynamically create or take in from another source, such as command-line interaction, may be found in the object code. When you review the strings in the object code, look for the following items:
GO GET IT ON THE WEB
Windows version of strings: http://www.sysinternals.com
What Can Happen
You obtain a rogue executable file from a compromised Linux system. You decide to examine the strings to unearth some clues about the file’s function. You can guess it is the infamous log-wiping tool zap, since the file is called zap.
Where to Look for Evidence
You decide to analyze the tool on a Windows system to avoid accidentally running the program. You execute the
exetype command to confirm that it will not execute properly on your Windows forensic workstation, as shown in Figure 15-4.
Examining the
strings output confirms your suspicion that the tool is most likely the zap utility. In the strings output, shown in Figure 15-5, you see some relevant lines. There appear to be variables or functions named kill_utmp, kill_wtmp, and kill_lastlog.
The strings command yields the filename of the source code used before compilation and the compiler version used to create the rogue file. Figure 15-6 shows the exact compiler used to create the rogue file. This information is useful if you are able to locate source code that you believe is similar to the binary in question.

There was a time when it seemed everyone’s tool analysis was nothing more than scouring the Web for a tool with the same name as the rogue file. This is certainly not a comprehensive way to do tool analysis. However, knowing whether or not there have been other attacks incorporating the same tools you have discovered is very helpful. You can perform the
strings command on rogue executable files to determine the compiler used to create the executable file. If you find an online tool that appears to have a similar function, you can compile the publicly available source code with the identical compiler used by the attacker and examine the resulting file size. A very narrow margin in size may suggest the tools are similar. If the tools are exactly the same size, then you have just found your source code to the hacker tool.Publish Advisories
Once malicious code is identified, the details of the attack (MD5 sums, location of code, and so on) can be published in advisories (such as NIPC bulletins) so that other organizations can check for the existence of this code.
With the source code available to you for review, you will be capable of determining exactly what a rogue program does. Therefore, obtaining the source code is probably the best measure for performing comprehensive static analysis of a program. Two occasions when you will be lucky enough to perform source code review include when the attacker leaves the source code on a system and when you identify the identical program from another source (perhaps online) with the proper source code.
While performing incident response for a global client, we discovered that the attacker had installed a toolkit that contained 15 tools. Unfortunately, one of the main tools used by the attacker was deleted from the system, and we could not recover it using standard undelete tools. We conducted an online search and found that there were other victims with the same tools installed on their systems. One of the victim sites even posted the tools the investigators believed were used on their compromised systems. This toolkit had the file we needed to fully reconstruct the attack. An MD5 sum of the tools obtained online matched those of the tools we recovered from our client’s system. We gained additional insight from the other victim’s analysis of the attack, and we could provide law enforcement with a list of victims to prove how widespread the new attack was becoming.
Performing source code review requires working knowledge of the programming language used to create the tool. Most popular exploits and tools are found in ANSI C and Microsoft Visual Basic scripting, so you should become familiar with these formats.
Dynamic analysis of a tool takes place when you execute rogue code and interpret its interaction with the host operating system. This can be dangerous because whatever ill effects the rogue code intends may take place on your forensic workstation. However, this is often the most enlightening form of tool analysis. Our methodology includes the following tasks:
When conducting dynamic tool analysis, you are actually executing the rogue file in order to document the effects it has on a system. Therefore, you need to invest the time to set up the proper test environment.
First, make sure that you have the operating system and architecture necessary to execute the object code properly. Also, install VMware on your test system. VMware allows you to run the tools in a controlled environment that will not damage the forensic workstation on which you are executing the rogue code. A feature of VMware, called nonpersistent writes, allows the investigator to execute rogue code in an environment where the ill effects of the rogue code will not be saved to the disk. To enable this feature, open the VMware Configuration Editor and choose the Nonpersistent radio button for the Mode option, as shown in Figure 15-7. This mode allows you to execute the rogue code in a “fresh” installation of an operating system.

Make sure that the test system is not connected to the Internet. You do not want to execute or install rogue code when connected to the Internet (or any network). Some illicit applications send “beacon packets,” or phone home. You may be alerting the attackers that you have both acquired and executed their attack tools.
If you suspect the rogue code may create or respond to network traffic, it is a good idea to execute it on a closed network. Monitor the closed segment with a sniffer running on a separate system on the closed network. Closed means that no systems you care about are on this network.
GO GET IT ON THE WEB
VMware:http://www.vmware.com
We got quite a scare when we were performing tool analysis on a program found at a military site. The file was placed on the system by an international attacker. We did not want to alert this attacker that we were both sniffing his connections and retrieving and analyzing his tools. As it turned out, his tools were mostly homegrown, and their functions were rather complex. We obtained one tool that held our attention until the early hours on a Saturday morning. We were performing dynamic tool analysis, and decided to run the tool for the first time. As soon as we ran the tool, we noticed a packet was generated on the network that appeared on our network monitor. I raced to the T-g1 line on the wall to pull the cable and terminate our Internet connection. Luckily, we had already done that! The software produced a beacon packet that could have alerted the attacker that we had run his tool. He would have at least obtained our IP address, and that would have been bad!
Most applications execute in a memory area defined as user space. User space applications are typically prohibited from accessing computer hardware and resources directly. These resources are controlled by the kernel to enforce security, maintain nonconcurrent use, and provide stability of the operating system. User applications access these resources by requesting the kernel to perform the operations on its behalf. The user application makes these requests to the kernel via system calls.
Using Strace
Unix has a tool that traces the use of system calls by an executed process. This tool, called
strace (system trace), is essentially a wiretap between a program and the operating system. The strace command displays information about file access, network access, memory access, and many other system calls that a file makes when it is executed.CAUTION
Remember that when you use
strace, you execute the rogue code. Therefore, it is important to use a stand-alone workstation (with no outside network connectivity) that you do not mind altering (or even crashing).Here is an example of executing the strace command:
This command line will store the interaction between the zap program and the operating system in a file called strace.out. Remember that the zap program will execute, performing its nefarious operations.
The following is a review of the strace.out file. For the sake of expediency, you can ignore every line before line 19, the
getpid call. All lines that precede the getpid system call are standard for setting up the proper environment for the process to execute. The line numbers were added by the authors for easy review.
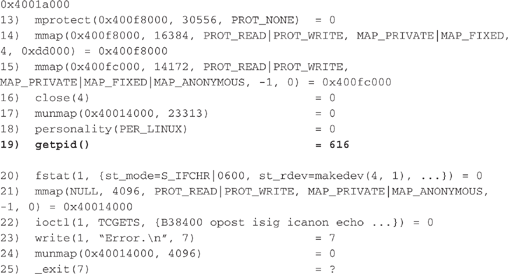
Oversimplifying a bit, line 23 is our biggest clue of what took place when we ran the command
./zapdynamic. An error message of seven characters, “Error.
” (
signifies a new line), was printed to file descriptor 1. File descriptor 1 is used as standard output, which is usually the terminal or the console a user is viewing. Thus, the word Error was printed to the screen. A valid conclusion would be that we did not have the proper command-line arguments to make zap run properly.NOTE
File descriptors are nonnegative integers that the operating system (kernel) uses to reference the files being accessed by a process. File descriptors 0, 1, and 2 are the predefined file descriptors for standard input, standard output, and standard error, respectively. When the kernel opens, reads, writes, or creates a file or network socket, it returns a file descriptor (integer) that is used to reference the file or network socket.
Examining Strace Output Since zap erases a specific user’s entries from the utmp, wtmp, and lastlog files, a logical conclusion would be that the command line contains that specific user’s username. Therefore, we can execute the
strace program again with a proper command line. Let’s examine the output and see how it can be used to analyze the zap program.
Lines 1 through 18 are the system calls done by the operating system to set up the environment needed for the process to execute. These calls work as follows:
execve call in line 1 shows the command-line arguments.brk system calls are used to allocate memory for the process.mmap calls map a portion of a file into memory. This is typically done when loading runtime libraries when a process is initially executed.fstat call obtains information about the file that is referenced by the file descriptor. fstat can return the time/date stamps for a file, the owner of a file, the size of a file, the number of hard links, and practically any information needed by the program to access the file.close system calls are used to release a file descriptor when the process no longer needs the file or socket referenced. For example, in line 16, file descriptor 4 is closed. This releases file descriptor 4, allowing it to be reassigned during the next system call that requires a file handle (such as open or mmap).Everything above line 19, the
getpid system call, is basically standard for all dynamically linked ELF executables.
The operations specific to the zap program begin after the
getpid system call in line 19. Each running process gets a unique process ID from the getpid call. Notice that the process running received a process ID of 618. In line 23, a Unix socket is opened for transferring information between processes. Do not mistake this for a network socket! Unix sockets are opened when a process wants to exchange information with another running process.
The process is looking for authentication or host lookup information in lines 27 through 30. In line 27, the /etc/nsswitch.conf file is successfully opened. Typically, reading the nsswitch.conf file suggests the program will read the /etc/passwd file as well.

In line 46, the zapdynamic program opens the /etc/passwd file as file descriptor 4. Notice that the /etc/passwd file was opened read-only, as indicated by the
O_RDONLY argument.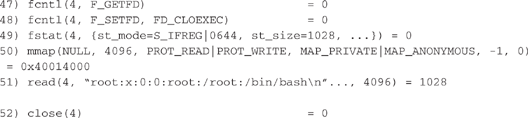
In line 51, the zapdynamic program reads the entry for user
root in file descriptor 4, which is the /etc/passwd file. Then it closes file descriptor 4 in line 52.In line 54, the zapdynamic program opens the file /var/log/lastlog as file descriptor 4. Notice that it opens /var/log/lastlog for read and write access, as indicated by the O_RDWR argument.

In line 56, the zapdynamic program writes
�, or clears 292 bytes in file descriptor 4, which is /var/log/lastlog. This is where the program is doing its dirty work. In line 57, the process closes file descriptor 4 (the /var/log/lastlog file).
In line 58, the zapdynamic process opens /var/log/wtmp for reading and writing (
O_RDWR) as file descriptor 4. In lines 59 through 63, it reads, writes, and then closes file descriptor 4.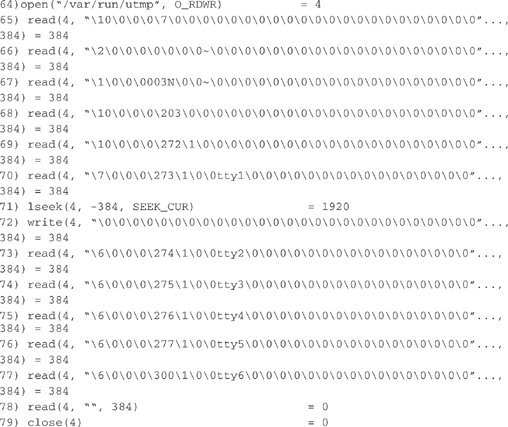
In line 64, the zapdynamic process opens the file /var/run/utmp for read and write access (
O_RDWR) as file descriptor 4. In lines 65 through 79, it reads, writes, and then closes file descriptor 4 (/var/run/utmp). Notice how lines 73 through 78 show zapdynamic reading in records of 384 bytes. The application is scanning through the file, looking for entries referring to the username that was passed on the command line. When it finds a match, such as on line 70, it rewinds the input 384 bytes, and then overwrites the record. The application continues until the end of the file is reached.Using Shortcuts with Strace When reviewing
strace output, you will be interested in only a few of the system calls, and you will rarely need to be concerned about memory allocation calls such as brk, mmap, and munmap. We recommend that you search the strace output file for open, read, write, unlink, lstat, socket, and close system calls.A shortcut is to use the option
-e trace=file. This will show all system calls that interact with a filename. To display all interactions with a network device, use the option -e trace=network. Many more combinations are available, and they are listed in detail in the main page for strace.Once you zero in on a particular operation that you think is suspect, you can save a copy of all the data transferred with the
-e write command. If you are investigating a network-based tool, you will find this method much easier than relying on tcpdump to capture the raw data.What Can Happen
A system administrator at your organization is notified that one of her Linux systems seems to be one of the sources of a distributed denial-of-service (DDoS) attack. You need to discover which process is listening for the commands, so you can obtain it, terminate it on the victim system, and then search other systems for a similar rogue process.
Where to Look for Evidence
Your first step is to determine which sockets are open and which processes are responsible for listening on each socket. Linux’s
netstat -anp command will map processes to the open ports.
We do not include the output below the “Active UNIX domain sockets” line because it is rarely relevant to the investigation.
There are several big clues within the region shown in bold type, identifying the rogue process. Notice that a program called
xterm with a process ID of 668 seems to be listening for ICMP packets. Since ICMP is a common channel that illicit DDoS servers use for communications, all processes opening raw ICMP sockets should be suspect. The raw sockets above contain either a 0.0.0.0:1 or a 0.0.0.0:6 in their entry. The raw socket with the :6 is the raw TCP socket. It is almost always present on TCP/IP-based Linux systems. Two processes have 0.0.0.0:1, or ICMP sockets open (the :1 signifies a raw socket of protocol type 1, which is ICMP). This system has two processes listening for ICMP. Since one is the kernel, the other process is immediately suspicious.The next step is to conduct static and dynamic tool analyses on the program
xterm to determine what it does. The following command line performs a system trace of the program, with the -f argument ensuring that all child processes are also traced during execution.

Reviewing the relevant lines of the
strace output, notice in line 1 that this process opens an ICMP socket with file descriptor 4. In lines 2 through 4, the parent process 676 closes file descriptors 0, 1, and 2 (for standard input, standard output, and standard error). This is standard behavior for a process that intends on becoming a daemon, or a stand-alone application, disassociated from the terminal. In line 5, the parent process spawns a child process that simply reads file descriptor 4, the ICMP socket. All ICMP packets destined for this system will be processed in some fashion by this program.Conducting Analysis Beyond Strace
The
strace utility cannot do everything. By reviewing the system traces, you cannot determine what the process is doing once it reads, writes, or receives values from the system calls. For example, strace does not provide information concerning the command-line arguments needed to execute a process correctly.When
strace fails to provide the insight you require to obtain a comprehensive understanding of a process’s function, you may need to resort to techniques such as debugging and decompiling. The debugger will allow you to step through every action a program takes during its execution.NOTE
If you want more information about analyzing Unix program files, find a copy of Panic! UNIX System Crash Dump Analysis Handbook, by Chris Drake and Kimberley Brown (Prentice-Hall PTR/Sun Microsystems Press, 1995). This book, despite being written for the analysis of Sun core dump files, will help you become familiar with looking at the memory areas and file formats for Unix executables.
To use decompilers and debugging techniques, you need to understand the structure of Unix program files. More information on ELF binary structures and disassembly is available at the Linux Assembly web site. Another source for information is the Tools Interface Standards and Manuals on the Dr. Dobbs Microprocessor Resources web site, which give information about the internal file structure used by modern object files. Armed with this knowledge, you can start tearing apart suspect tools under Unix with
objdump, nm, and gdb.Recompile the GNU Binutils Package
The binutils package that is installed on most versions of Linux is built to recognize a small number of object file types. This means that the tools in the precompiled binutils package may build, view, disassemble, and otherwise alter a handful of Linux native executable files. A simple recompile of the package with the
./configure -enable-targets=all command will allow you to perform these same operations on more than 100 types of object files. You can obtain the complete binutils package from the GNU FTP site.GO GET IT ON THE WEB
Information on ELF binary structures and disassembly: http://linuxassembly.org
Dr. Dobbs Microprocessor Resources, Tools Interface Standards and Manuals: http://x86.ddj.com/intel.doc/tools.htm
Complete binutils package: ftp.gnu.org
Dynamic analysis of a Windows-based application is a bit different than the analysis of Unix-based tools, but the basic concepts are the same. You execute the rogue code and use utilities to watch how the rogue process interacts with the file system, the Registry, the application programming interfaces (APIs), and the operating system. For dynamic tool analysis of Windows applications, we use Filemon, Regmon, ListDLLs, Fport, and PsList.
GO GET IT ON THE WEB
Filemon, Regmon, ListDLLs, and PsList: http://www.sysinternals.com
Using Filemon
The Filemon utility (from the Sysinternals web site) provides a wiretap between running processes and the file system. It intercepts all access and queries a process makes to the file system. When you execute the rogue code, you will be able to determine all of the files the program reads, writes to, and accesses to perform its unknown activity. Figure 15-8 shows an example of using Filemon.
Using Regmon
Regmon (also from the Sysinternals web site) taps a process’s interaction with the Windows Registry. It won’t take long for you to recognize that some programs query, enumerate, and close more than 950 Registry keys upon execution. Regmon allows you to enter filters to focus your analysis on relevant entries. Another nice feature of Regmon is that it provides immediate access to the Registry Editor (regedit).
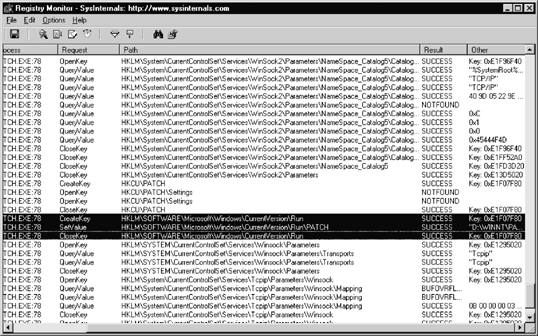
Regmon provides a simple interface to monitor which programs write startup entries in the Registry and which programs query the network hardware in order to generate or receive network traffic. Figure 15-9 shows an example of using Regmon. The highlighted lines in the example show a rogue process (the Netbus server) creating a key, setting a value, and closing a key to ensure that the rogue process is executed when the system is rebooted.
Using ListDLLs
ListDLLs, available in the NT/2000 Resource Kit, shows all of the DLLs needed by a process. It enumerates the full pathnames of the DLLs loaded by the process. ListDLLs is helpful for detecting applications that have been modified (injected) with extra functionality. You will notice that many programs that require the use of the network use Netapi.dll, MPR.dll, and Wsock32.dll. (The Netapi and MPR DLLs provide NetBIOS support, and Wsock32 provides TCP/IP support.) Viewing which DLLs the program is using may allow you to detect if the application is interacting with the network services at an API level or if it is attempting to bypass them. Note that the program must be running for ListDLLs to work!
Using Fport and PsList
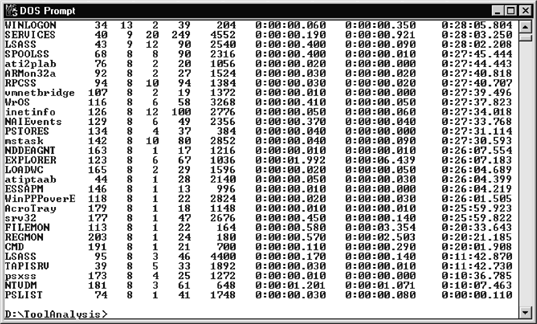
Fport and PsList are critical tools for dynamic analysis on a Windows system. Fport should be used prior to and after executing a rogue process to determine if the rogue process opened any network sockets. PsList is useful to determine if a process changes its process name after execution. Figure 15-10 shows PsList output where a Subseven Server was executed with the option that has the server select an arbitrary name. Notice process ID 173. The original process executed was called server.exe, but the process is listed as psxss.
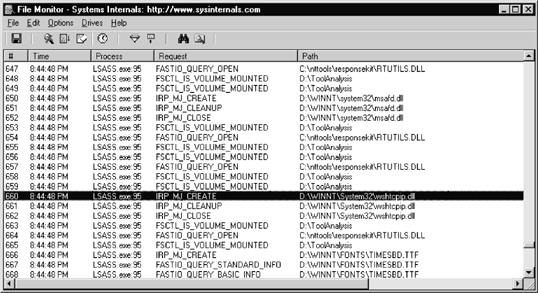
Attackers are generally smart enough to name their rogue processes a little better than the obvious name used in Figure 15-10. Figure 15-11 shows how Fport is used to identify rogue processes opening network sockets. In the example, the process ID is 95 and it is called LSASS. LSASS is the Local Security Authority Subsystem, and it does not open any network sockets. The attacker merely chose LSASS as the name for her rogue process in order to hide the process by making it look innocuous.

ListDLLs is an excellent tool to use to identify the full command line of all the files executed. Figure 15-12 identifies a suspect process called 1.exe that was executed with the command line
-i 0 23. The trained investigator may assume that the -i 0 stands for interface, and that the 23 could be a command-line argument assigning a sniffer to capture port 23 (telnet) traffic.
Use an Anti-virus Program on a Rogue Application
Here is a simple way to determine what a rogue application is: Copy the application to a floppy disk and run an anti-virus program on the floppy disk. The anti-virus program may be able to identify the rogue code.
Conducting Further Analysis on Windows
The tools described in this chapter provide the first level of analysis. However, as with Unix analysis, more comprehensive techniques are available for Windows analysis. Decompiling and debugging are the next steps. A couple of excellent tools in this area are IDA Pro (an interactive disassembler) and SoftICE (a source-level debugger). IDA Pro provides disassembly capabilities for a wide variety of operating systems and file formats. SoftICE provides debugging capabilities for Windows systems.
GO GET IT ON THE WEB
IDA Pro: http://www.datarescue.com
Proper tool analysis can help prevent future attacks, determine the extent of compromise, and determine the number and type of intruders. It helps dramatically during subject interviews. We have used tool analysis to identify hacker groups, correlate different attacks, and assess an attacker’s skill or threat level. Proper tool analysis is extremely helpful during containment and cleanup phases of incident response as well. After identifying the type, names, and location of tools, you can scan the network for other occurrences of the same tool.
1. Which type of binary is more difficult to analyze: dynamically or statically compiled? Why?
2. How can hacker tools be captured when no executable is stored on the file system?
3. Is the particular operating system used by the forensic investigator important during static analysis? Why or why not?
4. Describe the critical factors necessary for dynamic analysis.
..................Content has been hidden....................
You can't read the all page of ebook, please click here login for view all page.