
Establish Consistent Work, Many-Level Reviews, and Certification
Step Eight
Applying the principles of consistent work, many-level reviews, and certification constitutes the eighth step of the problem-solving process.
Consistent Work
Consistent work is a synonym for unvarying job performance. Clear and defined consistent work specifies the required operations and the method in which they must be performed. Clearly defined instructions are essential to ensuring quality performance. Posted job instructions allow employees to rotate jobs and to operate in cell arrangements while preventing faults.
![]() Tip Post job instructions at every workstation to ensure consistent work. Posted instructions also help in manufacturing situations, where plant personnel rotate jobs or work in cells.
Tip Post job instructions at every workstation to ensure consistent work. Posted instructions also help in manufacturing situations, where plant personnel rotate jobs or work in cells.
When you establish methods to prevent flaws and address the conditions that caused them, you become more effective. When problems do arise, make corrections as soon as they crop up. You should adjust any work instructions affected by operation mishaps because this enables you to apply corrections to current and future process operations. Consistent work also involves applying certifications to job instructions, procedures, and visual checks, as well as verifying that the changes you made to eliminate a flaw are in fact improving the process.
Many-Level Reviews
Many-level reviews enable you to appraise the operations process using multiple levels of assessment. These appraisals help to ensure compliance with consistent work procedures.
Reviews need not be overly complicated to be effective. They can simply be individual checks conducted by at least two or three pertinent people, such as the floor leader, the inspector, the supervisor, the department manager, or an outside assessor. Each of the assessors should observe the same condition at different random intervals. This allows for review of the process procedures as well as the effectiveness of the previous reviews.
These types of reviews are important, as they provide different levels of scrutiny. Any identified deficiencies can be corrected immediately. Many-level assessments ensure compliance with procedures because the reviews highlight any deviation from the expected work. Multiple checks provide redundancy and allow for certainty in the assessments.
An example of a preliminary many-level review is shown in Figure 9-1. In this case, some automatic bolt feeders became jammed in the customer automation handling equipment, which created line downtime. We created the checklist to prevent mixed bolts from being shipped to the customers. This checklist is rudimentary, and it can be revised as other problems occur.
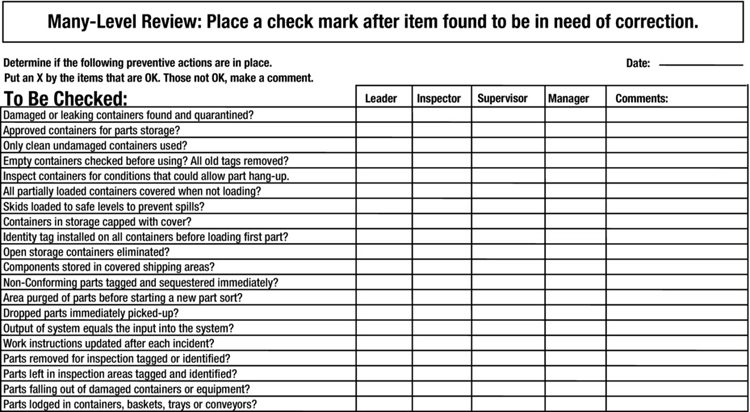
Figure 9-1. Many-Level Review Checklist Example
In this case, the items were checked on a daily basis by at least a floor leader and an inspector. A supervisor or manager checked for these conditions on a weekly or monthly basis. An upper manager assessed compliance on a yearly basis. If anyone found any discrepancies, they were addressed immediately. New, detrimental items were added to a revised many-level review list for future assessments.
This checklist offers a preliminary many-level review that will help prevent mixed parts from being sent to the customers (internal or external). Although a mixed-part problem may seem inconsequential, it can cause jams in customer automation that can result in expensive line downtime. You should customize this checklist for your situation. You can also update it whenever you find another suspect condition. Since each manufacturing location has its own characteristics, that may require additional observations. In addition, any recognized problem can be added to the list and used in other applicable areas of the facility.
You can perform the entire review in a few minutes by simply walking through the area under appraisal and making the observations as listed. Once any other deficient circumstance is noted it should be corrected and added to future reviews. All items found deficient should be subject to immediate corrective actions.
These types of checks can be especially useful in maintaining established controls. They can be used to identify items and aid management in establishing new requirements for future manufacturing and assembly (PFMEA) and control plan requirements. These checks can also be used to ensure compliance with established procedures, services, and items such as:
Protective equipment use
Gauge calibrations
ISO and quality systems requirements
Housekeeping
Label issues
Routing procedures
Labeling
Proper labeling requires consistent work and many-level checks to ensure that labels are applied correctly and to the customer’s or regulatory requirements. Even though labeling does not add a function to the part or assembly operation, it is very important for descriptive value. Any process that affects the labeling operation should be included in the job instructions that specify the consistent work as well as the checks that are being performed on the labeling operation.
How do you come up with labeling-related items for your many-level reviews? Let’s look at an example.
As we’ve seen, correct labeling is very important in the manufacturing setting. This list of eight items can help you create assessment items for the purposes of label control. These items may be generated from problems experienced in the past or from items from a concept sheet.
Labels should be discussed at a quality planning or design meeting before the product is launched.
Label problems and processes should be addressed in the DFMEA, PFMEA, job instructions, and control plan documents.
Procedures must be set up for label storage, application, and control.
Employees should be trained in the correct labeling methods.
Review items should be ascribed from the conditions above. Each item recognized in any of the above activities should be included on the many-level checklist if it can have a detrimental effect on the finished product.
Problems must be corrected to prevent label problems when they are recognized.
Someone must be assigned specific responsibility for each of these steps. Each step does not have to be assigned to one individual. But assignments and the many-level checks should be made by specific individuals to ensure compliance.
The items identified as important should be added to a many-level review sheet for compliance. They should be added, as appropriate, to other lists used in other areas of the facility.
This “list of eight” is in fact a solid blueprint for carrying out any kind of assessment process. You can follow these steps to come up with an effective and timely many-level review checklist regardless of the process—it works with machining processes, first-piece inspections, assembly instructions, damage control issues, reworks, mixed parts, foreign material issues, shipping processes, and communication problems.
Advocates: Assign a Manager
Once you have procedures and controls in place for each process, your organization can quickly attack any defects that arise. Where are problems most likely to come from? As an example, let’s look at the data from a high-volume manufacturing facility. During a specific time period, there were 513 flaws noted. We classified these faults as follows:
1. Assembly |
186 |
||
2. Machining |
127 |
||
3. Communication/shipping |
94 |
||
4. Damaged components |
45 |
||
5. Mixed parts |
22 |
||
6. Foreign material |
20 |
||
7. Label issues |
19 |
||
Total = 513 |
Each of these faults is an opportunity for improvement. To be effective, there should be an advocate—generally a manager—assigned to each major area of responsibility. In addition, there should also be an alternate assigned for when the advocate is absent or unavailable.
Assigning an advocate is not compulsory. However, if everyone is responsible for controlling a problem, you will likely find that no one has accepted that responsibility. Conversely, when advocates with responsibility find discrepancies, they have the authority to apply fault-removing corrections like improving the design or process FMEA, adjusting the control plan and consistent work procedures, and modifying the job instructions and training process. Together, these corrections provide a robust quality-assurance system.
In addition, having an advocate will expedite problem correction because someone is held accountable. Once it’s assigned, the task can be measured and fulfilled.
Certify Problem Solutions and Verify
Now suppose that you have a manufacturing problem, and you have reviewed all the available information and collected the pertinent data. You are about to apply an action that you believe will correct the problem. However, suppose there is a nagging sensation in your mind that’s causing you some trepidation about the recommended solution. In that case, you should talk it over with your supervisor to enlist their aid or buy-in. It’s possible that unless you act, no one will solve the problem.
To prove or verify your trial solution, consider using Figure 9-2, a flaw chart. You can use such a chart to outline any manufacturing operation that has variability. It can be an effective tool in communicating the past, current, and potential effect of a process. Charts of this nature are stalwart certification tools.
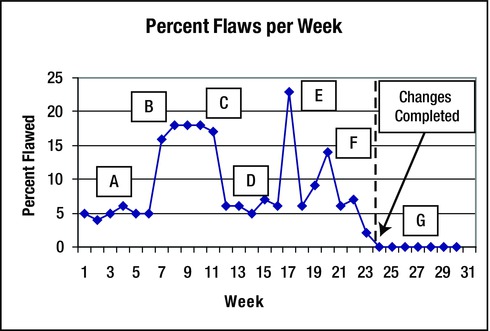
Figure 9-2. Chart Showing the Percentage of Flaws per Week
Initially, the process was limping along with a flaw rate of 5 percent, as indicated by the A in the chart. Around week 8, the defect rate shot up to 18 percent, shown by point B. At this point, management becomes aware of the problem and attempts to fix it, as indicated at point C. While the process is being investigated and nothing substantial has changed, the process returns to a 6 percent flaw level, as indicated by point D. At this point, unfortunately, management thinks the problem has gone away. In most cases, manufacturing will continue to run at this level, with intermittent spikes caused by chance, variability, or unknown interactions, as indicated by points E and F. Until the problem is identified, it will not be solved.
You look more closely and notice that there are erratic flaw surges during the 7th, 17th, and 20th week of the production run.
By this time, you have already performed an analysis that leads you to believe that you know what is causing the problem. Maybe you used a comparison of five duos or compared five good with five bad samples to both discover and verify the problem.
You make a change based on your study and then compare five of the previous samples with five of the new ones. You find that your change has significantly reduced the flaw rate, as shown by point G. This is why it is important to record the changes and their results—you can track and verify their results and then potentially incorporate them elsewhere in the facility.
![]() Note To ensure that a change is satisfactory, some proponents suggest that the old method be tried one more time so that the flaw is recreated as a temporarily trial. I do not advocate this approach, as it makes management very nervous and can be wasteful. Rather, use a chart like the one shown Figure 9-2 to track the effects of any changes.
Note To ensure that a change is satisfactory, some proponents suggest that the old method be tried one more time so that the flaw is recreated as a temporarily trial. I do not advocate this approach, as it makes management very nervous and can be wasteful. Rather, use a chart like the one shown Figure 9-2 to track the effects of any changes.
During the 24th week, the corrective changes were completed. The percentage of flawed product was reduced to zero for the next seven-week period. The adjustments you made thus corrected the erratic surges as well as the recurring low-level flaws.
The graph in Figure 9-2 complements the information provided by the comparison of duos and the comparison of five good versus five bad, which in each case provided over 95% confidence that there was a significant difference in the effects of the characteristics being compared. Afterward, a chart like 9-2 compared the changes to the flaw level in the five bad weeks prior to the change and the five good weeks after the correction. The chart confirms with 95% confidence that the changes improved the process. There is clearly better performance in the five weeks after the change than the five weeks before the change. And there is no data tie or overlap between the two periods.
Case Study: The Value of Comparisons
The following example—in summary form and without the study data—shows how helpful it is to use the duos and the comparison of five good versus five bad to verify whether a process change was successful.
The supplier in this case study creates a certain chemical for its customers. Its process involves using bulk chemicals, mixing vats, processing towers, and a packaging and shipping operation. During the materials processing, the chemicals are mixed and transported through the piping system to the individual towers, where additions and reductions in the process are made. The towers consist of three stages and include temperature control to activate the chemical process.
Now the problem. The process jammed up at random times and had to be shut down for cleaning. This downtime resulted in production loss and in excessive labor costs to clean and restart the system. The downtime also generated losses due to waste of the materials that had been incorrectly created.
Over time, they found that adding bags of lime could sometimes prevent the jams. So they limped along creating what they could, adding the lime whenever the system started to act up. However, they continued to experience erratic downtime and excessive costs.
The supplier collected data on 17 variables over a period of one month. These variables ranged from the day’s production in tons, feeds and speeds of material inputs, air temperature, humidity, bags of lime added per hour, moisture content of the lime, tower temperature in each stage, and final analysis of the product.
The data did not reveal a clear plan for correcting the problem. There were no apparent clues that indicated what was creating the process jams. The problem-solver assigned to solve the output and jam-up problem didn’t use any of the methods described in the previous chapters. Because of this, it appeared that the main data point to be used were the five days with the most production output (the best five). There was a significant difference in the tons of output generated each day. This information was entered into a spreadsheet in descending order. The other variable information that was collected was entered in relevant columns. The table was pretty, but it didn’t reveal any significant findings. Some numbers were very similar and some varied considerably. The spreadsheet offered no real action points.
Then, with a stroke of luck or insight, they decided to list all the variables for the worst five days of production when a jam did not interfere with the operation. (The worst five days that included a significant jam up were not incorporated into the spreadsheet, because that information deteriorated or was not available. Once the process had a jam-up problem, the data was unable to be generated because the process required that it be stopped.)
The chart of the five bad days showed the same variability as the five best days. With the exception of the ranked daily output in tons, the other variables appeared at first to be random.
Only after combining the two sheets and listing the total production output for all ten days in descending order did the a pattern emerge.
The only major relationship present in the data suggested that when the temperature in Tower 2, Zone 2 was kept at a higher temperature, the production tonnage increased.
At first, they did not fully appreciate this clue. The information was brought to the attention of the manufacturing supervisor, who decided to conduct an experiment. There had been no temperature specification for Zone 2 in Tower 2. So randomized production runs were conducted with the temperature in Zone 2 classified as a critical control. Two distinct temperatures were used.
The supplier chose a five-day test period for each of the two types of temperatures. After test randomization, high and low temperature data was collected for the days. The days with the higher temperatures had significantly higher production tonnage output than did the days with the lower temperatures. The sum of extremes count was 5 + 5 = 10, which was significant. In addition, the use of lime was greatly reduced when the higher temperatures were maintained.
Many people were overjoyed, but there were a few in management who worried that this was just a statistical anomaly. To add creditability to the results, the supplier plotted the production output on a daily basis. After using the higher temperatures, production output rose significantly. The chart spoke for itself. Production had increased with the change in temperature.
This case shows that there is another useful way to verify whether a process that you have tried to improved has actually improved. Compare the bad five days before the change was made to the five days of production after the change was made. If the sum of the extremes is equal to 7 or more, you will have 95% confidence that you have made the correct change. This is further explained in Appendix E. It explains how to use the sum of extremes test for testing and verification.
![]() Tip There is only one other little thing that you might want to consider. When you attack a problem, take the time to discuss what is happening with the people in manufacturing who are actively engaged with the daily frustration. I don’t mean the superintendent or the supervisor, I mean the individuals who have to perform the manufacturing operation. These people have insight and special knacks for performing the operation to make their own jobs easier. They have a lot to offer when it comes to solving problems.
Tip There is only one other little thing that you might want to consider. When you attack a problem, take the time to discuss what is happening with the people in manufacturing who are actively engaged with the daily frustration. I don’t mean the superintendent or the supervisor, I mean the individuals who have to perform the manufacturing operation. These people have insight and special knacks for performing the operation to make their own jobs easier. They have a lot to offer when it comes to solving problems.
Summary
Now that we are almost at the end, I confess that I have tried to improve on an old teaching axiom to make the information easy to understand and use. After you become proficient in these practices, please consider using the same approach with your peers that I have attempted to use with you. It is as follows:
I told you that there were simple useful tools that could help.
I provided examples and showed you how they operated.
I explained the examples so you understood what you were seeing.
I instructed you to use the tools that are available to you.
I repeated as many times as I could what you had been told.
I strongly recommend that as you get better at solving problems using the tools presented in this book, you also use this approach to educate and inform your peers. Industrial problem solving can be simplified.
I believe that you now have all the information you need to quickly and easily generate clues by identifying important process characteristics. By using the clues generated by comparing the data that you accumulate, you will be able to identify the suspect variables that are contributing to the problem. In addition, using concept drawings and check sheets will make you better at identifying any conditions that are present. Once you identify the adverse conditions, you can propose solutions. After you enact the corrections and verify that the process is satisfactory, you must verify the corrective action. With each project investigation, you will find these methods easier and easier to apply.
So let’s move on the book summary.