Chapter 10. BI and analytics
In this chapter
Components of the AX 2012 BI solution
Implementing the AX 2012 BI solution
Customizing the AX 2012 BI solution
Displaying analytic content in Role Centers
Introduction
Business intelligence (BI) technology helps users of computer-based applications understand hidden trends and exceptions within data. Nowadays, it’s difficult to find a developer who is unaware of BI, so this chapter assumes that you are familiar with BI concepts.
AX 2012 includes a comprehensive prebuilt BI solution, which is designed to meet many of the BI needs of your users. This means that instead of having to build a BI solution from the ground up, you might be able to use the prebuilt solution and tweak it to meet any remaining requirements. With this proposition in mind, this chapter walks you through the life cycle of the AX 2012 analytic components—from implementation through customization and extension. When necessary, this chapter points you to relevant resources on the Internet.
The AX 2012 BI solution is built on top of the Microsoft BI framework. If your organization uses the Microsoft BI infrastructure, you can use the Microsoft BI tools and technologies to extend the power of the AX 2012 BI solution.
Components of the AX 2012 BI solution
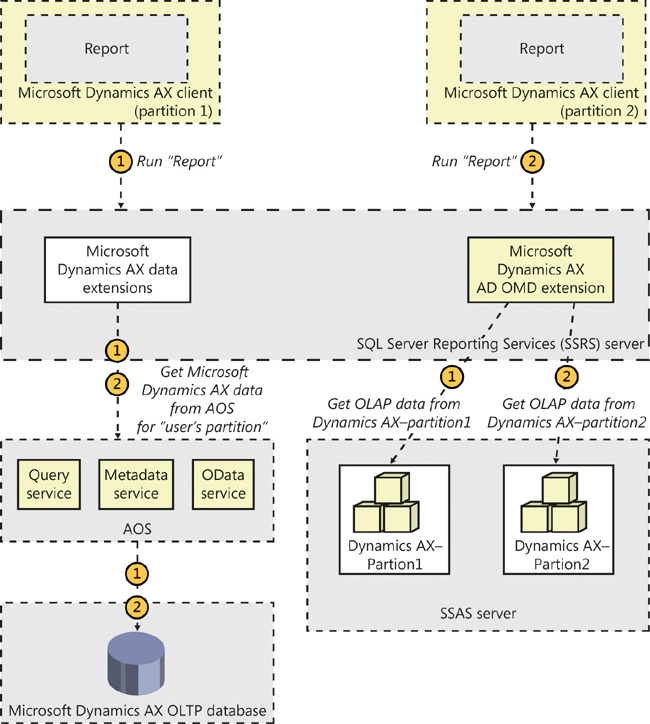
Figure 10-1 shows a simplified architecture diagram of the BI solution that is included with AX 2012. In the figure, the AX 2012 logical architecture has been simplified to highlight only the components that are relevant to the BI solution.
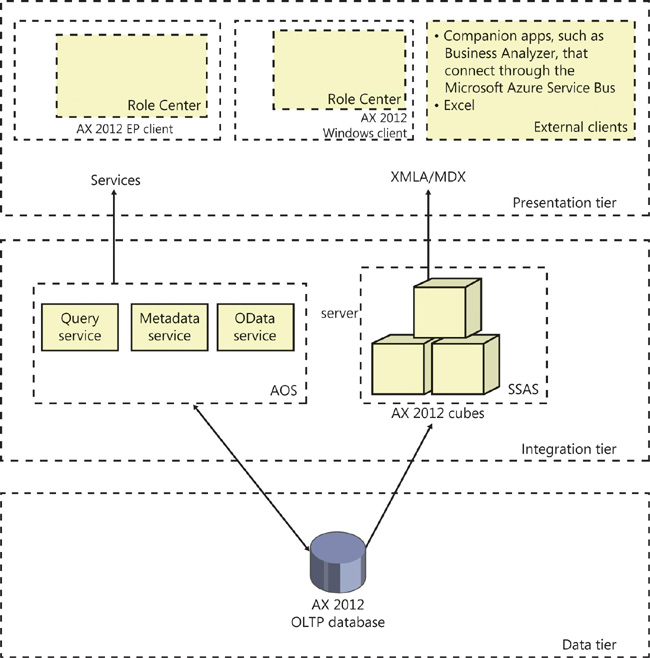
The solution is divided into three tiers:
![]() Data tier Contains sources of data, such as the AX 2012 operational database, often referred to as the online transaction processing (OLTP) database.
Data tier Contains sources of data, such as the AX 2012 operational database, often referred to as the online transaction processing (OLTP) database.
![]() Integration tier Contains the Application Object Server (AOS), programming interfaces, and staged data, such as AX 2012 cubes, that serve as the database for analytical reporting. (This tier is called the middle tier in Chapter 1, “Architectural overview.” It is called the integration tier in this chapter because that is how it is commonly known in BI solutions.)
Integration tier Contains the Application Object Server (AOS), programming interfaces, and staged data, such as AX 2012 cubes, that serve as the database for analytical reporting. (This tier is called the middle tier in Chapter 1, “Architectural overview.” It is called the integration tier in this chapter because that is how it is commonly known in BI solutions.)
![]() Presentation tier Contains tools and user interface elements that users can use to interact with data.
Presentation tier Contains tools and user interface elements that users can use to interact with data.
For details about the three tiers and a more detailed diagram, see Chapter 1.
Implementing the AX 2012 BI solution
Traditionally, BI solutions are implemented during the second or third phase of an enterprise resource planning (ERP) implementation project. During the course of a long implementation, project fatigue can set in (and the budget can get exhausted), and subsequent phases are postponed or delayed. BI implementation is complex and involves the integration of many components. Also, the skill set required to implement a BI solution is distinctly different from the skill set required to implement an ERP system. Often, implementation of the BI solution involves engaging a different partner or consultants. All of these factors contribute to postponing the BI implementation.
AX 2012 simplifies the implementation of a BI solution, so that all AX 2012 partners and customers (regardless of whether they have access to BI specialists) can implement the AX 2012 BI solution when they implement the ERP functionality.
Although the AX 2012 BI solution might not fulfill all of an organization’s business requirements, users can adopt the solution as they become comfortable with AX 2012. To make it as easy as possible for users and IT professionals to tailor the AX 2012 BI solution to meet business requirements, the solution can be configured and extended by using the AX 2012 development environment or the Microsoft BI tools.
In AX 2012, the default Microsoft SQL Server Analysis Services (SSAS) project is a first-class citizen of the Application Object Tree (AOT), as are other SSAS projects that you create in the AOT. This means that SSAS projects derive all of the benefits of being residents of the AOT:
![]() SSAS projects respect the layering concept. This means that an independent software vendor (ISV) or partner can distribute a customized version of an SSAS project that adds additional analytic components to the solution that is included in the SYS layer.
SSAS projects respect the layering concept. This means that an independent software vendor (ISV) or partner can distribute a customized version of an SSAS project that adds additional analytic components to the solution that is included in the SYS layer.
![]() You can import and export SSAS projects to and from different environments as part of a model (by using models or .xpo files).
You can import and export SSAS projects to and from different environments as part of a model (by using models or .xpo files).
![]() SSAS projects respect the version control capabilities offered by AOT-based artifacts.
SSAS projects respect the version control capabilities offered by AOT-based artifacts.
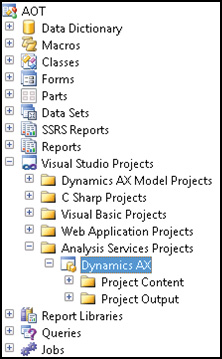
When you deploy a project by using the SQL Server Analysis Services Project Wizard, which was introduced in AX 2012, the wizard selects the project in the highest layer for deployment. If you examine the Visual Studio Projects node in the AOT, you will see the default SSAS project that is included with AX 2012, as shown in Figure 10-2. If you have any customizations at higher levels, they are also displayed.
Implementing the prebuilt BI solution consists of the following steps:
1. Implementing the prerequisites
2. Configuring an SSAS server
3. Deploying the cubes
4. Processing the cubes
5. Provisioning users so that they can access the analytic data
The following sections describe each step in further detail.
Implementing the prerequisites
Before you implement the analytic components in the prebuilt BI solution, the following AX 2012 core components should be in place:
![]() At least one AOS instance must be implemented.
At least one AOS instance must be implemented.
![]() The AX 2012 Windows client must be implemented, and the initialization checklist must be completed.
The AX 2012 Windows client must be implemented, and the initialization checklist must be completed.
![]() The Enterprise Portal web client must be configured.
The Enterprise Portal web client must be configured.
If you are implementing the analytic components on a development or test instance, you might not implement a scale-out architecture. However, if you are implementing these components in a production system, you might want to implement a redundancy or load-balancing infrastructure. You need to configure the clustering or Network Load Balancing (NLB) solution before you implement the analytic components.
Configuring an SSAS server
In this step, you configure your SSAS server for the AX 2012 analytic components. To do so, run the Configure Analysis Extensions step in the Microsoft Dynamics AX Setup Wizard on the SSAS server that will host the AX 2012 cubes.
Running the configuration step should take you a few minutes. This function does the following:
![]() Ensures that the SSAS server has all of the necessary prerequisites to host the cubes.
Ensures that the SSAS server has all of the necessary prerequisites to host the cubes.
![]() Adds the Business Connector (BC) proxy user as an administrator of the SSAS server. This step is required to enable AXADOMD data extensions to operate without the use of Kerberos constrained delegation.
Adds the Business Connector (BC) proxy user as an administrator of the SSAS server. This step is required to enable AXADOMD data extensions to operate without the use of Kerberos constrained delegation.
![]() Allows you to add a read-only user account to the AX 2012 database for processing cubes. (Specify a domain account whose password does not expire.)
Allows you to add a read-only user account to the AX 2012 database for processing cubes. (Specify a domain account whose password does not expire.)
Deploying cubes
When you deploy cubes, AX 2012 generates and processes an online analytical processing (OLAP) database by using the metadata definition in the SSAS project that is included with AX 2012. The result is an OLAP database that contains AX 2012 cubes that are referenced by analytic reports and Role Centers.
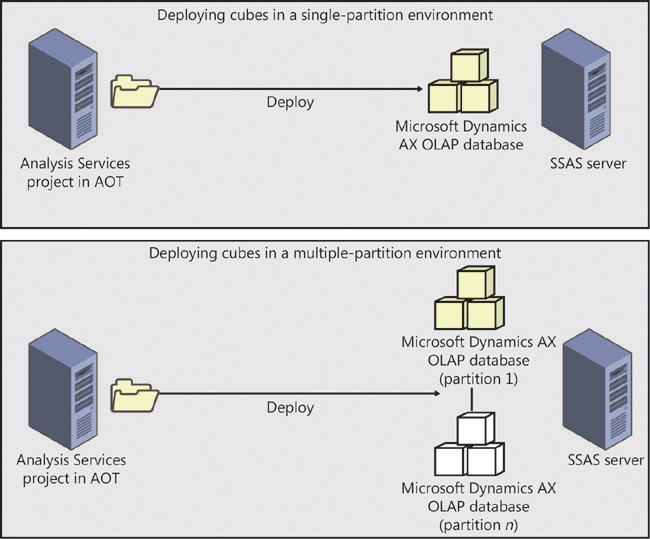
In an AX 2012 R2 or AX 2012 R3 environment where there is only a single partition, the deployment step generates a single OLAP database that sources data from the AX 2012 OLTP database. In a multi-partition environment, the deployment step generates multiple OLAP databases that correspond to each partition. Figure 10-3 shows the deployment process both in a single-partition and multi-partition environment. For more information about partitions, see Chapter 17, “The database layer.”
You use the SQL Server Analysis Services Project Wizard in the AX 2012 client to deploy, process, and in some instances, update cubes. To deploy the cubes, you must have the right to deploy projects to the SSAS server. If you are also processing the cubes, you must have the right to read the AX 2012 OLTP database.
To start the SQL Server Analysis Services Project Wizard and deploy cubes, do the following:
1. In the Development Workspace, on the Tools menu, click Business Intelligence (BI) Tools > SQL Server Analysis Services Project Wizard.
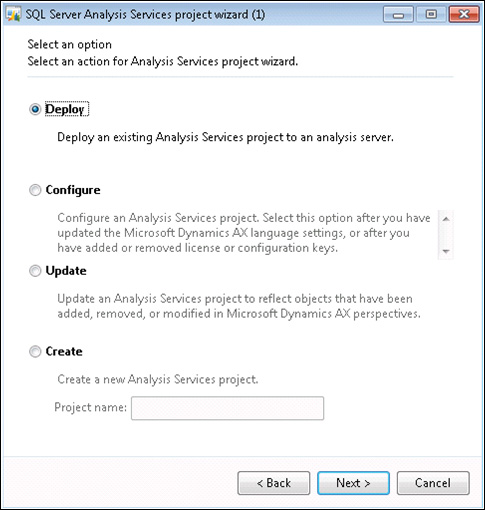
2. On the Welcome page, click Next, and then select the Deploy option on the next page, as shown in Figure 10-4.
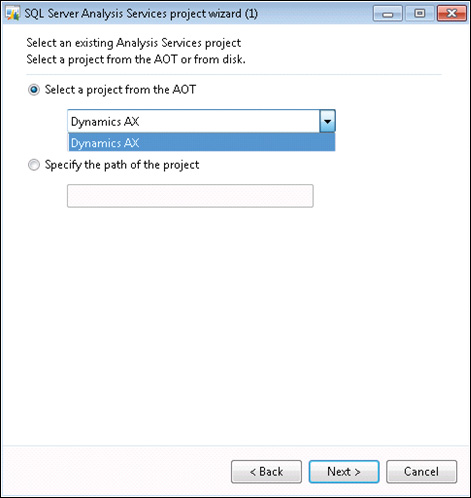
3. On the next page, you select an SSAS project to deploy—in this case, the Dynamics AX project. You can select a project in the AOT, as shown in Figure 10-5, or you can select a project that is saved on a disk.
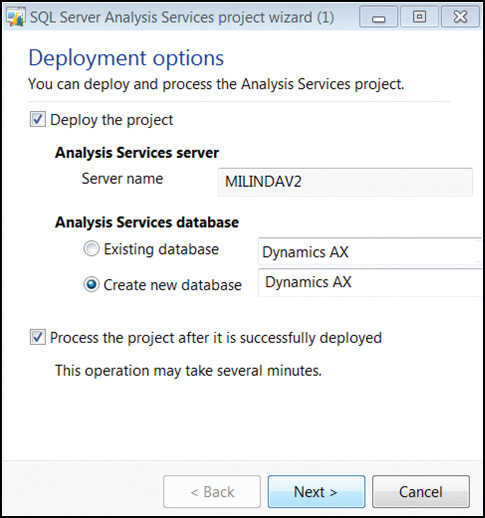
4. Next, you specify the SSAS server to deploy the project to, the SSAS database you want to use, and whether you want the project to be processed after deployment (see Figure 10-6). By default, the wizard uses the SSAS server that you configured earlier, but you can select any server to deploy the project to.
![]() Note
Note
In AX 2012, you can use any name for the OLAP database. In AX 2009, you couldn’t change the default name of the database, and this prevented a system administrator from using the same SSAS server to host multiple OLAP databases. However, if you do change the default name of the OLAP database, you need to configure the report server so that it reports source data from the corresponding OLAP database. For information about how to configure the OLAP database referenced by SQL Server Reporting Services (SSRS) reports, see “Configure Analysis Services by running Setup” at http://msdn.microsoft.com/en-us/library/gg751377.aspx.
Deploying cubes in an environment with multiple partitions
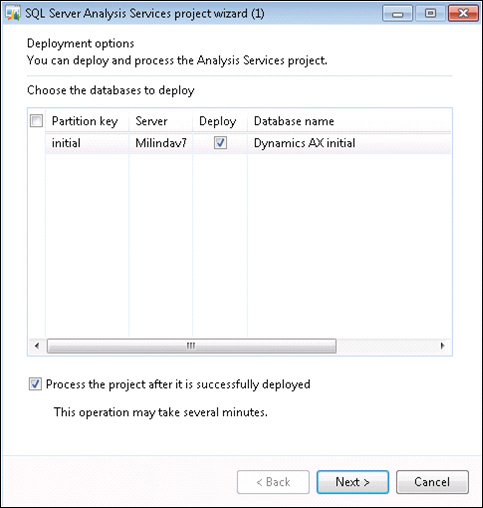
As mentioned earlier, in an AX 2012 R2 or AX 2012 R3 environment with multiple partitions, the SQL Server Analysis Services Project Wizard generates an OLAP database for each partition. You can use the wizard to select the partitions for which OLAP databases are created, as shown in Figure 10-7.
In this case, the SQL Server Analysis Services Project Wizard deploys the SSAS project to multiple OLAP databases. In each database, <partitionkey> is added as a suffix to the name of the OLAP database.
Also, within each OLAP database, the data source view (DSV) is modified so that a partition filter is applied to all queries. Figure 10-8 shows the architecture of an environment with multiple partitions.
In all cases, the SSAS project in the AOT is partition-unaware, whereas the OLAP databases that are deployed are partition-specific. The SQL Server Analysis Services Project Wizard handles the step of making sure that each OLAP database is wired to read data only from the corresponding partition in AX 2012 R2 or AX 2012 R3. This is a departure from the behavior of AX 2012. You need to be aware of the following implications:
![]() If you deploy AX 2012 R2 or AX 2012 R3 SSAS projects by using SSAS tools, such as the Deployment Wizard or SQL Server Data Tools (SSDT, formerly known as Business Intelligence Development Studio), the resulting OLAP database is not partition-aware. In other words, cubes will aggregate data across partitions.
If you deploy AX 2012 R2 or AX 2012 R3 SSAS projects by using SSAS tools, such as the Deployment Wizard or SQL Server Data Tools (SSDT, formerly known as Business Intelligence Development Studio), the resulting OLAP database is not partition-aware. In other words, cubes will aggregate data across partitions.
![]() If you want to extend an SSAS project by using SSDT in AX 2012 R2 or AX 2012 R3, always check out and modify the project in the AOT. You can import the extended project back into the AOT and use the SQL Server Analysis Services Project Wizard to deploy the project.
If you want to extend an SSAS project by using SSDT in AX 2012 R2 or AX 2012 R3, always check out and modify the project in the AOT. You can import the extended project back into the AOT and use the SQL Server Analysis Services Project Wizard to deploy the project.
![]() If you extended a project associated with a specific partition by importing an OLAP database directly in SSDT, you can import the customized project into the AOT in AX 2012 R2 cumulative update 7 or AX 2012 R3. While deploying the customized, partition-specific project, the SQL Server Analysis Services Project Wizard reapplies the partition logic so that the data is filtered by appropriate partition filters.
If you extended a project associated with a specific partition by importing an OLAP database directly in SSDT, you can import the customized project into the AOT in AX 2012 R2 cumulative update 7 or AX 2012 R3. While deploying the customized, partition-specific project, the SQL Server Analysis Services Project Wizard reapplies the partition logic so that the data is filtered by appropriate partition filters.
![]() If you add custom query definitions in the DSV, the wizard adds where clauses to each select statement that restrict rows from other partitions.
If you add custom query definitions in the DSV, the wizard adds where clauses to each select statement that restrict rows from other partitions.
Processing cubes
The SQL Server Analysis Services Project Wizard lets you process deployed cubes directly. However, before processing, the wizard also runs through several prerequisite checks to ensure that cube processing will not fail later. If you are using demo data, you can ignore these preprocessing warnings and have the wizard process the cubes.
While the project is being processed, the wizard displays a progress page. When processing is complete, click Next, and the wizard will show the completion screen.
Provisioning users
After you deploy and process the AX 2012 cubes, you must grant users permissions to access them. Provisioning users involves two steps:
1. Associate an appropriate user profile with each AX 2012 user.
2. Give the users access to the OLAP database.
Associating a user with a profile
The concept of a user profile was introduced in AX 2009. A user profile determines which Role Center is displayed when a user starts the Microsoft Dynamics AX client. A user can be associated with only one profile.
If you do not associate a profile with a user, the default Role Center is displayed when the user displays the Home area page in the client. To associate a profile with a user, click System Administration > Common > Users > User Profiles (see Figure 10-9). You can associate either a single user or multiple users with a profile by using this form.
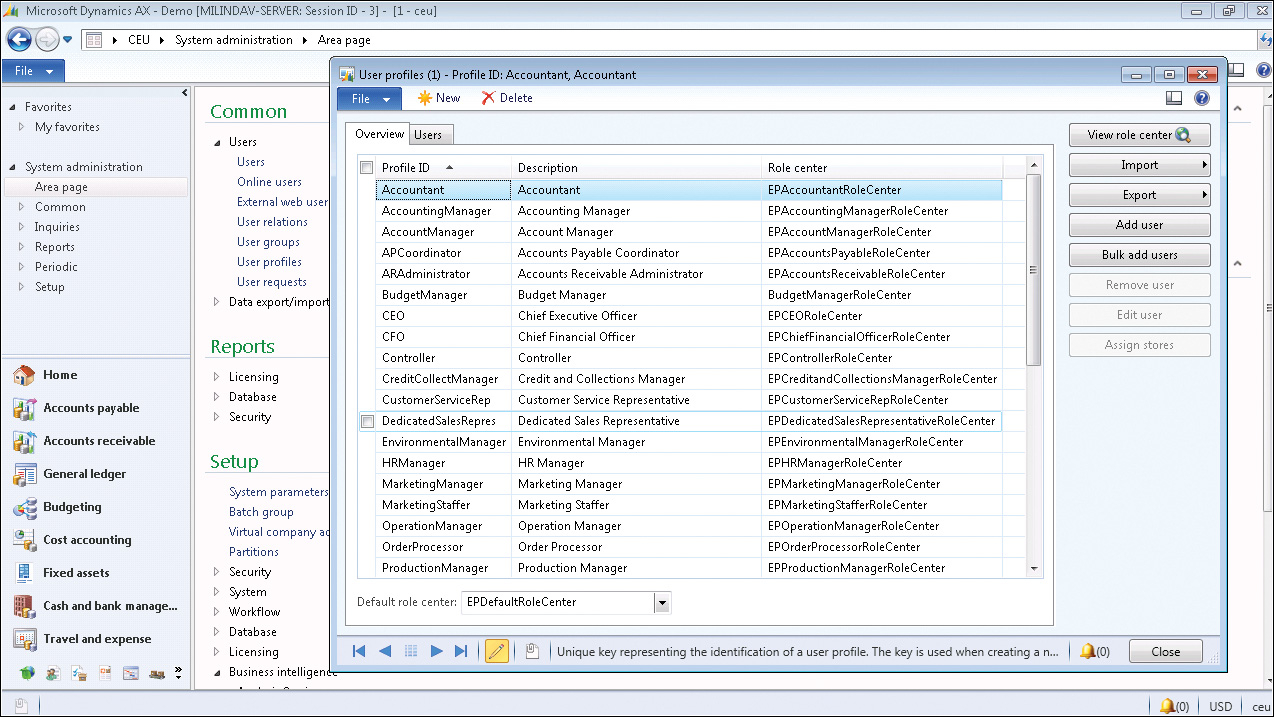
You can also associate a user with a profile in the Users form (System Administration > Common > Users > Users). Changes to a user profile take effect the next time the user starts the client.
Providing access to the OLAP database
Unless you provide your users with access to the OLAP database, they cannot open reports and display key performance indicators (KPIs) drawn from cubes in their respective Role Centers. Security permissions defined in AX 2012 are not automatically applied to OLAP databases. You must grant access to OLAP databases manually by using SQL Server management tools, such as SQL Server Management Studio. For step-by-step instructions, see “Grant users access to cubes” at http://msdn.microsoft.com/en-us/library/aa570082.aspx.
Customizing the AX 2012 BI solution
As you have seen in the previous sections, it’s relatively easy to implement the AX 2012 BI solution. But you must think of the prebuilt content as a starting point in devising your own BI solution. There are several ways to change the functionality of the solution to suit your needs.
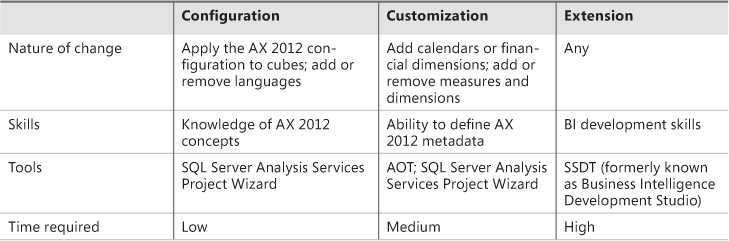
These changes can be divided into three broad categories:
![]() Configuration The solution assumes that you have implemented all of the functionality in AX 2012, and the content of the solution is designed to cover most of that functionality. However, you might have implemented only certain modules. Even within those modules, you might have chosen to disable certain functionality. In AX 2012, license codes and configuration keys govern the availability of modules and functionality, respectively. Configuration keys correspond to functionality within modules. They can be enabled or disabled. (For more information, see Chapter 11, “Security, licensing, and configuration.”)
Configuration The solution assumes that you have implemented all of the functionality in AX 2012, and the content of the solution is designed to cover most of that functionality. However, you might have implemented only certain modules. Even within those modules, you might have chosen to disable certain functionality. In AX 2012, license codes and configuration keys govern the availability of modules and functionality, respectively. Configuration keys correspond to functionality within modules. They can be enabled or disabled. (For more information, see Chapter 11, “Security, licensing, and configuration.”)
If you do not activate certain license codes or if you disable certain configuration keys, the AX 2012 user interface configures itself by removing content that is associated with those elements. In this case, you might need to remove the corresponding analytic content. (However, because the BI solution draws data from across AX 2012, this content will not contain data in any case.) You can use the SQL Server Analysis Services Project Wizard to remove the corresponding content from the prebuilt cubes, so that you do not have to remove the irrelevant content manually yourself.
![]() Customization You might want to add calendars and financial dimensions, in addition to new attributes and measures, to the prebuilt cubes. The SQL Server Analysis Services Project Wizard lets you perform the most frequent customizations with a step-by-step approach, without requiring BI development skills.
Customization You might want to add calendars and financial dimensions, in addition to new attributes and measures, to the prebuilt cubes. The SQL Server Analysis Services Project Wizard lets you perform the most frequent customizations with a step-by-step approach, without requiring BI development skills.
![]() Extension At some point, you might want to develop extensions to prebuilt cubes by using the SQL Server BI development tools.
Extension At some point, you might want to develop extensions to prebuilt cubes by using the SQL Server BI development tools.
Table 10-1 lists categories of customizations, summarizes the types of changes that you can make, and lists the skill level, time, and tools required to make those types of changes.
The following sections describe the processes for customizing the AX 2012 BI solution.
Configuring analytic content
As previously explained, you can configure the predefined analytic content to reflect configuration changes in AX 2012 in a matter of minutes by using the SQL Server Analysis Services Project Wizard. In AX 2009, this process had to be performed manually, and it required BI development skills and a day or two of spare time. AX 2012 dramatically simplifies this process by introducing the following three improvements:
![]() Static schema Historically, Microsoft Dynamics AX has had a schema whose shape changed depending on licenses and configuration keys. That is, when a configuration key was turned off, the database synchronization process dropped tables and data that were deemed invalid. This caused prebuilt cubes (that rely on a static schema in the underlying database) to break at processing time. Unlike its predecessor, AX 2012 has a static schema. So when configuration keys are disabled, the database schema no longer changes. This means that prebuilt cubes can continue to be processed without generating errors. (They will, for example, contain empty measures, because the corresponding tables have no data.)
Static schema Historically, Microsoft Dynamics AX has had a schema whose shape changed depending on licenses and configuration keys. That is, when a configuration key was turned off, the database synchronization process dropped tables and data that were deemed invalid. This caused prebuilt cubes (that rely on a static schema in the underlying database) to break at processing time. Unlike its predecessor, AX 2012 has a static schema. So when configuration keys are disabled, the database schema no longer changes. This means that prebuilt cubes can continue to be processed without generating errors. (They will, for example, contain empty measures, because the corresponding tables have no data.)
![]() Improved modeling capabilities in the AOT The AX 2009 OLAP framework did not allow advanced modeling of constructs in the AOT. As a result, developers had to implement any functionality that was lacking directly in an SSAS project. In AX 2012, a larger portion of analytic content is modeled in the AOT. Therefore, configuring the content can be done much more easily by the framework.
Improved modeling capabilities in the AOT The AX 2009 OLAP framework did not allow advanced modeling of constructs in the AOT. As a result, developers had to implement any functionality that was lacking directly in an SSAS project. In AX 2012, a larger portion of analytic content is modeled in the AOT. Therefore, configuring the content can be done much more easily by the framework.
![]() Wizard-driven user interface The six different forms that were necessary in AX 2009 have been replaced by a single step-by-step wizard that guides you through various activities.
Wizard-driven user interface The six different forms that were necessary in AX 2009 have been replaced by a single step-by-step wizard that guides you through various activities.
To configure the prebuilt BI project, you must have developer privileges in AX 2012. This step modifies the project so that irrelevant measures, dimensions, and entire cubes are removed after the process is completed. The modified project will be saved in the AOT in your own layer.
To configure the project, start the SQL Server Analysis Services Project Wizard, and then select the Configure option. You then need to select the project to configure. Select the Dynamics AX project to configure the prebuilt project, and step through the wizard. For step-by-step instructions, see the “Configure an Existing SQL Server Analysis Services Project” at http://msdn.microsoft.com/en-us/library/gg724140.aspx.
If you also deploy and process the project, you should notice the following changes:
![]() Cube content (such as measures and dimension attributes that source data from tables that are affected by disabled configuration keys) is deleted from the project. You might see that entire cubes have been removed, if the corresponding content has become invalid.
Cube content (such as measures and dimension attributes that source data from tables that are affected by disabled configuration keys) is deleted from the project. You might see that entire cubes have been removed, if the corresponding content has become invalid.
![]() KPIs and calculated measures have been removed in cubes that depend on disabled measures and dimension attributes.
KPIs and calculated measures have been removed in cubes that depend on disabled measures and dimension attributes.
![]() OLAP reports in Role Centers that source data from cubes that have been removed no longer appear on the Role Center page. If a user intentionally adds such a report to the Role Center, the report displays a warning message and will execute.
OLAP reports in Role Centers that source data from cubes that have been removed no longer appear on the Role Center page. If a user intentionally adds such a report to the Role Center, the report displays a warning message and will execute.
![]() KPIs and measures that were removed no longer appear in the Business Overview web part.
KPIs and measures that were removed no longer appear in the Business Overview web part.
Customizing cubes
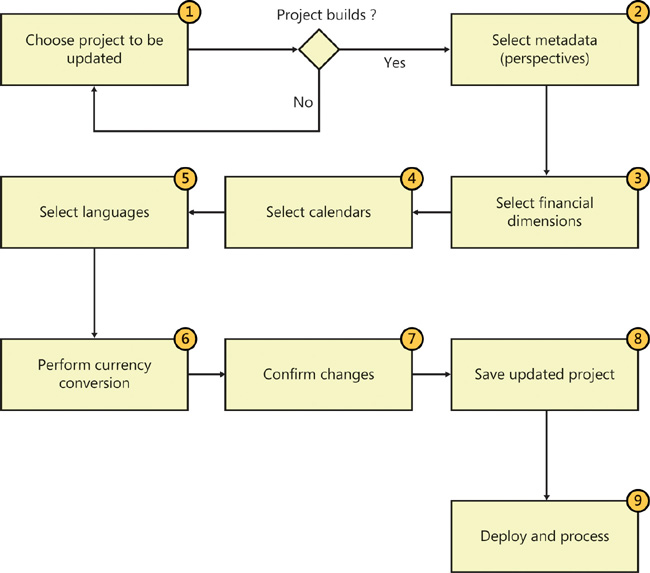
When you start the SQL Server Analysis Services Project Wizard, the third option after Deploy and Configure is Update. This option lets you customize the project.
Figure 10-10 shows the process for updating a cube. The following sections walk through each step in detail.
Choosing the project to update
The first step is selecting the project to modify. You can select an SSAS project in the AOT or a project maintained on disk. The wizard performs basic validation of the selected project before you can proceed. The update process is designed to ensure that you end up with a project that you can deploy and process without any errors. If the selected project does not build (the most basic measure of validity), the wizard will not let you proceed to the next step.
Selecting metadata
Next, you select the AX 2012 metadata that you want to include, as shown in Figure 10-11. The metadata that is defined in the Perspectives node in the AOT is the source of metadata for the prebuilt BI solution. By including or excluding metadata definitions, you can include (or exclude) measures, dimensions, and even cubes.
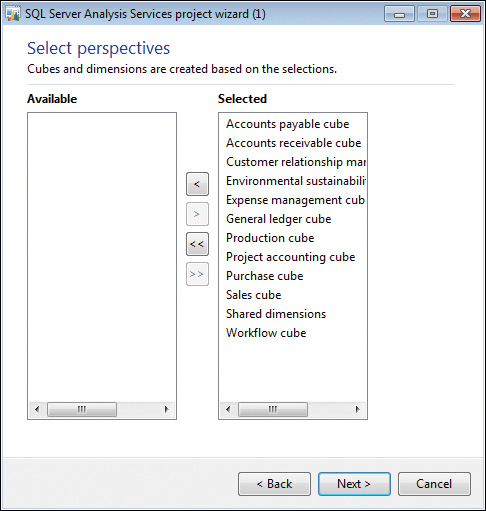
For example, if you remove the Accounts Receivable perspective from the selection, the Accounts Receivable cube will be removed from the project that you are updating. If you model a new perspective in the AOT and include it in the project, the corresponding measures and dimensions will be created and added to the SSAS project.
For a description of metadata definitions and the resulting analytic artifacts, see “Defining Cubes in Microsoft Dynamics AX” at http://msdn.microsoft.com/en-us/library/cc615265.aspx. Metadata is also covered in further detail later in this chapter, in the “Creating cubes” section.
Selecting financial dimensions
On the next wizard page, you are prompted to select the AX 2012 financial dimensions to include in the project, as shown in Figure 10-12.
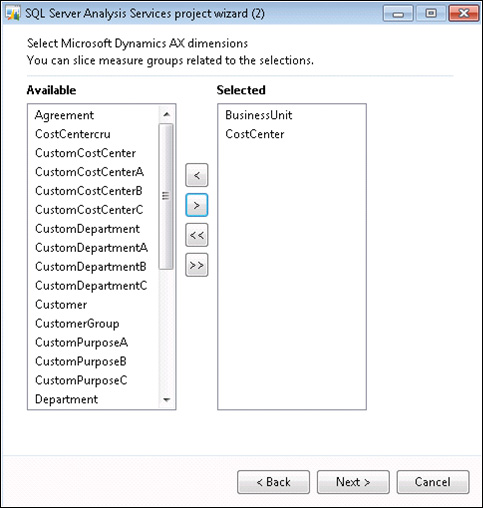
Each financial dimension that you select is added as an OLAP dimension with the same name. If a dimension by that name already exists within the SSAS project, the system will disambiguate the new dimension by adding a suffix.
Notice that the SQL Server Analysis Services Project Wizard provides friendly labels associated with financial dimensions even if you did not provide AX 2012 labels when adding the financial dimensions. To determine the appropriate labels, in AX 2012 R2 cumulative update 7 and later, if the financial dimension is derived by using a backing entity, the label associated with the backing entity is used as the friendly label.
Selecting calendars
Next, the wizard prompts you to select the calendars to include as date dimensions, as shown in Figure 10-13. If you have defined additional calendars, you can include them in the project at this point.
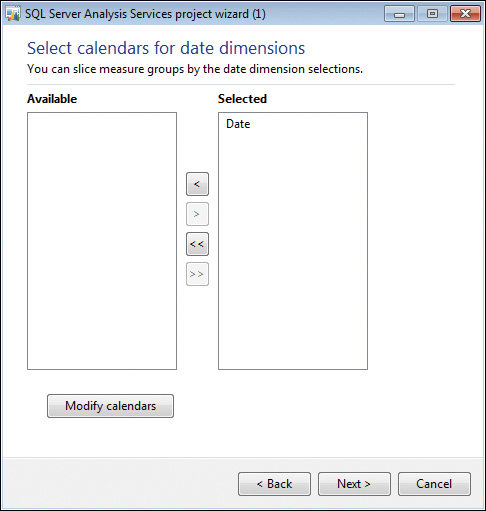
In AX 2009, the prebuilt analysis project included two date dimensions: a Gregorian calendar–based dimension called DATE and a fiscal calendar–based dimension called FISCALPERIODDATEDIMENSION. If you wanted to include additional date dimensions, you would have had to customize the prebuilt project by using SSDT.
AX 2012 includes a form called Date Dimensions that lets you define custom calendars for analysis purposes. A default calendar, Date, is included with the product, and you can define additional calendars by using the Date Dimensions form.
For each calendar that you add in this form, the system creates a date dimension in the SSAS project. For example, if you add a new calendar called Sales Calendar, the system will add a date dimension called Sales Calendar. In addition, the system will create role-playing date dimensions that correspond to each of the dates that are present in cubes. You can’t remove the prebuilt date dimension from the project.
You can start Date Dimensions directly from the SQL Server Analysis Services Project Wizard or from the System Administration area page.
You can define a calendar by selecting the beginning of the year and the first day of the week. For example, for the Sales calendar, the year starts on April 1 and ends on March 31, and the week starts on Sunday. You can enter a date range to specify the calendar records that you want the system to populate in advance. You can also select the hierarchies that will be created for each calendar.
When you close the form, if you added or modified calendars, the system will populate dates according to the new parameters that you defined. In addition, the system will add the required translations. As you will notice later, the system adds a rich set of attributes for each calendar defined here. You can use any of these attributes to slice the data contained in cubes.
In addition, Date Dimensions adds a NULL date record (1/1/1900) and a DATEMAX date record (31/12/2154) to each calendar, so that fact records that contain a NULL date or the DATEMAX date will be linked to these extra records, preventing an “unknown member” error from occurring during cube processing.
Selecting languages
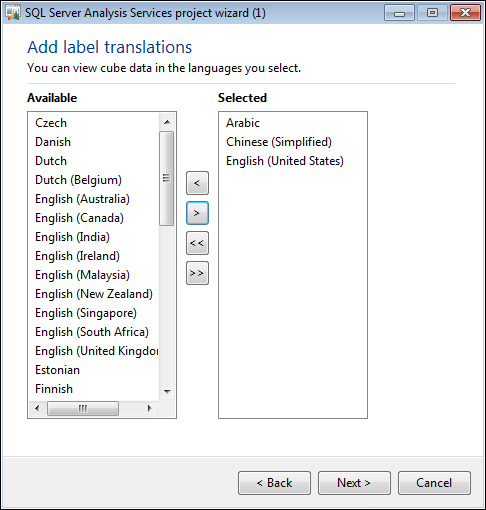
The prebuilt SSAS project uses EN-US as the default language. However, you might have sites in other countries/regions and want the users there to be able to view measure and dimension names in their own languages.
The project can include additional languages through a feature in SSAS called Translations. With the Translations feature, you can translate dimensions, measures, many other kinds of metadata, and data to other languages by adding companion text in other languages.
For example, if you add German translations to the project, when a German user views data in a cube by using, for example, Microsoft Excel, data labels are displayed in German.
The prebuilt SSAS project does not include translated strings. However, translated labels are already available in the system. The SQL Server Analysis Services Project Wizard lets you add any languages you need to the project by using existing translations from within AX 2012, as shown in Figure 10-14.
It is recommended that you add only the translations that you need. Each translation adds strings to your project, and the size of the project increases by a few megabytes each time you add a language. In addition, processing gets a bit slower and the size of the backup increases.
In the Standard edition of SQL Server 2005 or SQL Server 2008, you could not add additional translations (for AX 2009). You had to buy the Enterprise edition of SQL Server in order to add translations to cubes. This restriction has been removed beginning with SQL Server 2008 R2.
Labels associated with AX 2012 tables and views are carried through to the corresponding dimensions and measures. It is also possible to add specific labels to dimensions and measures by defining the labels in perspectives. For more information, see the “Defining perspectives” section later in this chapter.
In the AX 2012 and AX 2012 Feature Pack releases, if you manually add translations to the project by using SSDT, the wizard overwrites the labels every time you run the Update option, by sourcing labels from AX 2012. Beginning with AX 2012 R2 cumulative update 7, the Update option preserves labels that you manually added by using SSDT.
If you have AX 2012 or AX 2012 Feature Pack, to add your own translations, either define a new label and associate it with the object or change the translation in AX 2012 by using the Microsoft Dynamics AX Label Editor.
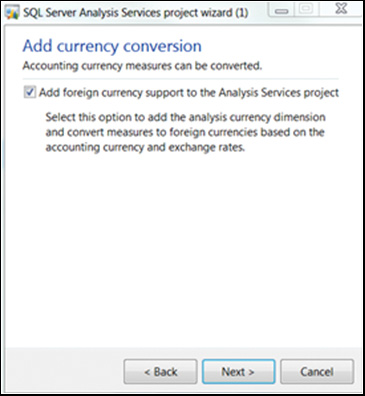
Adding support for currency conversion
The prebuilt SSAS project contains the logic to convert measures that are based on the AX 2012 extended data type (EDT) AmountMST to other AX 2012 currencies. For example, if the amount was recorded in USD, you can display the value of the amount in GBP or EUR by using the analysis currency dimension to slice the amount.
If you want to, you can exclude currency conversions by clearing the check box on the wizard page shown in Figure 10-15.
![]() Note
Note
Removing support for currency conversion not only removes this feature but might also cause prebuilt reports to fail, because they rely on the currency conversion option to be displayed in Role Centers.
For more information about currency conversion, see the “Adding currency conversion logic” section in the “Creating cubes” section.
Confirming your changes
When you click Next on the Add Currency Conversion page, the wizard goes to work, performing the following tasks:
![]() Generating a new project based on the perspectives and other options that you have chosen
Generating a new project based on the perspectives and other options that you have chosen
![]() Comparing the newly generated project with the project you wanted to update
Comparing the newly generated project with the project you wanted to update
![]() Displaying the differences between the new project (that is, the changes you want to apply) and the old project, as shown in Figure 10-16
Displaying the differences between the new project (that is, the changes you want to apply) and the old project, as shown in Figure 10-16
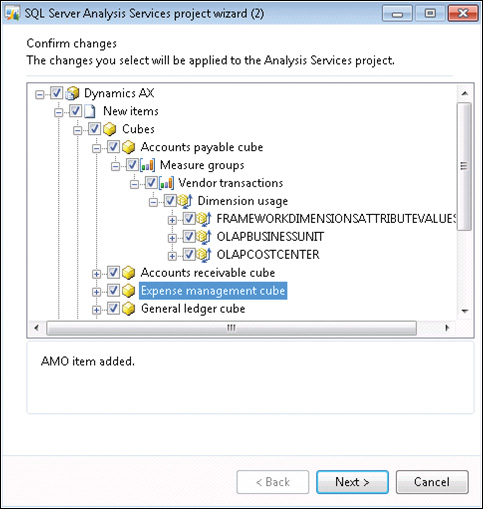
In the wizard, it is assumed that you want to confirm all changes; therefore, all changes are selected by default. If you want the wizard to apply all changes, click Next, and then the wizard will create a project that includes the changes that you selected.
However, if you are an experienced BI developer and want more granular control of the Update option, you can examine the updates in detail and accept or reject the changes.
Be aware, however, that making changes to the wizard at a granular level might result in inconsistencies within the analysis project. If such inconsistencies result in a project that does not build, the wizard displays a message to inform you.
Here are some examples of when you might want to evaluate changes individually:
![]() You might have removed some perspectives from the generation process (for example, you have not implemented Project Accounting functionality in AX 2012 and are therefore not interested in the Project Accounting cube). Ordinarily, the system would remove the resulting analytic artifacts, including a dimension. However, you might want to use that dimension in analysis, even if the Project Accounting cube is not used. Therefore, you reject the deletion of that dimension.
You might have removed some perspectives from the generation process (for example, you have not implemented Project Accounting functionality in AX 2012 and are therefore not interested in the Project Accounting cube). Ordinarily, the system would remove the resulting analytic artifacts, including a dimension. However, you might want to use that dimension in analysis, even if the Project Accounting cube is not used. Therefore, you reject the deletion of that dimension.
![]() You have added extra attributes to the customer dimension by using SSDT. The system would ordinarily delete these extra attributes, because they are not associated with AX 2012 metadata. However, you might want to reject the deletion and keep these extra attributes intact.
You have added extra attributes to the customer dimension by using SSDT. The system would ordinarily delete these extra attributes, because they are not associated with AX 2012 metadata. However, you might want to reject the deletion and keep these extra attributes intact.
If you make too many customizations directly within SSDT, the wizard detects a large number of changes. You must then review each change and approve or reject it. At some point, running the wizard to update the project might cause too much overhead. Therefore, if you are an experienced BI developer and you have customized the prebuilt AX 2012 project extensively within SSDT, don’t use the Update function again. Instead, maintain your project in SSDT.
Saving the updated project
Next, the wizard applies the changes you specified in the previous step. If you simply clicked Next (that is, you did not make any changes to the options selected by the wizard), the wizard would save the resulting project.
If you made changes and the wizard encountered inconsistencies (that is, the project is in an error state and does not build), it displays a warning asking whether you want to save the project or go back to the confirmation step and reconsider the changes.
If you choose to save the project in an inconsistent state (if you are an experienced BI developer, you might choose this approach), you must fix the project by using SSDT; otherwise, subsequent deployment steps will be unsuccessful.
Deploying and processing cubes
Next, you can deploy the cubes to an SSAS server and, optionally, process the cubes. As discussed in the “Deploying cubes” section earlier in this chapter, in a multiple-partition environment in AX 2012 R2 and later, the system will deploy the project to multiple SSAS databases.
Extending cubes
As discussed earlier in this chapter, you can customize the prebuilt analysis project relatively easily by using the SQL Server Analysis Services Project Wizard. But in some cases, you might want to make deeper customizations. For example, you might want to:
![]() Create a rich hierarchy, such as a parent/child hierarchy to model organizational units.
Create a rich hierarchy, such as a parent/child hierarchy to model organizational units.
![]() Add new KPIs.
Add new KPIs.
![]() Bring external data into the analysis project and create a custom dimension.
Bring external data into the analysis project and create a custom dimension.
You can use SSDT to make these types of changes.
Because the prebuilt BI components are included in the AOT as an SSAS project, you can modify the project. To modify the prebuilt SSAS project, do the following:
1. In the AOT, expand the Visual StudioAnalysis Services Projects node.
2. Right-click the project that you want to modify, and then click Edit.
An Infolog message appears, stating that a copy of the SSAS project has been created and saved, as shown in Figure 10-17.

If SSDT is installed, it will start and open the copy of the project. Changes that you make to the project are not automatically saved to the AOT. You need to save the project and import it back into the AOT. This approach is discussed in the following section.
Figure 10-18 shows the prebuilt SSAS project in SSDT.
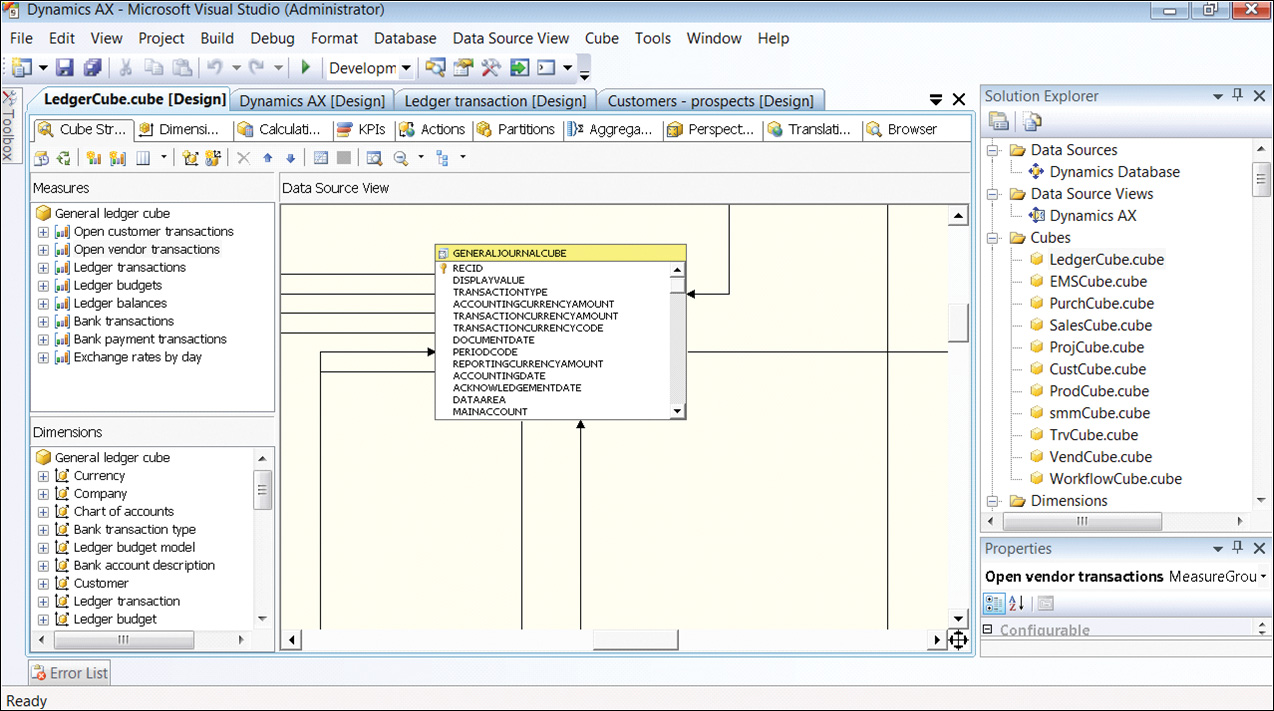
The following sections describe the components of the project.
Data source view
The data source view (DSV) contains the table and view definitions that are used by analytic artifacts. Notice that the OLAP framework has implemented several query definition patterns in the DSV:
![]() Financial dimensions that the wizard has added appear as custom query definitions in the DSV.
Financial dimensions that the wizard has added appear as custom query definitions in the DSV.
![]() The OLAP framework has created query definitions corresponding to AX 2012 views.
The OLAP framework has created query definitions corresponding to AX 2012 views.
![]() The OLAP framework has added a reference relationship to resolve virtual companies, if your AX installation has virtual company definitions.
The OLAP framework has added a reference relationship to resolve virtual companies, if your AX installation has virtual company definitions.
![]() The OLAP framework has created views that make AX 2012 enumerations accessible in all of the languages that have been added to the project.
The OLAP framework has created views that make AX 2012 enumerations accessible in all of the languages that have been added to the project.
Avoid modifying any of the framework-generated objects in the DSV. Any changes that you make to these objects are overwritten without warning the next time you update the project. You can add your own objects to the DSV (for example, new query definitions). The Project Update option preserves these objects.
In AX 2012 R2 and AX 2012 R3, the SQL Server Analysis Services Project Wizard appends partition-specific filters when the project is deployed. If you implement partition-specific logic in any of the query definitions, when the project is deployed to multiple partitions, the system might generate processing errors at deployment time.
Data source
A data source has been created that points to the AX 2012 OLTP database.
Dimensions, measures, and measure groups
In Figure 10-18, shown earlier, notice the dimensions that are included with the AX 2012 BI solution, in addition to the measures and measure groups. For a list of measures and dimensions, see “Cube and KPI reference for Microsoft Dynamics AX” at http://msdn.microsoft.com/en-us/library/hh781074.aspx.
KPIs and calculations
The SSAS project contains prebuilt KPIs and calculations. AX 2012 does not provide the capability to model KPIs and calculations in the AOT. You can modify these definitions or add new ones directly in SSDT.
Integrating AX 2012 analytic components with external data sources
As discussed in previous sections, the AX 2012 BI solution is an extensible option for providing insights to users. One of the most common reasons for extending the solution is to bring in external data so that a user can derive insights not only from AX 2012 data but also from other data sources within the organization. This scenario is called external data integration.
Until recently, data warehouses and data marts were the only reasonable solution for providing insights to users across multiple data sources. However, as applications become more easily interoperable and as technologies such as in-memory databases and visualizations become more cost-effective and simpler to use, building a data warehouse is just one of the options.
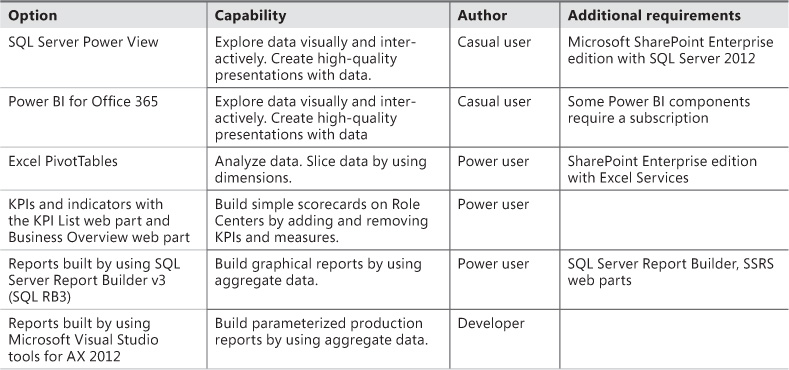
Table 10-2 presents several architecture options for integrating external data with the AX 2012 BI solution. The columns represent architecture options, whereas the rows represent the benefits and cost implications of each option.
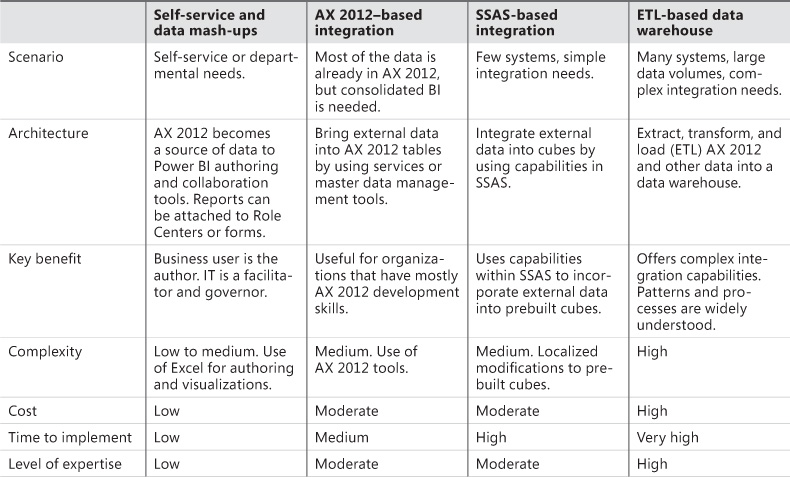
The self-service and data mash-up option is best suited to an environment where capable users author and publish analyses for others. Power BI, an add-in to Microsoft Office 365, provides a set of rich authoring and collaboration capabilities that can use AX 2012 data securely. For more information, see “Power BI for Office 365,” later in this chapter.
When most data is in AX 2012 (assuming that AX 2012 is the predominant source of data in your organization), you have two options.
You can bring external data into AX 2012 either through services (data services consumed by means of inbound ports) or as batch jobs that are executed periodically to import data into tables. With this approach, external data is represented as read-only data within AX 2012. The benefit to this approach is that external data appears as native data to AX 2012 tools. You can create analytics, reports, and inquiry forms that use the combined data.
A more complex approach involves integrating external data directly into the AX 2012 BI solution. With this option, a BI developer adds another data source to the prebuilt BI solution by using SSDT. Additional data tables are brought into the DSV by using the new data connection. It is possible to create dimensions and measures by using the new tables in the DSV.
The traditional ETL-based data warehouse option is suited to scenarios that require complex transformations or large volumes of data. Although this option is more flexible in terms of capabilities, it is also the most expensive to implement and manage.
You might want to build a data warehouse to implement the following scenarios:
![]() Integrate external data sources with AX 2012 data In this approach, the AX 2012 implementation serves as one of many corporate applications. Although AX 2012 contains some of the corporate data, other systems contain a considerable portion of the data. To make decisions, you must combine data across systems, and the data warehouse serves that need.
Integrate external data sources with AX 2012 data In this approach, the AX 2012 implementation serves as one of many corporate applications. Although AX 2012 contains some of the corporate data, other systems contain a considerable portion of the data. To make decisions, you must combine data across systems, and the data warehouse serves that need.
![]() Incorporate legacy data into AX 2012 analytics Most organizations migrate recent data when implementing AX 2012. Legacy data is still maintained in read-only instances of legacy applications. Although legacy data is no longer used for operational purposes, it is required for historical trend analysis. A data warehouse serves as the repository where legacy data is combined with current data.
Incorporate legacy data into AX 2012 analytics Most organizations migrate recent data when implementing AX 2012. Legacy data is still maintained in read-only instances of legacy applications. Although legacy data is no longer used for operational purposes, it is required for historical trend analysis. A data warehouse serves as the repository where legacy data is combined with current data.
Although AX 2012 does not directly support the creation of a data warehouse schema, the following artifacts generated in AX 2012 can be used to build a data warehouse:
![]() The DSV generated as part of the prebuilt analytic solution can be used within SQL Server Integration Services when an ETL package is developed to extract data from AX 2012.
The DSV generated as part of the prebuilt analytic solution can be used within SQL Server Integration Services when an ETL package is developed to extract data from AX 2012.
![]() AX 2012 document services can be consumed as data sources based on Simple Object Access Protocol (SOAP).
AX 2012 document services can be consumed as data sources based on Simple Object Access Protocol (SOAP).
![]() AX 2012 queries can be exposed as OData feeds.
AX 2012 queries can be exposed as OData feeds.
Maintaining customized and extended projects in the AOT
Previous sections discussed how to modify and extend the prebuilt cubes by using the SQL Server Analysis Services Project Wizard and SSDT. The AX 2012 BI project is saved in the AOT, and as a first-class citizen of the AOT, it can be layered and distributed in a way that is similar to AX 2012 source code.
So how do you use the capabilities offered by the AOT and AX 2012 models for managing customized and extended SSAS projects? In AX 2012 R2 cumulative update 7 and later, SSAS projects extended with SSDT can be imported back into the AOT. This facility is especially powerful if you need to customize or extend the prebuilt cubes in a multiple-partition environment.
Beginning with AX 2012 R2, you can deploy the prebuilt SSAS project as multiple databases, with one database per partition. If you need to add one set of calendars and financial dimensions for one partition and another set of calendars and financial dimensions for another, you can do so in AX 2012 R2 cumulative update 7 or later.
The import function strips out partition-specific information when the project is imported into the AOT, and you can rename the project to indicate that it is associated with a specific partition. When you deploy the project by using the SQL Server Analysis Services Project Wizard, relevant partition filters are applied back to the project to restrict data to the correct partition.
![]() Important
Important
If you decide to customize or extend the project by adding partition-specific content, it’s a good practice to rename the project before importing it. If you do not rename the project, it will be imported on top of the Dynamics AX project with the assumption that you wanted to overlayer the solution. If you import another partition-specific project without renaming it, your changes to the first project will be overwritten by the second.
To import and deploy a modified project:
1. Rename the modified project file. (The project file has a .dwproj extension.)
2. In the AOT, right-click the Analysis Services Projects node, and then click Import.
3. In the Choose Analysis Services Project dialog box, navigate to the modified project file, and then click OK.
4. Launch the SQL Server Analysis Services Project Wizard, and follow the options to deploy the project to an SSAS server. For more information, see “Deploying cubes,” earlier in this chapter.
If you are deploying a partition-specific project, notice that based on partitions you have chosen to deploy the project to, the system adds the required partition filters to the project.
Creating cubes
This section discusses how to create new cubes and reports by using tools built into AX 2012.
Figure 10-19 shows the four-step process for creating a cube.
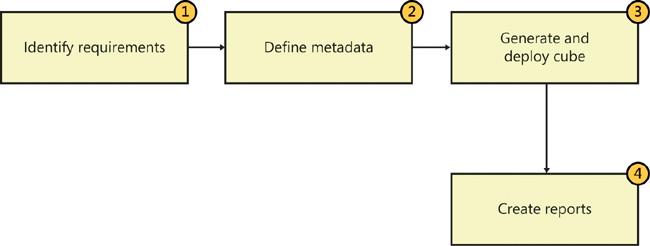
The following sections describe the process of creating a cube in more detail.
Identifying requirements
Often, when a user asks for additional information, you get a request for a new report (or two or three). For example, you might get a requirement request for a report like the one shown in Figure 10-20 from someone in the Sales department.
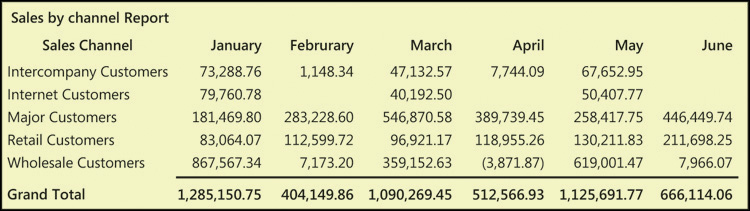
This report shows sales revenue trends by sales channel. More formally stated, this report shows sales revenue by sales channel by calendar month.
The request for this report might be followed by requests for “a few additional reports.” Some of the typical follow-up questions would be:
![]() What about quarterly trends? Is there seasonality?
What about quarterly trends? Is there seasonality?
![]() Are some regions doing better than others?
Are some regions doing better than others?
![]() Can we see the number of units sold instead of revenue?
Can we see the number of units sold instead of revenue?
![]() Can we see the average unit price? Are steep discounts being given?
Can we see the average unit price? Are steep discounts being given?
If you were to build a PivotTable to answer these questions (which is probably a good idea, because this would let the users slice the data, thus saving you from the effort of building all of those reports), you could construct a PivotTable like the one shown in Figure 10-21.
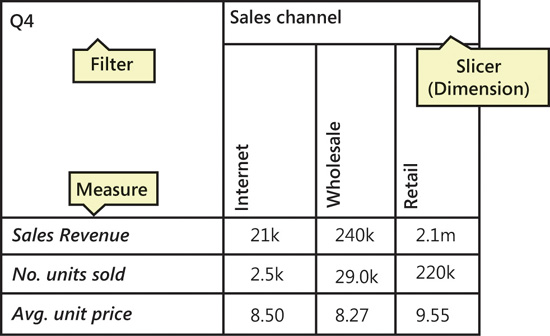
In this case, you have identified the measures (the numbers you are interested in) and the dimensions (the pivots for the data).
The following sections show how to build a cube to meet these requirements.
Defining metadata
The next step is to determine which AX 2012 tables or views contain this information. For the purpose of this example, assume the following:
![]() The CUSTTRANSTOTALSALES view contains sales invoice details.
The CUSTTRANSTOTALSALES view contains sales invoice details.
![]() The CUSTTABLECUBE view contains master data about customers.
The CUSTTABLECUBE view contains master data about customers.
![]() The CUSTPAYMMODETABLE table contains payment mode information.
The CUSTPAYMMODETABLE table contains payment mode information.
Defining perspectives
Next, you need to define the metadata that is required to generate the cube in the AOT. As you might recall from AX 2009, you define the metadata required to generate cubes in the Data DictionaryPerspectives node of the AOT.
Each perspective corresponds to a cube. Tables or views that are contained in a perspective node generate measures or dimensions. Depending on table relationships (and inferred view relationships), measures are associated with dimensions within the generated project.
![]() Note
Note
In AX 2012, you can use views to model a cube.
For times when you want to designate a perspective node that contains only dimensions, AX 2012 includes a property at the perspective level specifically for this purpose: SharedDimensionContainer. If you designate a perspective as a shared dimension container, tables and views within that perspective will be used only to create dimensions. Moreover, all of the dimensions will be associated with all of the measures; that is, they are truly shared dimensions, provided that they are related in AX 2012.
Follow these steps to create the new perspective for this example:
1. In the AOT, expand the Data DictionaryPerspectives node.
2. Create a new perspective node, and name it MyCustomers.
The new node contains two subnodes: Tables and Views.
3. Set the Usage property of the node to OLAP to designate that this perspective will be used to generate a cube.
If you are familiar with AX 2009, you might notice that the Ad-Hoc Reporting option for the Usage property is missing in AX 2012. You can select only OLAP or None. It is no longer possible to generate report models by using perspectives in AX 2012.
4. Drag the tables and views listed in the previous section into the newly created perspective.
For more information, see “Create a perspective for a cube” at http://msdn.microsoft.com/en-us/library/cc617589.aspx.
Defining table-level properties
Strictly speaking, table-level properties (see Figure 10-22) are optional. However, if you use them, cubes will perform better.
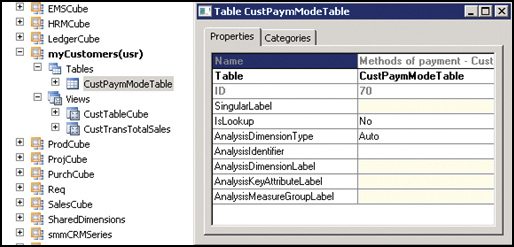
You can also specify custom labels to give specific names to generated measure groups and dimensions. AnalysisDimensionLabel, AnalysisKeyAttributeLabel, and AnalysisMeasureGroupLabel are new properties introduced in AX 2012. Instead of providing English text, you can provide AX 2012 labels so that dimension names are translated into other languages. The AnalysisIdentifier property defines the field that provides the name for a dimension key. If you look at the Name field for this property in Figure 10-22, you will notice that the Methods Of Payment dimension is keyed by the Name field.
For more information, see “Business Intelligence Properties” at http://msdn.microsoft.com/en-us/library/cc519277.aspx.
If you are a fan of the semantics introduced with the IsLookUp property in AX 2009, you will be pleased to know that views in AX 2012 provide this functionality. However, the IsLookUp property will be deprecated in future releases, so it is recommended that you do not use this property.
Defining field-level properties
Defining field-level properties is the key step in defining metadata. You need to identify individual measures and attributes that are necessary in the cube.
First, expand the CUSTTRANSTOTALSALES view, and set the field properties as shown in Table 10-3.
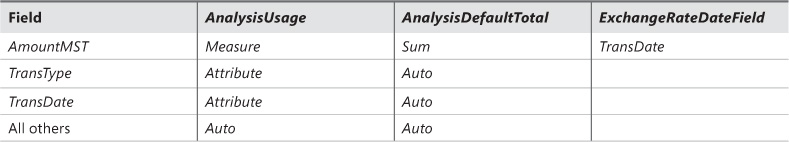
The AmountMST field will generate a measure that is summed when it is aggregated. ExchangeRate-DateField is a new attribute that was added in AX 2012 for currency conversion. In this example, the OLAP framework should convert the AmountMST measure to all available currencies, so that users can analyze transactions (possibly conducted in different currencies) across a common currency. The TransDate field contains the date on which the measure will be converted into other currencies with AX 2012 exchange rates.
Users need to be able to slice the data by TransType and TransDate, so these fields are designated as attributes.
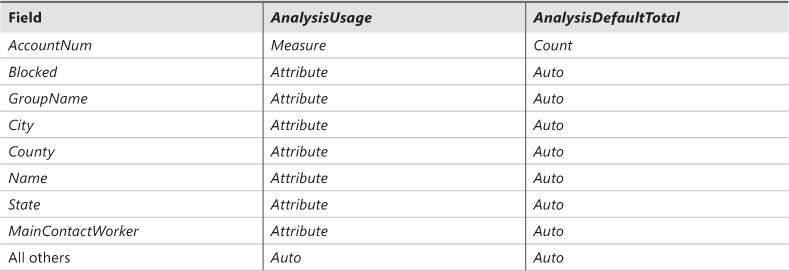
Next, open the CUSTTABLECUBE view, and set the field-level properties as shown in Table 10-4.
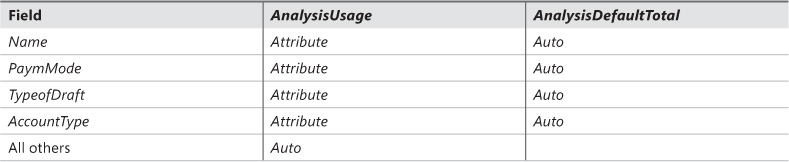
Finally, expand the CUSTPAYMMODETABLE table, and set the field-level properties as shown in Table 10-5.
For more information about field-level properties, see “Business Intelligence Properties” at http://msdn.microsoft.com/en-us/library/cc519277.aspx.
Generating and deploying the cube
After you define the necessary metadata, you can generate an SSAS project by using the SQL Server Analysis Services Project Wizard. You can deploy and process the project directly from the wizard, or you can open the project in BI Development Studio and extend it by using SQL Server functionality.
Defining the project
In the wizard, select the Create option, because you are creating a new project, and provide a name. Alternatively, if you want to include the new cube in the prebuilt SSAS project, you can select the Update option.
On the next page, you select the perspectives that are used to generate cubes and dimensions within the project. For this example, you would select the MyCustomers perspective. You can include one or more perspectives within the same project.
You can also include AX 2012 financial dimensions, in addition to calendars and languages, as discussed earlier in this chapter.
Adding currency conversion logic
Next, the wizard lets you add currency conversion logic to the project.
As you might recall, while you were defining field-level properties for the perspective, AmountMST was identified as a measure that needs to be converted to other currencies. The AmountMST field contains an amount that is recorded in the accounting currency of the company. Because AX 2012 might contain multiple companies that have different accounting currencies, transactions might be recorded in different accounting currencies.
For example, the CEU company’s accounting currency is GBP, whereas the CEUE company’s accounting currency is USD. In the AmountMST field, sales for CEU are recorded in GBP, whereas those for CEUE are recorded in USD.
Because a cube aggregates data across companies, a user browsing the cube could inadvertently add GBP values to USD values unless something is done to differentiate the two amounts. The AX 2012 OLAP framework builds this mechanism for you in the form of currency conversion support.
AX 2012 cubes contain two system dimensions: Currency and Analysis Currency. If the user uses the Currency dimension to split the measures that are shown, AX 2012 displays amounts only in the chosen currency. If the user uses the Analysis Currency dimension to split the measures that are shown, all amounts are shown, but the resulting values are converted to the chosen analysis currency by using AX 2012 exchange rates. This happens through currency conversion.
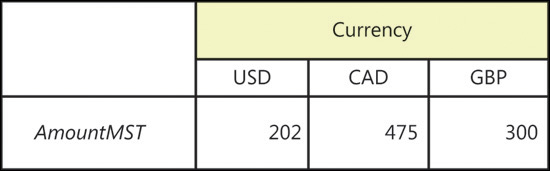
Here is an example: assume that the transactions shown in Figure 10-23 are included in the CUSTTRANSTOTALSALES view. (Note that two columns have been added, Accounting Currency and Amount Cur, to clarify that each company has a different accounting currency.)
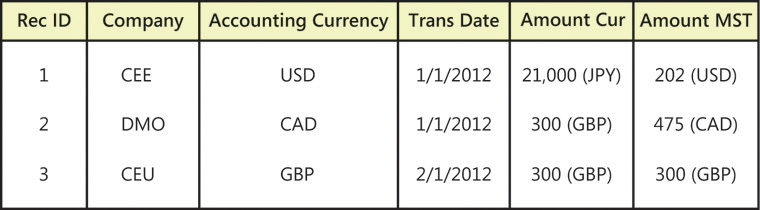
If a user creates a PivotTable and displays the total AmountMST value split by the Analysis Currency dimension, the result would look like the PivotTable shown in Figure 10-24.
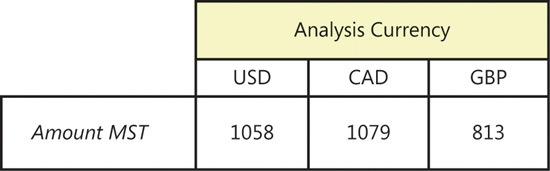
To get the value of AmountMST in USD, the system calculated the USD equivalent of each of the amounts, as shown in Figure 10-25.
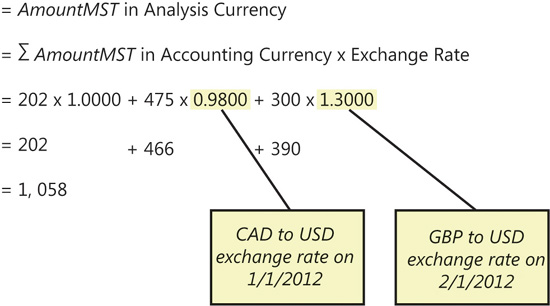
To determine the exchange rate between CAD and USD, and between GBP and USD, the system used the field-level metadata tag ExchangeRateDateField. For this example, the ExchangeRateDateField value for AmountMST is TransDate. So the TransDate value associated with each record was used to find the exchange rate to use for the conversion.
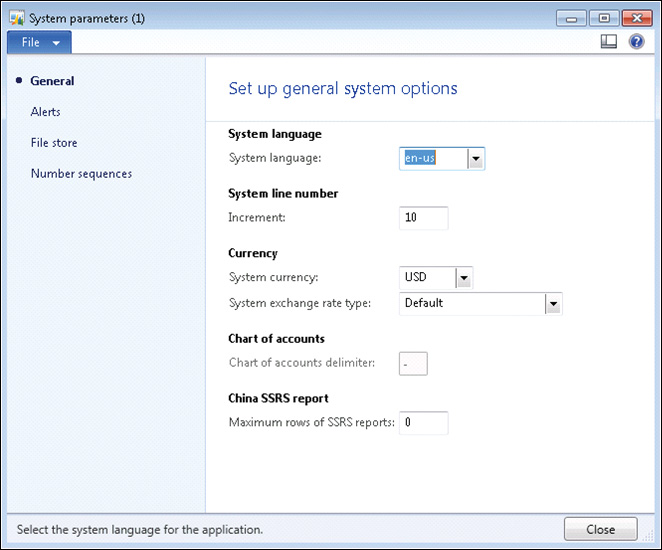
AX 2012 has the concept of a rate type. In other words, multiple exchange rates can be associated with a particular company. A company can use different rates for different purposes or different rates for different locations. The AX 2012 OLAP framework uses the system exchange rate type for the currency conversion logic. This rate type is a systemwide parameter that a system administrator specifies on the System Parameters form (System Administration > Setup > System Parameters), as shown in Figure 10-26.
If you create a PivotTable with the Currency dimension, AmountMST values are filtered by the specified currency, as shown in Figure 10-27. You would expect this behavior if you created a PivotTable with any dimension.
If you define the field-level metadata tag ExchangeRateDateField, the wizard adds the currency conversion calculation to the generated project as a multidimensional expression (MDX) script. The wizard also adds the Analysis Currency system dimension (the Currency dimension is added regardless of whether you select currency conversion). The wizard also creates an intermediate measure group called Exchange Rates By Day in each cube.
If you open the generated project in SSDT, you can see the currency conversion calculation created by the wizard:
CALCULATE;
//-----------------------------------------------------------------------------
// Dynamics AX framework generated currency conversion script.
// Customizing this portion of the script may cause problems with the updating
// of this project and future upgrades to the software.
//-----------------------------------------------------------------------------
Scope ( { Measures.[Amount] } );
Scope( Leaves([Exchange rate date]),
Except([Analysis currency].[Currency].[Currency].Members,
[Analysis currency].[Currency].[Local]),
Leaves([Company]));
Scope( { Measures.[Amount] } );
This = [Analysis currency].[Currency].[Local] * ((Measures.[Exchange rate],
StrToMember("[Currency].[Currency].&["+[Company].[Accounting currency].CurrentMember.Name+"]"))
/ 100.0);
End Scope;
End Scope;
Scope( Leaves([Exchange rate date]),
Except([Analysis currency].[Currency name].[Currency name].Members,
[Analysis currency].[Currency name].[Local]),
Leaves([Company]));
Scope( { Measures.[Amount] } );
This = [Analysis currency].[Currency].[Local] * ((Measures.[Exchange rate],
StrToMember("[Currency].[Currency].&["+[Company].[Accounting currency].CurrentMember.Name+"]"))
/ 100.0);
End Scope;
End Scope;
Scope( Leaves([Exchange rate date]),
Except([Analysis currency].[ISO currency code].[ISO currency code].Members,
[Analysis currency].[ISO currency code].[Local]),
Leaves([Company]));
Scope( { Measures.[Amount] } );
This = [Analysis currency].[Currency].[Local] * ((Measures.[Exchange rate],
StrToMember("[Currency].[Currency].&["+[Company].[Accounting currency].CurrentMember.Name+"]"))
/ 100.0);
End Scope;
End Scope;
Scope( Leaves([Exchange rate date]),
Except([Analysis currency].[Symbol].[Symbol].Members,
[Analysis currency].[Symbol].[Local]),
Leaves([Company]));
Scope( { Measures.[Amount] } );
This = [Analysis currency].[Currency].[Local] * ((Measures.[Exchange rate],
StrToMember("[Currency].[Currency].&["+[Company].[Accounting currency].CurrentMember.Name+"]"))
/ 100.0);
End Scope;
End Scope;
End Scope;
//-----------------------------------------------------------------------------
// End of Microsoft Dynamics AX framework generated currency conversion script.
//-----------------------------------------------------------------------------
This logic is similar to the code added by the Define Currency Conversion option in the SSAS Business Intelligence Wizard. If the selected exchange rate type does not have records corresponding to the dates (for example, TransDate) that are present in data, the calculations will use the most recent rate for the corresponding currency pair.
![]() Important
Important
The wizard maintains this script as you configure and update analysis projects. If you modify the script manually, your changes will be overwritten by the framework each time.
Saving the project
After you specify currency conversion options, the system will generate the project and prompt you for a destination to which to save the project.
You can save the project in the AOT or on disk. This gives you the flexibility to maintain SSAS projects in the development environment of your choice. OLAP framework tools, such as the SQL Server Analysis Services Project Wizard, will work with projects whether they are on disk or in the AOT.
If you save the project in the AOT, the project will be saved in your layer.
Deploying and processing the project
You can deploy the project directly to the SSAS server at this stage. It’s important to note that the wizard calls the SSAS deployment functionality behind the scenes. If you do not have the AX 2012 Development Workspace (including SSDT) installed on your computer, this step might fail.
As discussed earlier, in AX 2012 R2 and later you can deploy a project to multiple partitions. If you have multiple partitions defined, you can deploy the project to the set of partitions you choose.
Adding KPIs and calculations
You can define KPIs by using SSDT after you generate the project. You implement KPIs and calculated measures by using MDX.
The KPIs and calculated measures in the prebuilt SSAS project are also created in this way. If you create your own KPIs and calculated measures, the SQL Server Analysis Services Project Wizard will preserve them when you perform updates.
For more information, see “Walkthrough: Defining KPIs for a Cube” at http://msdn.microsoft.com/en-us/library/dd261469.aspx.
If you are an expert MDX developer, you might be tempted to implement complex calculations and KPIs. However, a best practice is to move your calculations to AX 2012 views and tables as much as possible. This way, you not only use the expressive power of AX 2012, but you also move the calculations that must be pre-aggregated, so that you get better run-time performance.
You can move calculations to AX 2012 in the following ways:
![]() Reuse AX 2012 tables and fields Chances are that the AX 2012 schema already contains most of the calculations that you need. If the information is not directly available in the primary table, review secondary tables and fields to see whether corresponding fields are available. A small investment in reviewing the schema will save you a lot of MDX code.
Reuse AX 2012 tables and fields Chances are that the AX 2012 schema already contains most of the calculations that you need. If the information is not directly available in the primary table, review secondary tables and fields to see whether corresponding fields are available. A small investment in reviewing the schema will save you a lot of MDX code.
![]() Define AX 2012 views with computed columns AX 2012 view support in perspectives enables a host of scenarios where multiple tables can be joined to create rich views. The AX 2012 view framework also provides support for creating computed columns in AX 2012 views. For more information, see “Walkthrough: Add a Computed Column to a View” at http://msdn.microsoft.com/en-us/library/gg845841.aspx.
Define AX 2012 views with computed columns AX 2012 view support in perspectives enables a host of scenarios where multiple tables can be joined to create rich views. The AX 2012 view framework also provides support for creating computed columns in AX 2012 views. For more information, see “Walkthrough: Add a Computed Column to a View” at http://msdn.microsoft.com/en-us/library/gg845841.aspx.
Displaying analytic content in Role Centers
After you create a cube, users can navigate through the aggregated measures and slice them on the dimensions. This section describes ways that you can expose cube content to users.
However, before discussing the presentation tools, this section examines the jobs that people actually do in an organization, to help you understand the nature of the insights that those people need to do those jobs better.
Table 10-6 lists some options for exposing cube data. Later sections discuss those options in greater detail.
![]() Note
Note
Developers can also create interactive reports by using the Enterprise Portal Chart Control. For more information, see Chapter 9, “Reporting in AX 2012.”
Providing insights tailored to a persona
For the purposes of this discussion, the people in an organization, or personas, are divided into three broad categories: operational, tactical, and strategic.
![]() Operational personas, such as an Accounts Receivable administrator, focus primarily on staying productive and performing day-to-day tasks, such as keeping track of receivables.
Operational personas, such as an Accounts Receivable administrator, focus primarily on staying productive and performing day-to-day tasks, such as keeping track of receivables.
![]() Tactical personas, such as heads of departments and supervisors, have an additional responsibility as people and resource managers; they need to ensure that their teams function smoothly.
Tactical personas, such as heads of departments and supervisors, have an additional responsibility as people and resource managers; they need to ensure that their teams function smoothly.
![]() Strategic personas such as chief executive officers (CEOs) need to take a broader corporate view; they tend to operate on established goals and milestones that are evaluated on a wider scale.
Strategic personas such as chief executive officers (CEOs) need to take a broader corporate view; they tend to operate on established goals and milestones that are evaluated on a wider scale.
Of course, there is an element of operational focus in a tactical persona, and vice versa, but for simplicity, those aspects are not covered here.
Consider a day in the life of an Accounts Receivable (AR) administrator. Like many AR administrators, this administrator is extremely busy at the end of each month (or every Friday, depending on the natural cycle of the business), calling customers and following up on payments. In this case, the AR administrator focuses on exceptions (large payments that are late). If he has more than a few items to work with, he needs a way to prioritize and filter the cases—or even better—see trends within the items at hand. After he identifies a case, he needs to take action and complete the task; for example, he makes a call or sends a note to ensure that the bill is paid.
In this example, insights would help the AR administrator in three areas:
![]() First, he needs to detect exceptions.
First, he needs to detect exceptions.
![]() Next, he needs to identify clusters, trends, and anomalies.
Next, he needs to identify clusters, trends, and anomalies.
![]() Finally, he needs to be able to take action.
Finally, he needs to be able to take action.
Of course, real-world AR administrators don’t necessarily follow these steps in succession. But these are three situations where insights need to be applied to help the AR administrator accomplish his daily goals.
Choosing a presentation tool based on a persona
Depending on the focus of the persona, different tools and approaches might be necessary.
Table 10-7 shows a list of situations in which each persona requires BI tools to provide insight and suggests presentation tools that would meet the needs of each situation.
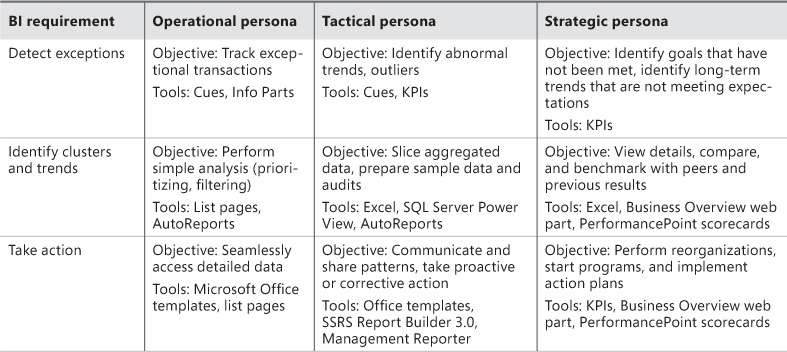
The tools in Table 10-7 are just suggestions for how you can provide insights to users. However, nothing prevents you from using, for example, the Business Overview web part in a Role Center for an operational persona, or from using cues to display detailed data in a Role Center for a strategic persona. For more information about cues and info parts, see Chapter 5, “Designing the user experience.”
SQL Server Power View
SQL Server Power View is an interactive, browser-based data exploration, visualization, and presentation tool for casual users that is included with SQL Server 2012. Power View requires SQL Server 2012 BI edition or greater, in addition to SharePoint Server 2010 or later (Enterprise edition).
Power View is a component of the presentation layer in the logical architecture discussed earlier. Power View relies on the power of aggregated data sources, such as cubes, to provide an interactive and visual experience of large sets of data.
Integrating Power View with AX 2012 and AX 2012 Feature Pack
Beginning with AX 2012 R2, Power View capabilities are built in. But if you have a previous release of AX 2012, you can integrate Power View with the product in several ways:
![]() A system administrator can create a Reporting Services data connection file (.rsds file) for AX 2012 cubes so that users can explore them with Power View. The cubes must be hosted on SQL Server Analysis Services 2012 SP1 cumulative update 4 or later—previous versions of SQL Server Analysis Services do not have the required components to support Power View integration. After the system administrator creates the data connection, users can create Power View reports. For step-by-step instructions, see the article, “Create a report by using Power View to connect to a cube,” at http://technet.microsoft.com/en-us/library/jj933492.aspx.
A system administrator can create a Reporting Services data connection file (.rsds file) for AX 2012 cubes so that users can explore them with Power View. The cubes must be hosted on SQL Server Analysis Services 2012 SP1 cumulative update 4 or later—previous versions of SQL Server Analysis Services do not have the required components to support Power View integration. After the system administrator creates the data connection, users can create Power View reports. For step-by-step instructions, see the article, “Create a report by using Power View to connect to a cube,” at http://technet.microsoft.com/en-us/library/jj933492.aspx.
![]() Power users can use Excel along with the PowerPivot add-in to create workbooks that combine AX 2012 data with external data sources. Excel workbooks created with the PowerPivot add-in contain an aggregate model that is embedded within the workbook. (These workbooks are commonly known as data mash-ups.) After the user saves the workbooks to SharePoint Server, they function in a way that is similar to tabular aggregate models. This enables a system administrator to create data connections and publish the workbooks so that users can explore data by using Power View.
Power users can use Excel along with the PowerPivot add-in to create workbooks that combine AX 2012 data with external data sources. Excel workbooks created with the PowerPivot add-in contain an aggregate model that is embedded within the workbook. (These workbooks are commonly known as data mash-ups.) After the user saves the workbooks to SharePoint Server, they function in a way that is similar to tabular aggregate models. This enables a system administrator to create data connections and publish the workbooks so that users can explore data by using Power View.
![]() Note
Note
AX 2012 queries exposed as OData feeds are the best means of consuming data with this approach, because OData feeds ensure that AX security is enforced at the AOS level.
![]() Developers can create tabular models by using SSDT, the Visual Studio–based developer tools for creating BI models. When creating tabular models, you can either start from a PowerPivot model created by a user (that is, add production-ready capabilities to an existing model) or start from scratch. With either approach, you can create a tabular model that consumes data from AX 2012 by means of OData feeds or cubes.
Developers can create tabular models by using SSDT, the Visual Studio–based developer tools for creating BI models. When creating tabular models, you can either start from a PowerPivot model created by a user (that is, add production-ready capabilities to an existing model) or start from scratch. With either approach, you can create a tabular model that consumes data from AX 2012 by means of OData feeds or cubes.
After you develop a tabular model, you deploy it to the SSAS server; however, the server must be configured in tabular mode, not multidimensional mode.
![]() Note
Note
Starting with SQL Server 2012, an SSAS server can be configured for either multidimensional mode (required for hosting AX 2012 cubes) or tabular mode (required for hosting tabular models). An SSAS server that is in multidimensional mode cannot host a tabular model, and an SSAS server that is in tabular mode cannot host an AX 2012 cube.
Deploying Power View in AX 2012 R2 and AX 2012 R3
Beginning with AX 2012 R2, users can launch Power View from a list page and explore patterns and trends that lie beneath the information shown on the page. For example, when a user clicks the Analyze Data button on the Past Due Customers list page, one of seven list pages that contain the Analyze Data button, a new browser window opens with a blank Power View canvas backed by a cube that is related to the data shown on the list page. The user can quickly create a compelling report that uses pre-aggregated data in the cube.
Reports created with Power View can be exported to Microsoft PowerPoint to include in a presentation, or they can be saved to SharePoint Server. By using the built-in collaboration capabilities of SharePoint Server, users can rate, share, and discuss business trends and issues highlighted in the reports.
You can add Power View reports that have been saved to SharePoint Server to a Role Center by using the Power View web part introduced with AX 2012 R2. The CFO Role Center in AX 2012 R2 provides an example of a rich Role Center with added Power View reports.
To deploy Power View in AX 2012 R2 or AX 2012 R3, you need to install the Power View integration feature of SharePoint 2013 (or SharePoint Server 2010) before you deploy Role Centers. Also note that SQL Server 2012 SP1 cumulative update 4 or later is required. For more information, see “Installing the BI features of SharePoint 2013” at http://blogs.msdn.com/b/querysimon/archive/2012/11/26/installing-the-bi-features-of-sharepoint-2013.aspx.
After installing the Power View integration feature of SharePoint, you should be able to create a Power View report by using a PowerPivot model saved to SharePoint. It is a best practice to create a standalone Power View report model before you deploy Power View in AX 2012 R2 or AX 2012 R3. For more information, see “Tutorial: Create a Sample Report in Power View” at http://technet.microsoft.com/en-us/library/hh759325(v=sql.110).aspx.
After you install and configure the Power View integration feature of SharePoint Server, when you install Role Centers, the required Power View artifacts are deployed to a folder in Enterprise Portal. The system creates a folder called Power View Reports, in addition to sets of reports and data connections. The reports correspond to the predefined Power View reports that are included with AX 2012 R2 and AX 2012 R3. The data connections correspond to the cubes that the reports use.
In addition to the data connections created by the system, you can create new data connections that point to additional cubes. For more information, see “Create a report by using Power View to connect to a cube” at http://msdn.microsoft.com/EN-US/library/jj933492.aspx.
Exposing a Power View report by using the Power View web part
The Power View web part that was introduced with AX 2012 R2 simplifies the process of adding reports to a Role Center the following ways:
![]() The report is formatted in a way that makes it easy to embed within a webpage. For example, the Power View toolbars are removed and the report is sized to fit within the window.
The report is formatted in a way that makes it easy to embed within a webpage. For example, the Power View toolbars are removed and the report is sized to fit within the window.
![]() The AX 2012 company context is passed to the underlying Power View report so that the user sees data from the same company that is in focus within the Role Center. When the user changes the company in the Role Center, the appropriate filter is passed to the report.
The AX 2012 company context is passed to the underlying Power View report so that the user sees data from the same company that is in focus within the Role Center. When the user changes the company in the Role Center, the appropriate filter is passed to the report.
To include a Power View report in a Role Center, do the following:
1. Launch the Role Center in Enterprise Portal. Click the Page tab on the upper-left side of the page, and then click the Edit Page button. This action launches the page in edit mode.
2. Notice the placeholders for web parts within the page. Click the placeholder where you want to save the report. A list of available web parts appears.
3. From the list of available web parts, select the SQL Server Power View web part.
4. Provide a report name: you can use the report picker (the table icon to the right of the file name) to select a report from a list of available reports.
5. Provide the size of the window in which you want the report to be displayed; for example, set the width to 500 pixels and let the web part adjust the height based on the report dimensions.
You should see the web part displayed in the Role Center.
Exposing a Power View report by using the Page Viewer web part
If you have not upgraded to AX 2012 R2 or AX 2012 R3 but have set up the Power View infrastructure, you can still embed an existing Power View report in a Role Center by using the Page Viewer web part. The added value provided by the Power View web part—such as passing the user’s context to Power View and sizing the report to fit the page—is not available with this approach, but you can apply those attributes manually.
1. Start the Power View report viewer in a browser window, copy the URL for the report, and then paste it into Notepad. The URL will look something like this:
Notice that the first part of the URL contains the path to Power View Designer and the report being viewed in the designer. The remainder of the URL consists of a collection of parameters that are passed to Power View Designer when it is started by the caller.
2. (Optional) Customize the appearance of the Power View window in the Role Center by manipulating the parameters in the URL. Table 10-8 lists the parameters and describes what they do.
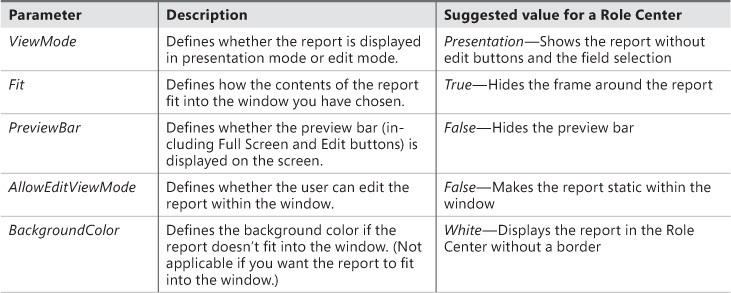
If you change the URL by applying the parameter values in Table 10-8, the modified URL might look as follows:
3. Open the Role Center, and select the option to modify or personalize the page. In edit mode, click Add Web Part. The Web Part gallery appears.
4. Select the Page Viewer web part from the gallery of available web parts. The Page Viewer web part is listed under the Media And Content category.
5. After you add the web part, specify the URL for the report by copying the URL that you pasted into Notepad.
6. Provide a height and width for the web part. The Power View report should appear within the Role Center.
![]() Note
Note
Depending on the color scheme you chose for the Power View report, the color scheme of the other charts displayed in the Role Center might not match. You can match the color scheme of the Power View report by editing the report in Power View Designer. This way, users won’t notice a difference between the Power View report and the other charts on the page.
Allowing users to edit a Power View report
Although embedding an existing Power View report enables users to interact with the data, you can also let users modify the reports. With the Power View web part, a user can launch a report in full-screen mode and make changes. The shortcut arrow in the upper-right corner of the report enables this functionality.
After the user opens the report and clicks the Edit button, she can view the measures and dimensions that are available for editing the report. After modifying the report, she can either save the report as a new report or save changes to the existing report.
If you used the Page Viewer web part to embed the Power View report in a Role Center or if you feel that the capability to edit a report might be beyond the reach of some of the users, you can allow users to edit a report by creating a quick link to start Power View in a separate browser window:
1. Create a new URL quick link by clicking the Add Links option in the Quick Links web part, as shown in Figure 10-28.
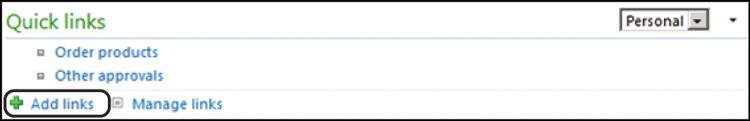
2. In the Add Quick Link dialog box, paste the URL of the Power View report. You will now see the new quick link added, as shown in Figure 10-29.
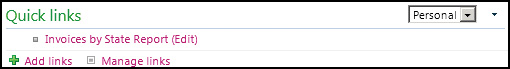
Adding the Analyze Data button to a list page
As mentioned earlier, the Analyze Data button launches the Power View report editor with cubes related to the data shown on the list page, so that a user can analyze trends and patterns behind the data. This button is available in AX 2012 R2 or later only if Power View has been deployed.
Although several list pages already contain this button, you can add the button to other list pages as required. The process is the same as adding an action button to a page: you add a button to the Action Pane of a page, and the button launches the URL of Power View Report Designer. So that you can build the Power View Report Designer URL at run time, AX 2012 R2 provides two application programming interfaces (APIs). The following code sample illustrates the APIs in action.
if (SrsReportHelper::isPowerViewModelDeployed('Accounts receivable cube'))
{
infolog.urlLookup(SrsReportHelper::getPowerViewDataSourceUrlClient('Accounts receivable
cube'));
}
else
{
// Cube has not been deployed – display error message.
}
This example checks to determine whether the Power View model—in this case, the Accounts Receivable cube—has been deployed. If the model has been deployed, the code generates the URL for a new report based on the Accounts Receivable cube and launches it. For more information, review the code behind an existing list page or see “Walkthrough: Creating an Analyze Data Button on a List Page” at http://technet.microsoft.com/EN-US/library/jj945385.aspx.
Power BI for Office 365
Power BI for Office 365 is a self-service BI solution delivered through Excel and Office 365 that provides power users with data analysis and visualization capabilities in the cloud. Subscribers to Office 365 can also subscribe to the Power BI service by paying a subscription fee. Some Power BI components are provided as add-ins to Excel, whereas others are available as services in Microsoft Azure. Table 10-9 summarizes the capabilities of Power BI tools.
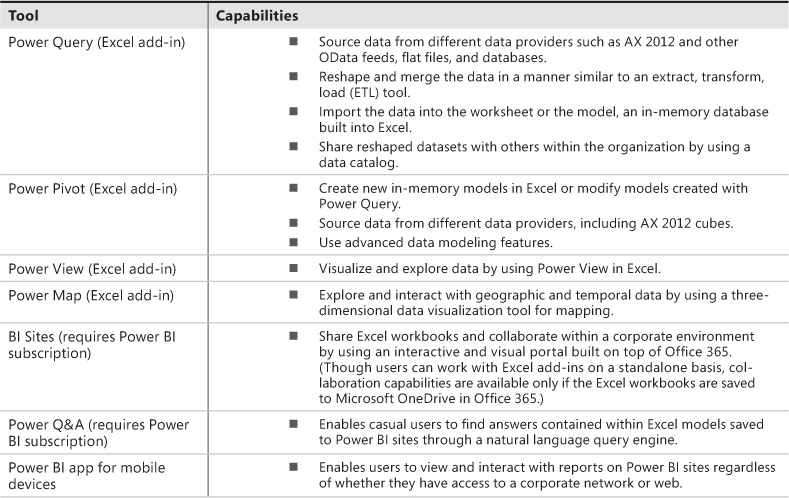
For a complete description of Power BI capabilities, see the Power BI for Office 365 Learning Guide at http://office.microsoft.com/en-001/office365-sharepoint-online-enterprise-help/power-bi-for-office-365-overview-and-learning-HA104103581.aspx.
AX 2012 OData feeds are a source of data for Power Query and PowerPivot. At the time of this writing, Power Query cannot consume data from AX 2012 cubes directly, so PowerPivot is the authoring option if you want to source aggregate data from AX 2012.
Comparing Power View and Power BI
Now that you are familiar with Power View and Power BI, you might be wondering why you should choose one over the other. Power View integration in AX 2012 R2 and later takes advantage of the Power View feature built into SharePoint Server and SSRS, so to integrate Power View with AX 2012 R2, you’ll need to implement and maintain a SharePoint Server infrastructure within your company. Power BI, however, is a cloud-based offering. You can use Power View along with several other tools if you subscribe to Power BI.
So the major difference is in how you get to Power View. If you want to subscribe to a public service, you can access Power View through Power BI. But if you want to implement your own infrastructure on premises, you should use the standalone version of Power View. At the time of this writing, Power BI has several limitations compared to Power View. However, Power BI provides additional tools that are not available with Power View.
Authoring with Excel
Excel is a simple yet powerful way to share reports with users in Role Centers. For example, you can:
![]() Analyze cube data in Excel and create PivotTables.
Analyze cube data in Excel and create PivotTables.
![]() Save PivotTable reports to Excel Services for SharePoint.
Save PivotTable reports to Excel Services for SharePoint.
![]() Expose Excel worksheets that are saved to Excel Services for SharePoint by using either the Excel Services web part or the Excel Web App.
Expose Excel worksheets that are saved to Excel Services for SharePoint by using either the Excel Services web part or the Excel Web App.
For step-by-step instructions that show how to create a PivotTable by using the prebuilt General ledger cube, see “Walkthrough: Analyzing Cube Data in Excel” at http://msdn.microsoft.com/en-us/library/dd261526.aspx.
Beginning with Excel Services for SharePoint 2010, you can expose charts and PivotTables built by using the Excel Services REST API. The URL that you obtain by using the REST API can be used to display a chart or a table in Role Centers. For more information about Excel Services, see “Overview of Excel Services in SharePoint Server 2013” at http://technet.microsoft.com/en-us/library/ee424405.aspx.
Business Overview web part and KPI List web part
The Business Overview web part was introduced in AX 2009 to display the KPIs in prebuilt cubes in Role Centers. This web part was initially modeled on the KPI List web part in SharePoint Enterprise edition, but it has evolved into a distinct web part in AX 2012. For example, the Business Overview web part provides user context awareness that is lacking in the generic KPI List web part. KPIs are filtered based on the context of the AX 2012 company and partition (for AX 2012 R2 and later) when they are shown in Role Centers. Also, when a user changes the language to German, for example, the Business Overview web part can switch the labels for the KPI to German.
If you are familiar with the Business Overview web part from AX 2009, you know that it had two modes. In AX 2012 R2 and later, the functionality of these two modes has been divided into separate web parts: the Business Overview web part and the KPI List web part. You no longer have to switch modes. If you want to display KPIs, use the KPI List web part. If you want to display indicators, use the Business Overview web part. The two web parts appear in the SharePoint Web Part gallery, as shown in Figure 10-30.
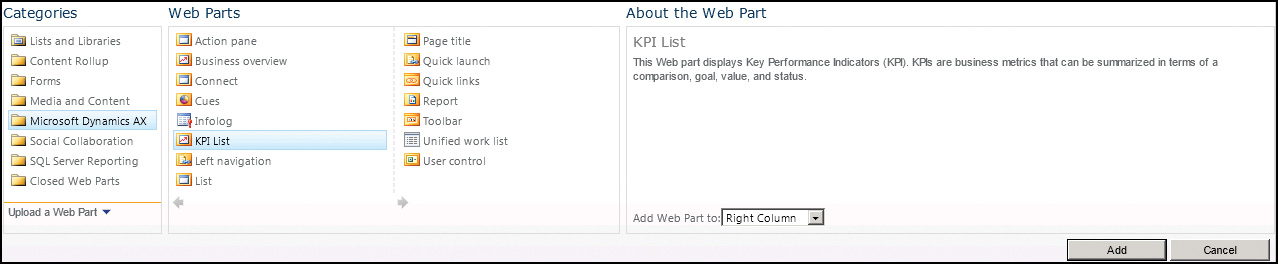
Both the Business Overview web part and the KPI List web part have some additional features:
![]() You can define multiple filters when displaying a KPI or an indicator. Until the release of AX 2012 R2, you could add a relative time filter only to a KPI displayed in the Business Overview web part.
You can define multiple filters when displaying a KPI or an indicator. Until the release of AX 2012 R2, you could add a relative time filter only to a KPI displayed in the Business Overview web part.
![]() You can add an AX 2012 menu item or a URL as a drill-through target to a KPI.
You can add an AX 2012 menu item or a URL as a drill-through target to a KPI.
![]() You can limit the number of values that are displayed on the screen when splitting a KPI with a specified value.
You can limit the number of values that are displayed on the screen when splitting a KPI with a specified value.
![]() Both web parts provide better error handling and graceful exit in case of errors that are caused by cube configuration issues.
Both web parts provide better error handling and graceful exit in case of errors that are caused by cube configuration issues.
![]() The Business Overview web part is extensible. You can create a custom skin for the Business Overview web part and extend its functionality to suit your own business area.
The Business Overview web part is extensible. You can create a custom skin for the Business Overview web part and extend its functionality to suit your own business area.
Other than the differences between the Business Overview web part and the KPI List web part that are explained in this section, their functionality is the same. You follow the same procedure to add an indicator to the Business Overview web part as you would to add a KPI to the KPI List web part, as described in the next section.
Adding a KPI to the KPI List web part
When you add a KPI, you use the Business Overview-Add KPI dialog box to define the KPI. If you’re familiar with this dialog box in AX 2009 or AX 2012, you will notice several additions beginning with AX 2012 R2, as shown in Figure 10-31. (The Add New Indicator dialog box and the Business Overview web part provide similar options).
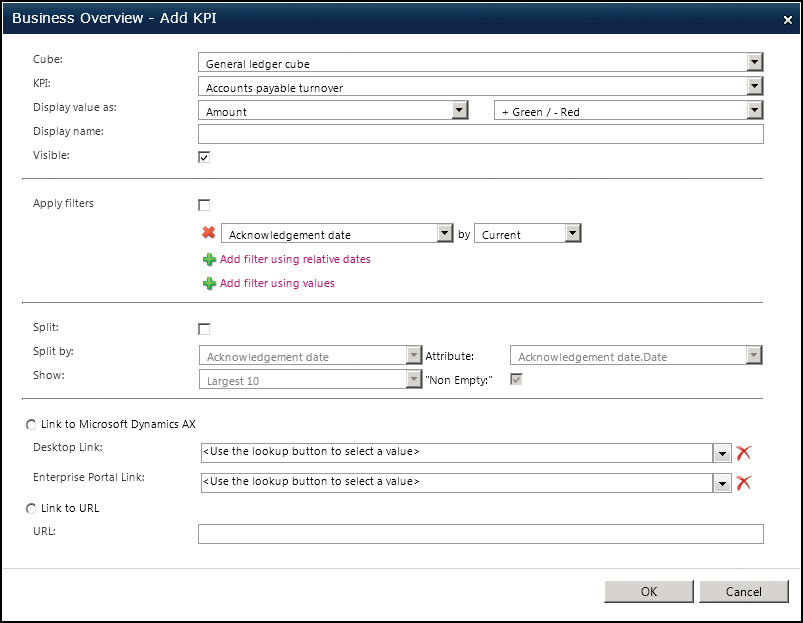
First, you have an expanded set of options for applying filters. You can add any number of filters—both relative time periods and fixed values. This way, a user can add a filter to an existing KPI definition and display it on his or her Role Center. This feature yields two benefits:
![]() You can define a general-purpose KPI definition that applies to the entire organization or the business unit.
You can define a general-purpose KPI definition that applies to the entire organization or the business unit.
![]() Users can narrow down the scope of the KPI definition so that it closely matches their area of focus, without developer intervention.
Users can narrow down the scope of the KPI definition so that it closely matches their area of focus, without developer intervention.
You are probably familiar with the Split option that lets a user display the breakdown of a KPI definition by a selected attribute. For example, the Revenue KPI can be split by sales units so that a sales manager can monitor units that are falling behind. Unlike in AX 2012, the user can display the top 10 or bottom 10 values, so that the list is not too long.
It was possible to provide a drill-through link to each KPI in AX 2012, but the picking experience was not user friendly. Beginning with AX 2012 R2, the picking experience has been improved so that the user can associate a menu item or a URL with each KPI.
Notice that the Cube field is already set to a prebuilt cube. The KPI List web part is hardwired to display KPIs from the default cube database. If you want to point the KPI List web part to a different database, you can specify the database by providing a database connection file—that is, an Office Data Connection (ODC) file. For information about how to define an ODC file and add ODC files to Enterprise Portal, see “How to: Create an ODC file for a Business Overview Web Part” at http://msdn.microsoft.com/en-us/library/hh128831.aspx.
![]() Note
Note
The default database is specified in the System Administration > Setup > Business Intelligence > Analysis Services > Analysis Servers form. When you deploy an SSAS project by using the SQL Server Analysis Services Project Wizard, the OLAP database created by this action is added to the list of databases in the Analysis Servers form. Click an analysis server, and then click the OLAP Databases tab (see Figure 10-32).
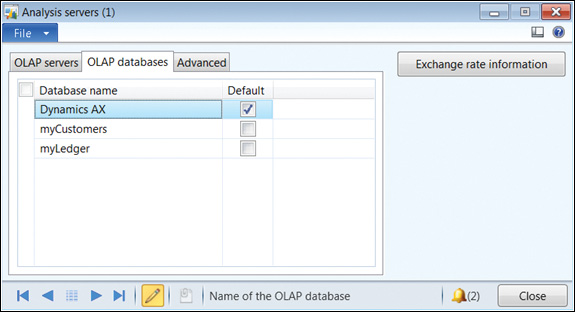
The Default check box specifies the default OLAP database used by the KPI List web part. You can change the default database by selecting the check box for a different database.
To add a KPI, do the following:
1. Start the AX 2012 client, and then navigate to a Role Center.
2. Select the option to edit the Role Center page. If you are using AX 2012 as a user, you can personalize the page for yourself only. If you are a developer customizing the page for everyone, launch Enterprise Portal and edit the page.
3. Click Add Web Part. You should see the SharePoint Web Part gallery, as shown earlier in Figure 10-30.
4. Click the KPI List web part, and then click Add. After the web part is added, click Exit Editing. Now you will see the new web part added to the Role Center page, as shown in Figure 10-33.

5. Click the Add KPIs option to add a new KPI to the web part. You will see a Business Overview-Add KPI dialog box similar to the one shown earlier in Figure 10-31.
6. Specify the options that you want for the new KPI, and then click OK.
Adding a custom time period filter
Relative time period filters are shown in the KPI List web part when you add a KPI or an indicator. However, you can define your own time period filter by using the Time Periods form (System Administration > Setup > Business Intelligence > Analysis Services > Time Periods), as shown in Figure 10-34.
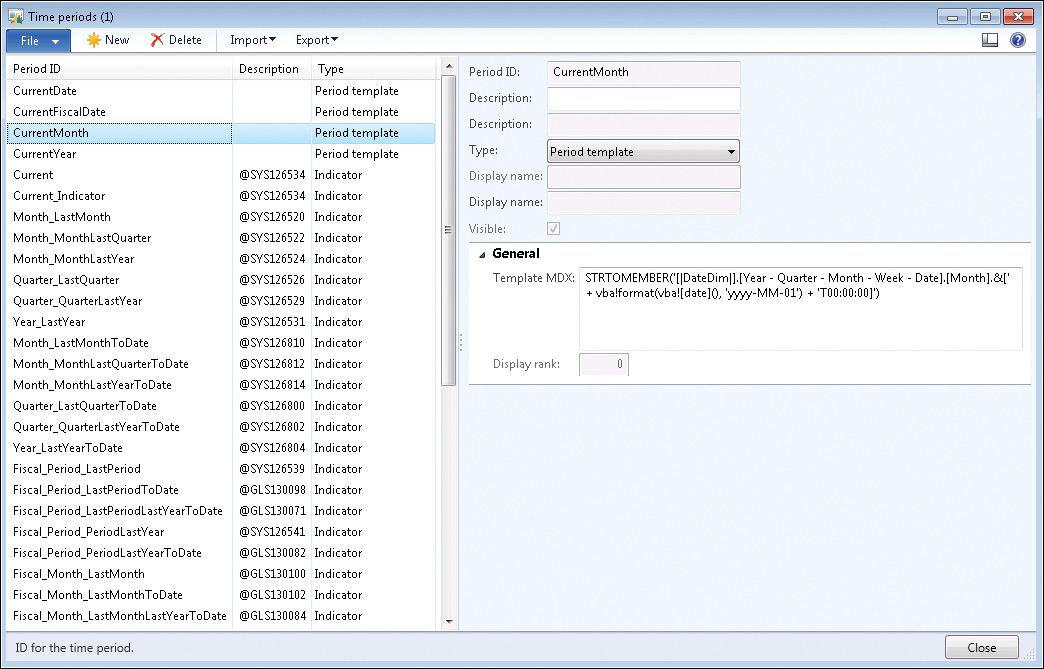
This form lists three types of time periods:
![]() Indicators These define the relative time periods that apply to indicators—the items that you add to the Business Overview web part.
Indicators These define the relative time periods that apply to indicators—the items that you add to the Business Overview web part.
![]() KPI lists These define the relative time periods that apply to KPIs—the items that you add to the KPI List web part.
KPI lists These define the relative time periods that apply to KPIs—the items that you add to the KPI List web part.
![]() Period templates These are reusable macros that can be used by both indicator and KPI list entries. Period templates save you from having to recode commonly used patterns repeatedly.
Period templates These are reusable macros that can be used by both indicator and KPI list entries. Period templates save you from having to recode commonly used patterns repeatedly.
You can define additional indicator and KPI list periods by using MDX code in this form. The KPI List web part makes these filters available to users at run time.
The following are example definitions to help you understand time period filters.
Period template: CurrentDate
If the time period definition is a template, you need to modify only the MDX expression in the template.
The CurrentDate period template contains the following MDX expression, which gets the current date from the system:
STRTOMEMBER('[|DateDim|].[Year - Quarter - Month - Week - Date].[Month].&[' +
vba!format(vba![date](), 'yyyy-MM-01') + 'T00:00:00]')
Notice the token |DateDim| in the expression. The Business Overview web part replaces this token with the actual name of the date dimension; therefore, you can use this expression with any date dimension.
If you examine the period template definition for CurrentFiscalDate, you will notice another token:
STRTOMEMBER('[|FiscalDateDim|].[Year quarter period month date].[Date].&[|c|]&[' +
vba!format(vba![date](), 'yyyy-MM-dd') + 'T00:00:00]')
In this case, the system interprets the token |FiscalDateDim| as a fiscal date dimension. The system identifies a fiscal date dimension by the name given to the dimension. The system interprets the token |c| as the current company.
Indicator: Month_LastMonth
The definition for the Month_LastMonth indicator uses the template that was discussed in the previous section.
The definition for an indicator contains two MDX expressions that correspond to two time period definitions. The expression that provides the value for the current period is defined in the Current Period MDX field. Because there is already a template for calculating the current month, you can use that definition by referencing the template %CurrentMember%.
The expression that provides the value for the previous period is defined in the Previous Period MDX field. Again, you can use the template already defined and define an expression by using that template.
You will also need to provide a description and a display name for the period definition, as shown in the left pane of the Time Period form. These descriptions and display names appear in the Business Overview web part when the user applies the period filter.
Developing reports with Report Builder
Report Builder is a report development tool that was created with the user in mind. (By contrast, Visual Studio tools for creating reports focus on the developer.) Report Builder features a ribbon that is similar to the one in Office programs and that should be familiar to users.
Report Builder 3.0, which was released around the same time as SQL Server 2008 R2, requires SQL Server 2008 R2 or a later version. A new version of Report Builder is included with SQL Server 2012. For an overview of the capabilities of Report Builder, see “Getting Started with Report Builder” at http://technet.microsoft.com/en-us/library/dd220460(SQL.110).aspx.
Earlier versions of Microsoft Dynamics AX provided the capability to generate report models (.smdl files) that could be used to generate reports with Report Builder 1.0. These .smdl models were based on a set of views, called secure views, that were generated on top of the AX OLTP database.
AX 2012 no longer generates report models for ad hoc reporting with Report Builder because Report Builder provides excellent capabilities for creating reports with prebuilt cubes. Also, AX 2012 cubes provide a good source of aggregate data. For step-by-step instructions about how to use Report Builder with OLAP data, see “Create a report by using SQL Server Report Builder to connect to a cube” at http://msdn.microsoft.com/en-us/library/gg731902.aspx.
Developing reports with the Visual Studio tools for AX 2012
Reports developed by using Report Builder are ideal for scenarios in which users require the capability to create reports for their own consumption or for sharing within a group. However, if you want to create an analytic report for broader consumption within the entire organization, you might want to consider using Visual Studio tools.
Reports created with Report Builder have the following drawbacks when used across the organization:
![]() They are developed in only one language. These reports cannot use AX 2012 labels, and they cannot be rendered in other languages.
They are developed in only one language. These reports cannot use AX 2012 labels, and they cannot be rendered in other languages.
![]() They do not react to the AX 2012 security model.
They do not react to the AX 2012 security model.
![]() They lack debugging capabilities.
They lack debugging capabilities.
![]() They mix datasets from multiple data sources, such as Report Data Providers (RDPs).
They mix datasets from multiple data sources, such as Report Data Providers (RDPs).
Most of the Role Center reports that extract aggregate data are sourced with analytic datasets.
Developing an analytic report is no different from developing a standard AX 2012 report by using Visual Studio tools. You define a report dataset and then create a report design to consume the data. For more information about creating a report, see Chapter 9 in this book and “Walkthrough: Displaying Cube Data in a Report” at http://msdn.microsoft.com/en-us/library/dd252605.aspx.
The remainder of this section examines the salient features of an existing report that consumes analytic data. If you open the AR Administrator Role Center, you will notice the Top Customers by YTD Sales report. Start Visual Studio 2010 (the AX 2012 Visual Studio reporting tools must be installed).
1. In Application Explorer, right-click the CustTopCustomersbyYTDSales report, and then click Edit.
2. Expand the Data Sets node, and then expand the TopCustomersYTDSales dataset.
The report model opens, as shown in Figure 10-35.
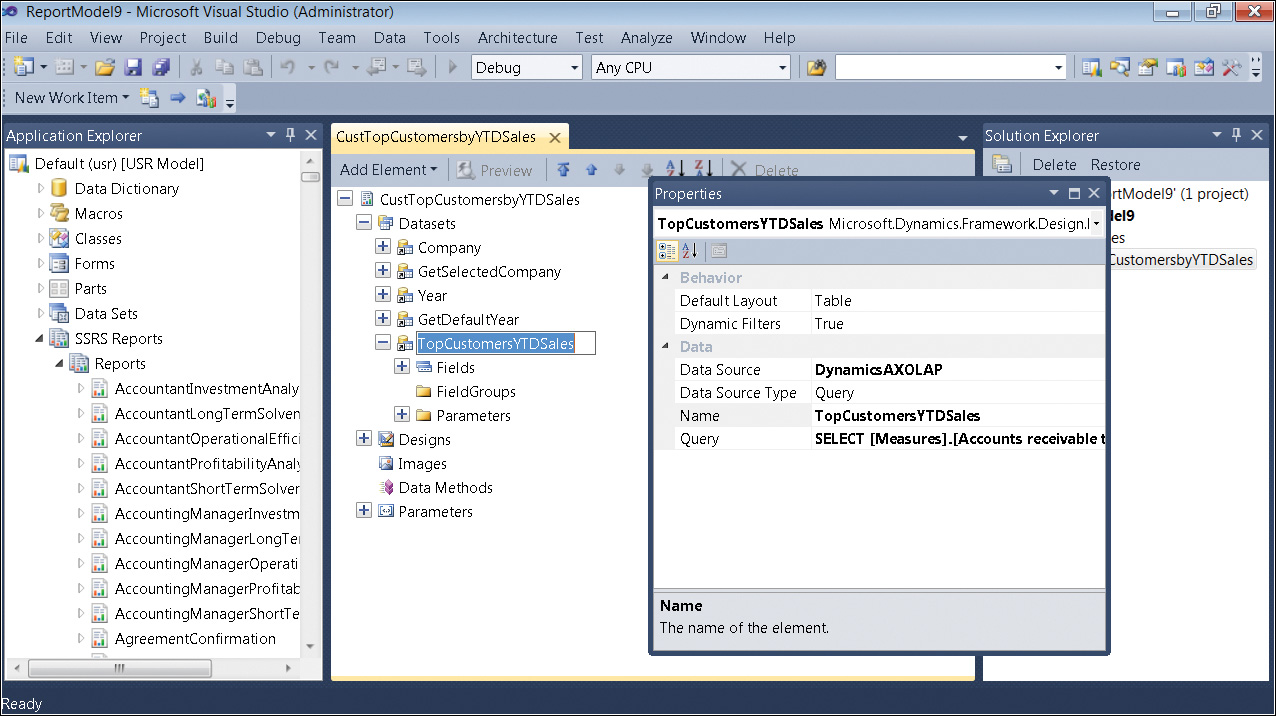
The Query property displays the MDX query that was used to retrieve the data. You can click the ellipsis button to open a window where you can modify the MDX query. You can also execute the MDX query from this dialog box (see Figure 10-36).
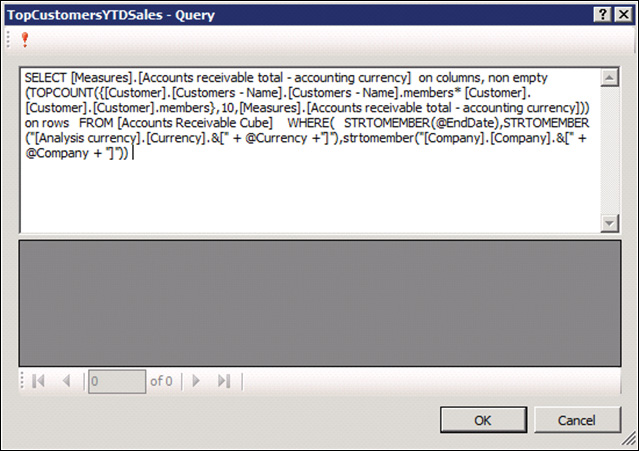
![]() Note
Note
When you create an analytic report, unless you are an MDX expert, you will probably want to develop the MDX query by using an MDX editor, and then paste it into the Query dialog box.
Notice that the data source is DynamicsAXOLAP, which indicates that the data is sourced from the prebuilt BI solution. To find out which database the data source points to, examine the properties of the Report Datasources node in the AOT, as shown in Figure 10-37.
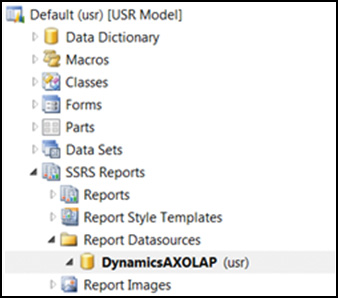
DynamicsAXOLAP points to the default cubes. This data source is deployed to the SSRS server as a report data source when the report is deployed. If the report was deployed from a development environment, the report points to the development instance of cubes. If the report was deployed from a test instance, it points to the corresponding cube instance.
To examine the properties of the data connection that is deployed to SSRS, locate the DynamicsAXOLAP connection file in SSRS Report Manager, and then open the file. You will see details about the data connection, as shown in Figure 10-38. In an AX 2012 R2 or later environment with multiple partitions, the framework resolves the connections at run time.
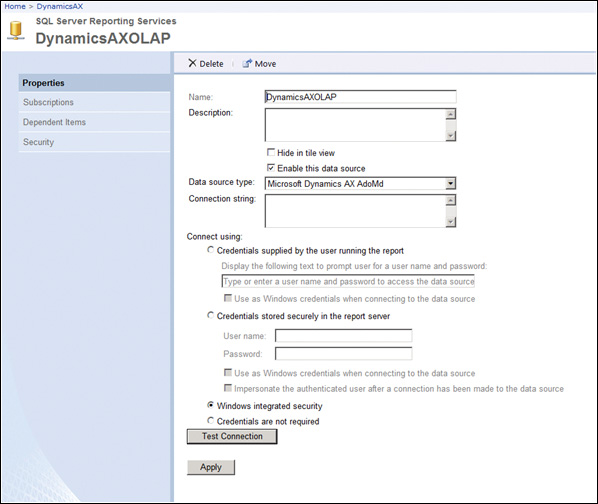
Notice that AX 2012 has its own data extension for accessing the cubes that are included with AX 2012.
The “Adding a KPI to the KPI List web part” section earlier in this chapter described how to switch the OLAP database so that the KPI List web part points to a nondefault OLAP database. In that case, you were able to change the SSAS server and the database that were designated as the default. One important point to remember is that changing the default SSAS database in the Analysis Servers form does not automatically change the default destination of the DynamicsAXOLAP data source that is used for reports.
You can change the data connection by using the following Windows PowerShell command:
Set-AXReportDataSource -DataSourceName DynamicsAXOLAP -ConnectionString
"Provider=MSOLAP.4;Integrated Security=SSPI;Persist Security Info=True;Data
Source=[SSASServerName];Initial Catalog=[DatabaseName]"
You can also change the connection string in the data connection deployed to the SSRS server by modifying the properties. However, keep in mind that each time you deploy a report, it will be overwritten with the data source connection in the AOT.
If you want to create analytic reports that point to a nondefault cube database (for example, a cube database that you create by using the OLAP framework), you must create your own report data source in the AOT. You can use the same Windows PowerShell command that you use to change the data connection. In this case, however, you should provide a new data source name. For more information, see “Set-AXReportDataSource” at http://technet.microsoft.com/EN-US/library/hh580547.