Chapter 5. Getting data from services and content packs
Working on the forecast for the next year, David realizes that it would be useful to consider the statistics for the pages visited on the company website. Using these insights, he might anticipate which products will gain more traction in the upcoming months.
Microsoft Power BI provides many connectors and content packs that make it possible for David to easily access the data generated from different cloud services. Content packs are also a useful tool to deploy and share predefined models and reports within a company.
In this chapter, you will see how David imports data from Google Analytics into Power BI, using different techniques. You can use these same techniques to access many web services, the list of which is growing rapidly, week by week.
In the following examples in this chapter, we will show data gathered by using Google Analytics from the website www.daxformatter.com, which we created to help users format DAX expressions and queries. We will use this data as part of the scenario we create for David. Our assumption is that the data would make sense in the sales generated by Contoso, too. But, also, we would not have enough data to show if we created a fictitious website for these examples. For this reason, when you continue reading, assume that visitors from this website are meaningful for sales of Contoso products, even if we know this is not true. If you want to replicate the same example, you can use Google Analytics data for a website to which you have access.
Consuming a service content pack
David wants to analyze data regarding customer visits to the website in an effort to glean some early indicators of a potential growth in certain countries/regions. If the number of visitors to the website increases in certain countries/regions, there also could be a growth in sales for the same country/region. Looking at this information for the previous two years might help in the budgeting process by providing data that will help David define the sales target for each country/region. Comparing website visitors and sales by origin in the same report is an important step in the analysis that he wants to accomplish.
David knows that his company’s website is monitored by Google Analytics, and he wonders whether Power BI supports it. Reading the Power BI documentation, he finds that Google Analytics is indeed supported as a service content pack in the Power BI service, and as a connector in Power BI Desktop. With that, he begins using the service content pack in the Power BI service.
David starts Power BI and then, in the lower left corner of the window, he clicks the Get button. He is then greeted by the Get Data page, as depicted in Figure 5-1.

When you load data from a service, Power BI automatically creates for you a data source, a report, and a dashboard connected to that service, using predefined templates for each of these elements. You can modify these objects later if you want. Obviously, Power BI will use your credentials to access the service. Thus, even if the report is the same, the numbers will represent your own data.
David wants to use a content pack for a service; so, in the Content Pack Library section of the Get Data page, on the Services tile, he clicks the Get button. This displays a list of the services that are available, as shown in Figure 5-2.

He clicks the Google Analytics tile and sees a message containing a description of the service, as illustrated in Figure 5-3.

Note
For all available services, Power BI presents a similar description along with a Connect button. However, the steps that follow after you click Connect might differ from those for Google Analytics, depending on the security model and the implementation of the authentication of the user for the selected process. So, keep in mind that if you select another service, the experience might be altogether different from what we describe in this chapter.
David clicks Connect and is then prompted to choose the authentication method to use to connect to Google Analytics. The only choice available to him is oAuth2, as depicted in Figure 5-4.

Be aware that after you click Sign In, you might be requested to sign in to Google Analytics (see Figure 5-5), unless your credentials are already stored because of previous access.

When David completes the sign-in, he is asked to provide offline access to the Power BI application, as shown in Figure 5-6. To authorize Power BI to retrieve data from the Google Analytics service on his behalf, he clicks Allow.

Note
By allowing “offline access” you are indicating that you want to allow the Power BI Desktop application to interact with Google Analytics even when you are not interacting with the Google Analytics service directly. For example, when you navigate in the data offered by Google Analytics in a web browser, you are engaging in an “online access,” because you directly interact with the service. However, when Power BI Desktop requests data from Google Analytics, it will act on your behalf, and you will not see the details of every request. This is true not only when you use Power BI Desktop interactively, but also whenever you schedule an automatic refresh of the dataset in Power BI.
On the next page of the Connect To Google Analytics dialog box, David can choose which part of the data available in Google Analytics that he wants to bring into the content pack. There are three options (see Figure 5-7):
• Account The account name for Google Analytics (a single user might have access rights to multiple accounts). Select from the list of available account names for the current user.
• Property The name of the property (which is a Google Analytics concept) within the data owned by the selected account.
• View The view name within the property. Oftentimes, the view corresponds to the property, unless you handle multiple websites within the same account.

Note
In our example, for the DAX Formatter property, the View option is unavailable because there is only one view from which to choose.
When David clicks Import, the Power BI service copies the content library into the currently selected workspace, and then it updates the connection with the information provided in the previous steps. Finally, it populates the workspace with data read from the Google Analytics service. As a result, he obtains one dashboard, one report, and one dataset named Google Analytics, which he can rename if necessary (you should do that in case you import multiple copies of the same content pack in the same workspace—in this case, they would look the same, but they would contain different data).
The Google Analytics dashboard includes information about the traffic received in the past 30 days, as demonstrated in Figure 5-8.

Let’s take a moment to discuss this dashboard. If you click one of the dashboard’s visualizations, you are moved to the underlying data in a corresponding report. All of the visualizations come from the same report, which has pages that filter the data from the past 30 days (such as Total Users), the past 90 days (such as Site Traffic), or the past 180 days (such as System Usage, Page Performance, and Top Pages). Figure 5-9 presents the System Usage page for David’s report.

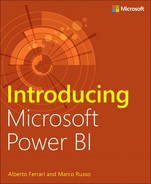
Back to David; he can now edit the report created by the content pack, or he can create a new report based on the same dataset used by the existing report. In both cases, one of the issues is that the dataset provided in this content pack does not include all the possible measures and slicers available in the Google Analytics server. Also the available historical depth is limited to a maximum of 180 days. Figure 5-10 demonstrates that the number of tables, attributes, and measures available is just a fraction of the measures available in Google Analytics.
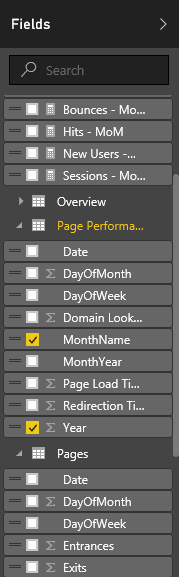
Figure 5-10: The tables, attributes, and measures available in the dataset of the Google Analytics content pack.
The reason for this is that the engineers who created this content pack tried to include the minimum amount of information required to create the desired reports. In this way, the size of the resulting Power BI file (.pbix) is kept to a minimum, improving the performance of many related operations. However, the level of details available might not satisfy your requirements, depending on what you are trying to accomplish.
The Google Analytics content pack has been useful for an initial overview of the data available, but it does not meet David’s requirements. First, he needs greater historical depth to analyze the trends, and the limit of 180 days provided in the content pack is not sufficient for his requirements. Second, he would like to create a single report showing the relationship between data from Google Analytics and other data, such as past sales and forecast. This requires a single dataset with multiple connections, so getting data from the Google Analytics content pack is not very helpful, because you cannot change or customize the data model of a dataset copied from a content pack, whereas you can customize the reports and dashboard imported from a content pack.
For these reasons, David will create a new dataset using only the connection to Google Analytics in Power BI Desktop, without relying on the content pack he has used thus far.
Creating a custom dataset from a service
David wants to show in the same report some measures from Google Analytics related only to China, Germany, and the United States, which are the countries/regions interested in the budget process. He wants a better result than the one he can obtain by using the Google Analytics content pack on Power BI. Also, he needs greater historical depth than what is available through the service he tried earlier.
Instead of using the predefined (and read-only) content pack, David will use Power BI Desktop to connect to Google Analytics, and then include the Google dataset in the budget model he is developing. Of course, this requires some more effort, but it provides him with the advantage of flexibility in the definition of measures, calculations, new tables, and relationships in the data model.
Thus, David begins with the model he created by using Power BI Desktop in Chapter 4, which, to refresh your memory, has one table that contains the sales and budget in different columns. Such a table will be useful to analyze historical trends in sales. However, to import other tables from Google Analytics, he needs to use a special connector that imports data from Google Analytics directly into the model of Power BI Desktop.
David starts Power BI Desktop. On the ribbon, on the Home tab, he clicks Get Data and then selects the More option. In the Get Data dialog box that opens, in the pane on the left, he clicks the Other category, and then, in the pane on the right, he clicks Google Analytics, as shown in Figure 5-11.

When he clicks the Connect button, he is asked to sign in to his Google Account (Figure 5-12) so that Power BI Desktop will be able to access information in Google Analytics to which his Google Account has permission.

Figure 5-12: Connecting to Google Analytics from Power BI Desktop requires that you sign in to a related Google Account.
Note
You might see the Connecting To A Third-Party Service message box, warning you that the features, updates, and availability change often. Click Continue to close the message and move on to the next step.
When you sign in for the first time, you must provide your user name and password. (The sign-in process might use 2-factor authentication if required.) After you complete the sign-in process, you can click the Connect button to move forward.
When David completes the sign-in process, he then needs to select the attributes and the measures to import in the data model. The Navigator dialog box provides a list of all the services monitored by the Google Account that he is using. After he selects the service, he is presented with a list of folders containing attributes and measures that he can select and import. The attributes are information collected by Google Analytics, such as date-related columns (year, month, day, etc.), demographic and geographical information about the visitors (such as age, gender, country/region, and city), and many other pieces of information that can be used to group and filter data. The measures are numeric information describing the frequency or the size of an event; for example, the number of users, the number of visits, the average time to load a page, and so on.
Querying a service such as Google Analytics is similar to querying a data model by using a pivot table. You select certain attributes, and measures are automatically aggregated at the granularity defined by the attributes included within the same report. For example, Figure 5-13 depicts the preview of the result obtained by selecting the Country/Region attribute from the Geo Network folder, the Year attribute from the Time folder, the Sessions measure from the Session folder, and the New Users and Users measures from the User folder.

Figure 5-13: Connecting to Google Analytics, you select the measures and the attributes to import in the data model.
In Power BI Desktop, on the Home tab, David clicks Edit Queries to open the Query Editor window. Because David wants to analyze a limited number of countries/regions, he needs to apply a filter in Query Editor to the Country/Region column, restricting the selection to China, Germany, and the United States. This obtains the result illustrated in Figure 5-14.

Also note in Figure 5-14 that the ribbon includes a special tab: Cube Tools | Manage. The name “cube” references an external rich semantic model, and as we said earlier, it is the same approach available for Analysis Services and SAP Hana. When you click Add Items, you can select additional attributes and measures that will modify the query made to Google Analytics, enhancing the granularity (with attributes) or more information (with measures). Figure 5-15 depicts the different graphical representation of attributes (in the Audience folder) and measures (in the DoubleClick Campaign Manager folder).

Figure 5-15: The Add Items dialog box in which you can add measures and attributes from a Google Analytics connection.
Note
You should use the Collapse Columns button whenever you want to remove an attribute and obtain a corresponding granularity without the attribute you removed. If you just remove an attribute by removing the corresponding column in Query Editor, you do not modify the original query, and the cardinality will still include the attribute you removed. A detailed tutorial about how to use Query Editor with each data source is beyond the scope of this book, but you should be aware of this important difference compared to other types of data sources.
After David confirms the items to import, Power BI Desktop sends the query to Google Analytics and imports the result in a new table, as shown in Figure 5-16, in which you can see the content of the table named Website, containing the results of the query to Google Analytics defined so far.

Note
For the purposes of this scenario, our intrepid budgeting manager, David, does not create relationships between the table with data from Google Analytics and the other table in the same data model. However, it is common to create relationships between tables in order to simplify data navigation. You will see more complex data models in Chapter 6.
The key metric that David wants to obtain is the growth in new users that each country/region experienced in 2015. The data available in the Google Analytics service content pack did not have the historical depth required for this analysis; David requires data for both 2014 and 2015. The data imported in Power BI Desktop does not have such a limitation, so it is possible to import such historical depth. However, to create the calculation of the growth percentage, David has to learn the language used by Power BI, which is called DAX.
DAX, which stands for Data Analysis Expressions, was introduced in Power Pivot for Excel in 2010 and is based on the Excel formula language. If you have experience with Excel, you will find many functions that have the same name and syntax as those in your favorite spreadsheet. But, there are also several new concepts and functions that would require a separate book to cover fully. Fortunately, these books exist, such as The Definitive Guide to DAX, published by Microsoft Press. You will find a very basic discussion about DAX “measures” (the DAX term used to refer to scripts) in Chapter 6 of this book.
Because David used Power Pivot for Excel in the past, he already knows how to write the measure he needs. So, on the ribbon, on the Home tab, he clicks New Measure and inserts the following DAX measure in the formula bar:
New Users Growth =
IF (
HASONEVALUE ( Website[Year] ),
DIVIDE (
SUM ( Website[New Users] ),
CALCULATE (
SUM ( Website[New Users] ),
Website[Year] = VALUES ( Website[Year] ) - 1
)
)
)
Then, he displays this measure in a separate visualization, under the New Users metric, grouped by country/region and year, as illustrated in Figure 5-17.

Figure 5-17: Two visualizations displaying the New Users measure and its growth, using data from Google Analytics.
At this point, David has the data he needed from Google Analytics, and he can consolidate that in a single report, together with data coming from other data sources. Chapter 4 shows you how to load data from different data sources, and Chapter 6 shows you how you can combine this data in a single model by using the DAX language. This helps to improve the browsing experience by providing a unique filter for each entity (such as the Country/Region in this report) instead of having similar columns in different tables that filter only the specific table to which they belong.
David can now publish the report he created in Power BI Desktop by using Power BI. By doing that, he is able to pin report content to a dashboard. Figure 5-18 depicts a dashboard built by pinning the two visualizations of the report he created. At this point, David has a dashboard and a report published on Power BI that are based on a custom dataset he created in Power BI Desktop, which gets a particular selection of data from Google Analytics.

Creating a content pack for your organization
After David created a report in Power BI Desktop using the Google Analytics connector, he wants to share the result of his work with other colleagues in the company, and he wonders what the best tool is in Power BI to do that.
David realizes that the report he created would be a good starting point for deeper insights created by his colleagues. By using the share feature, he is able to share only a dashboard and its underlying reports, but he would like to publish the report based on Google Analytics as a template for reports created by other colleagues. The sharing options you have seen so far do not satisfy David’s requirements. He wants other users to be able to customize the reports he made and create new reports based on his work. Sharing a dashboard does not provide such flexibility. Using the group workspace, there would be a single copy of reports and dashboards shared among the group’s users, which would not be visible to users who are external to the group. However, David wants to share the results of analysis based on Google Analytics with other users outside the budgeting group. Thus, sharing a dashboard and creating a group workspace are not viable options.
The content pack for an organization is a good solution for David’s requirements. This content pack can contain datasets, reports, and dashboards. Users receive a copy of these objects that are automatically synchronized in case a new version of the same content pack is published. If users customize one of these objects, they will work on their own copy of the reports, which will no longer be synchronized with the original one.
To create a content pack, in the upper-right corner, click the Settings button (the small gear icon), and then, on the menu that opens, select Create Content Pack, as shown in Figure 5-19.

The Create Content Pack dialog box opens (see Figure 5-20). Here, David provides data about the new content pack. He can choose whether the content pack should be visible to any user in the organization or just to users belonging to specific groups. In this case, David selects the My Entire Organization option. He defines a title for the content pack (Sales And Website 2015, in this example) and a description of its content.
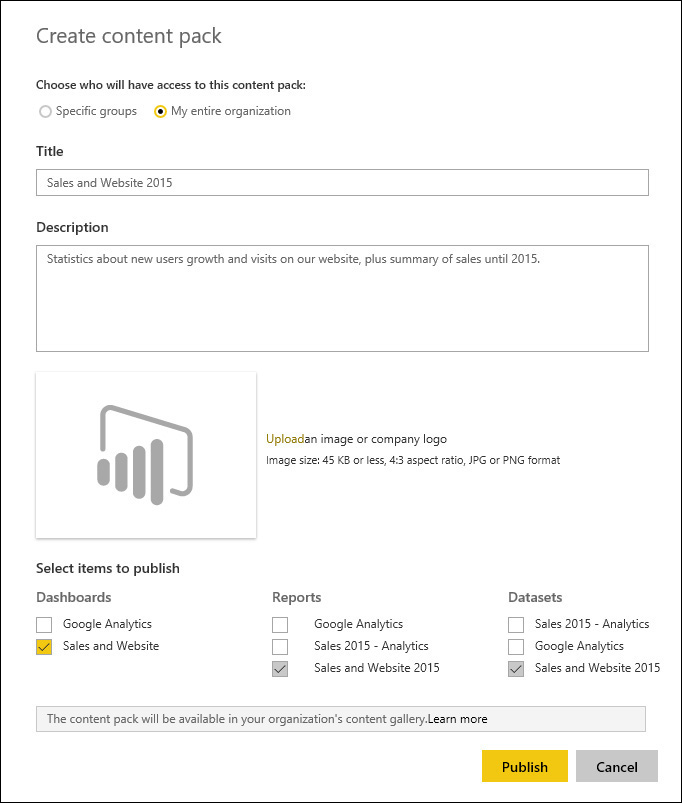
Figure 5-20: The Create Content Pack dialog box requires you to select objects to publish in a new content pack.
It is important to provide a clear description because this is what other users will read before importing a content pack in their own workspace. It is also possible to customize the content pack by using a specific image, which could be just the company logo or a more customized graphic. Selecting an image is optional; if you do not do that, a default one will be used, instead.
The more important part of the Create Content Pack dialog box is the area where you select the item to publish. There are three lists for of all the dashboards, reports, and the datasets you have in your personal workspace. You can select any number of the available entities, even if there are a few constraints. If you select a dashboard, all of the reports and datasets used in the visualizations of that dashboard will be automatically included, too. For example, in Figure 5-20 you can see that the dashboard Sales And Website is selected, and because of that, the report and the dataset named Sales And Website 2015 are automatically selected, as well. You cannot remove the selection of a dataset or a report if it is used in a dashboard. The same is true when you select a report: the underlying dataset is automatically selected, too.
When you click the Publish button, the content pack is published and displayed in the list of the content packs that you can obtain by selecting the View Content Pack item in the Settings menu (refer to Figure 5-19).
Figure 5-21 presents David’s list of content packs.

From this list, David can edit or delete each content pack. If he were to select Edit, he would return to the same configuration window shown in Figure 5-20; however, this time the window would be titled Update Content Pack instead of Create Content Pack.
At this point, other users in his organization are able to consume the content pack that David created. In the next section, you will see how this works and what the difference is between consuming an existing content pack as is and creating a personal copy that can be modified.
Consuming an organizational content pack
In this section, you will see how Wendy can use the content pack that David created.
When she clicks Get Data, Power BI opens the familiar Get Data page, shown in Figure 5-22.

In the Content Pack Library section in Figure 5-22, Wendy clicks Get on the My Organization tile. This opens the list of content packs she can use, along with a tile to create a new content pack, as demonstrated in Figure 5-23. In this scenario, the only content pack available to Wendy is the one David published, Sales And Website 2015.

Wendy clicks the Sales And Website 2015 tile and then sees the information that David previously included when he published the content pack (refer back to Figure 5-20). This information includes a description of the content pack, the name of its publisher, and the time since it was last published, as shown in Figure 5-24.

When Wendy clicks the Connect button, Power BI imports into her personal workspace the entities included in the content pack. She will find a new dashboard (Sales And Website) has been added to the left pane, as well as a new report and a new dataset (both named Sales And Website 2015), as illustrated in Figure 5-25.

Wendy can navigate in the dashboards and in the reports in view mode without any issue. If the content pack were to be updated by David, the new version of datasets, reports, and dashboards included in the content pack would automatically replace those available to Wendy. However, if She tries to pin something more in the Sales And Website dashboard, or edit the report Sales And Website 2015, or if she clicks on the Sales and Website 2015 dataset to create a new report based on such a dataset, a message will appear (Figure 5-26), asking if she wants to personalize the content pack.

The same option is also available as the Personalize button when she clicks the option of a dashboard, report, or dataset that she obtained from a content pack, as demonstrated in Figure 5-27. These options also include the ability to remove or to open the object.

If Wendy removes any object belonging to a content pack, all of the other entities from the same content pack are removed, as well. If she proceeds with the personalization and clicks Save in response to the message shown in Figure 5-26, she creates a copy of the objects in the content pack, and she is able to modify or delete them as she pleases.
In other words, if Wendy does not create a personal copy of the content pack, she will automatically receive any update to that same content pack that David publishes. If she creates a personal copy, any future updates by David will not propagate to her workspace. She will be able to modify the dashboards and the reports in her personal copy of the content pack; however, she will not be able to modify the dataset, because a dataset obtained from a content pack is always a shared dataset, and only the package owner can modify and refresh its content.
To recap, we have this following possible behavior for each object type:
• Dashboards and Reports These can be shared from the content pack, or they can be copied from the content pack in a personal copy. All of the dashboards and reports of a content pack are copied to the personal workspace if the user wants a personal copy of the content pack, but those dashboards and reports no longer receive updates from the content pack publisher.
• Datasets These are always owned by the content pack publisher, who is the only person who can schedule refresh operations and change other definitions in the dataset.
Updating an organizational content pack
David is the owner of the content pack named Sales And Website 2015. The moment he publishes the content pack on the Power BI service, any ensuing changes to any object included in the content pack on the Power BI service will generate a special notification. For example, if David changes the dashboard by moving the visualizations to different positions, he receives the warning message depicted in Figure 5-28.

Figure 5-28: A warning message after changes are made to an object included in a published content pack.
Note
If you edit and then publish a content pack for a data model created with Power BI Desktop, subsequent changes made to the local data model (the .pbix file) do not automatically propagate to the Power BI service and to the published content pack. You do not receive any update in Power BI Desktop. It is up to you to remember that you must publish the .pbix file on the Power BI service to update the data model in the cloud.
If David clicks View Content Packs, in the list of the content packs he published, he sees which ones are affected by one or more changes he made to the reports and dashboards. Figure 5-29 shows that the only content pack he published, named Sales And Website 2015, displays a warning icon next to the name. When David points to the icon, he can see the content of the warning message, specifying that the content pack must be updated in order to show the changes to other users.
In practice, any changes made to objects that are a part of a content pack are not automatically published in a new version of the content pack until the owner specifically performs such an update. When David clicks the Edit action, he can publish a new version of the content pack, which will include the current version of the objects (dashboards, reports, and datasets), replacing the version previously published with the same name. Figure 5-30 shows that the Update Content Pack dialog box is identical to that of Create Content Pack, the only difference being that the Publish button is now labeled Update.

Figure 5-30: The Update Content Pack dialog box is the same as the Create Content Pack dialog box, except the Publish button is now labeled Update.
When David clicks Update, he generates a new version of the content pack that overrides the previous one. This action automatically updates all of the objects within the content pack in all the workspaces of any users who have consumed the same content pack without any customizations. This type of consumption of a content pack corresponds to the share feature of a dashboard, which provides a read-only copy of the dashboard that other users can see but not modify. However, using the content pack, this capability is extended to reports and datasets, which can be a part of a content pack regardless of whether they’re used in a dashboard.
If a user who consumed the content pack created her own copy of it, a warning message will display in her workspace, notifying her that a new version of the content pack is available, but that is all that will happen, because changes in the consumed content pack are no longer automatically published to the corresponding entities in her content pack. For example, earlier we saw that Wendy created her own copy of the content pack, so when David publishes the new version of the content pack, she does not see any changes applied to the Sales And Website dashboard. However, because she still uses some objects that were originally created from a content pack that now has been updated, she receives the message shown in Figure 5-31 in her Power BI window.

Figure 5-31: The warning message when there is an update to a content pack that has been copied to a personal copy.
Knowing that a new version of the content pack is available, Wendy can decide whether to get data from the same content pack again. If she decides to do so, a new copy of all the objects will be imported into her workspace. Because these objects will have the same name as the ones she previously copied, it would be a good idea to rename objects imported from a content pack when you decide to create your own personal copy; this way, you would not confuse them with the original copy in case you import the same content pack again in the future.
Conclusions
In this chapter, you learned how to consume and create content packs in Power BI. There are different types of content packs, each one with different behaviors available to the user. Moreover, you have also seen that you can create custom datasets from a service when the corresponding service content pack does not provide the data model that you need.
Here are the most important features you learned:
• A content pack contains a set of dashboards, reports, and datasets that a Power BI user can quickly import into his own personal workspace. He can also customize dashboards and reports imported from a content pack, but not a dataset.
• Content packs are available in the Power BI service only.
• A service content pack is published by Microsoft that you can use to connect to a service importing data that populates a set of predefined dashboards and reports. You must provide the credentials required to connect to the service from which you want to extract data.
• You can create a custom dataset in Power BI Desktop only, using a connector corresponding to the service content pack that you cannot customize. Be aware that not all service packs have a corresponding connector in Power BI Desktop, but there are several (such as Google Analytics) that have both.
• Any user can publish an organizational content pack. These contain predefined connections to data sources that cannot be changed by the user who consumes a content pack; only the content pack publisher can modify those connections.
• A user can consume an organizational content pack by just reading its content or by creating a personal copy that she then can modify.
• An organizational content pack publisher can update data. Such changes are automatically propagated to users who consume the content pack in a read-only mode.
Content packs are an important tool to quickly create a set of predefined reports and dashboards based on data coming from an existing external service, or from a dataset created within the organization.