
Chapter 2. Sharing the dashboard
In Chapter 1, David, our manager of budgeting at Contoso, created his first dashboard with analysis of sales. But that dashboard is only the starting point for creating the budget for 2016. David will involve his colleagues in this process, so the first thing he needs to do is share the work he has done thus far with these colleagues. After that, he must collect feedback and numbers from other managers in order to complete the entire budget. Also, he needs to choose how to share the resulting data and reports between members of the team.
In this chapter, you will see how David can use the features of Microsoft Power BI, along with other services, to achieve his goals.
Inviting a user to see a dashboard
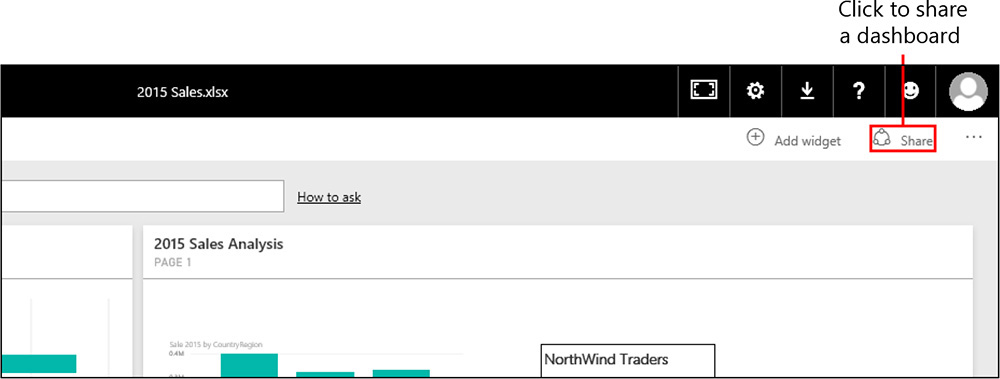
David wants to share the dashboard he created with his colleague Wendy, the country/region manager for Germany. To do that, he opens the dashboard in its own Power BI account and then clicks the Share button located in the dashboard’s upper-right corner (see Figure 2-1).
This opens the Share Dashboard dialog box in which David can send Wendy an invitation. Before we continue along with David, let’s take a closer look at this dialog box. The Share Dashboard dialog box has two tabs: Invite and Shared With. The Invite tab (see Figure 2-2) is where you provide the email address (or addresses) of the people with whom you want to share a dashboard. You also can include an optional message that you would like your invitees to receive from the Power BI service. At the bottom of the tab are the Allow Recipients To Share Your Dashboard check box and the Send Email Notification To Recipients check box, which are self-explanatory. If you decide to send an email as a notification to recipients, Power BI will automatically include a link to open the dashboard in the email that is sent.
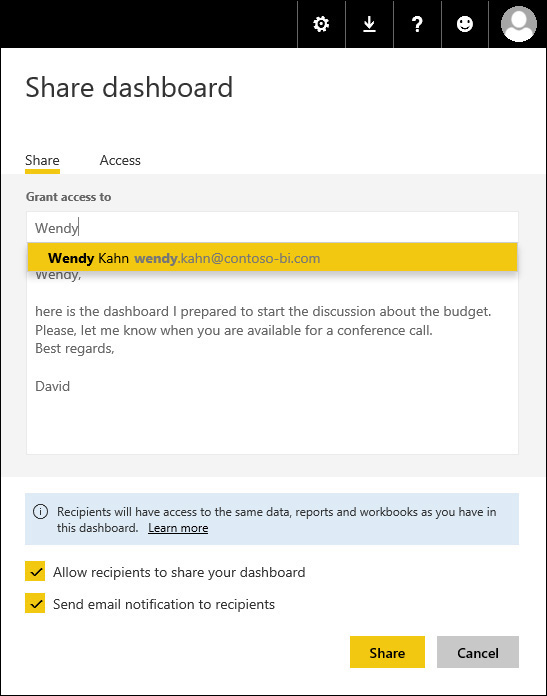
Figure 2-2: In the Share Dashboard dialog box, you specify the list of people invited and, optionally, include a message for them.
Notice in Figure 2-2 that when David types Wendy’s name in the name box, Power BI suggests her email address. Because Wendy is a coworker in the same organization as David, Power BI is able to offer these suggestions (more details on this later). However, you also can type an email address in this box if the email address of the person with whom you are sharing does not have the same domain name as your address (for more details about this, read the section “Inviting users outside your organization,” later in this chapter). You can add more than one person if required.
If you clear the Send Email Notification To Recipients check box (see Figure 2-3), you will need to go on the Shared With tab to copy the link to your dashboard that you will then send to recipients after you click the Share button. The email addresses you provide will give those accounts access to your dashboard, but those individuals will not receive an email notification.

Figure 2-3: You can share a dashboard by copying a link instead of sending an email from the Power BI service.
On the Access tab (see Figure 2-4), the Dashboard Link box contains the URL for the dashboard. If you choose to not send a message via the Power BI service to your recipients or you simply prefer to use your own email account to do so, you will need to copy this URL and send it to your invitees. Using your own account can be helpful when you want to ensure that your recipients recognize that the incoming email is from you, as opposed to seeing “[email protected],” which they, or their email client, might filter out as spam. Also on the Access tab is a list of users with whom you have shared the dashboard, along with their assigned privileges.

Figure 2-4: The Access tab shows the users who have access to the dashboard and provides a link to share it.
The email message that Wendy receives looks similar to that shown in Figure 2-5. If she has not previously used Power BI, when she clicks the link to open 2015 Sales.xlsx, she will be directed to the Power BI website where she will need to register with the service, just as David had to do when he first used Power BI (see Chapter 1 for a refresher on getting started with Power BI). If she is already enrolled as a Power BI user, she will go straight to the dashboard that David is sharing with her.

Now, Wendy is looking at the same dashboard as David, including the reports underlying the visualizations pinned to the dashboard. However, Wendy cannot modify either the dashboard layout itself or any of the single reports; at this point, she has read-only permission. For David to make it possible for other users to edit his dashboards and reports, he needs to create a group workspace, which we will cover a bit later in the chapter.
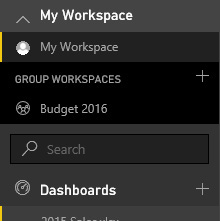
After David invites Wendy, she can open the dashboard in its own Power BI session. Dashboards shared by another user appear on a guest user’s Workspace pane with a “shared” icon adjacent to the dashboard name, as shown in Figure 2-6. This indicates that the dashboard is read-only. So in this case, Wendy cannot change or modify the content of 2015 Sales.xlsx, but she can interact with reports pinned to the dashboard and can open the reports underlying each visualization by simply clicking a visualization. Even if such reports are not listed in the workspace, Wendy can open them through the shared dashboard, but she cannot modify their content (the Edit Report feature is turned off in these cases).

Inviting users outside your organization
Thus far, David has invited Wendy to view his dashboard; she works in the same company and has an email with the same domain (@contoso-bi.com). But what happens when David wants to invite someone who is not part of the same company? Answering this question requires some explanation.
Although Power BI is designed for you to share a dashboard with users who are within the same organization, you can also share dashboards with people from other organizations. The way Power BI identifies “an organization” can be described as follows:
• Every user requires an email address within the domain of the company.
• Power BI does not accept generic email domains such as hotmail.com, gmail.com, and so on. Your company needs a unique domain name, and all of the users must have an email address within that domain. All of the users having an email within the same domain are considered part of the same organization.
• If you use Microsoft Office 365 and/or Microsoft Azure Active Directory, you might have different domains belonging to the same organization. This is the only case for which users having email with a different domain name belong to the same organization for Power BI.
Note
If you are not sure whether your organization already uses Office 365 and Azure Active Directory, ask your IT administrator, and if he would like to read more technical details about authentication in Power BI, refer him to the following documents:
https://powerbi.microsoft.com/documentation/powerbi-admin-power-bi-security and http://go.microsoft.com/fwlink/?LinkId=619090 (which downloads the Power BI Security white paper)
On the surface, that seems rather restrictive, but in reality, you also can share a dashboard with users in other organizations, using the same method as that described in the previous section. However, when you specify an email address with a domain other than that of your organization, you will see a message similar to one shown in Figure 2-7, which David receives when he tries to share a dashboard with a vendor.

Figure 2-7: The message that displays when you try to share a dashboard with someone outside of your organization.
It is important to understand the difference between a user within your organization (internal users) and outside of it (external users):
• Internal users You can invite internal users to share a dashboard by email or by sending them the URL of the dashboard. In the latter case, users must be authorized. If a user does not have authorization, she can ask for permission when she clicks the dashboard URL.
• External users You can share a dashboard with external users only by inviting them by email. When an external user receives the email, she must sign in to Power BI using the same email account used in the invitation. If she never previously used Power BI, she can create a free account the first time she signs in.
Finally, you can publish a report (but not a dashboard) on the web. To do so, select the report, click the File menu, and then click Publish To Web, as depicted in Figure 2-8. In the Embed In A Public Website (Preview) dialog box, click Create Embed Code. This creates a public webpage that anyone can visit. Keep in mind, though, that you cannot control who can see such a report, meaning anyone who has the URL can view your data. For this reason, you should use this technique only when you want to publish information intended for public consumption; for example, a report embedded in the public website of your company.

Figure 2-8: The File menu includes the Publish To Web command, which makes a report available on the Internet.
The Publish To Web feature guides you in creating a public webpage, getting a URL that you can send in an email, or the HTML code required to embed the report in a page of a website you own. For more technical information about publishing a report to the web and to get a detailed step-by-step guide, go to https://powerbi.microsoft.com/documentation/powerbi-service-publish-to-web/.
Creating a group workspace in Power BI
Let’s return to David and Wendy. After David invited Wendy, he realizes that he will need to repeat the same share operation for every dashboard he creates. Moreover, as soon as other people become involved in the budgeting process, he will need to send them the invitation for all of the dashboards he shares with the group. Fortunately, David discovers that he can create a group of users with whom he can automatically share all of his dashboards, and also provide editing rights to certain users within that group. By creating groups of users in Power BI, you increase the level of collaboration among them.
The only caveat is that you must have a Power BI Pro license to have access to the group feature; you cannot create groups by using the free version of Power BI. However, you can try Power BI Pro for 60 days free of charge, giving you an opportunity to evaluate this feature and determine whether it is good for your company.
Assuming that you—and David’s organization—opt to purchase a Power BI Pro license, to create a group, in the My Workspace pane, immediately below the list of workspaces, click the “+” button to the right of Create A Group, as demonstrated in Figure 2-9. (You might need to click My Workspace to open that pane.)

David clicks the “+” button, which opens the Create A Group dialog box in which he creates a group named Budget 2016. This group will initially include himself as administrator and Wendy as a member. In the Privacy section, shown in Figure 2-10, you can define the privacy levels of the group.

Figure 2-10: The group includes a list of members and privacy settings that group administrators can change later.
Every group has two privacy settings. The first determines whether the group is visible only to its members or also by other users within the organization who are not members of the group. Here are the possible choices:
• Private Only approved members can see the results of the group’s activities.
• Public Anyone can see what the group is doing.
The second setting specifies whether all the group members can modify the contents of reports and dashboards. There are two choices:
• Members can edit Power BI content.
• Members can only view Power BI content.
If you select view-only for this second setting, only group administrators can edit dashboards.
With David having configured the group as shown in Figure 2-10, Wendy will be able to edit the content of dashboards and reports included in the group. David and Wendy will see the public group in their list of group workspaces, as illustrated in Figure 2-11.
Now that David has created a group, he can create reports and dashboards in the group that will be immediately visible by Wendy. However, he must import the data for these reports in the same group; he cannot move into the group what he already created in his personal workspace. Importing data and creating the reports will require some time at this point, repeating the same operation he has already done. Thus, when you know you will work with a team, it is a good idea to create the group at the outset, and save yourself a lot of redundant work later on.
Turning on sharing with Microsoft OneDrive for Business
Before moving forward, David wonders whether he will be able to share the data sources, not just the results (reports and dashboards). In particular, he wants to allow other colleagues to enter their data in Microsoft Excel files, so that he will be able to create a budget using data from workbooks modified by a number of other people.
In Chapter 1, David was forced to copy the budget data from Excel files received by country/region managers, and then he split those values by month in the table used to feed his Power BI report. Now, he wants to give other users the ability to modify the content of that Excel file directly so that he does not need to do all that work himself. For this reason, David creates a single Budget table in another worksheet of the same Excel file and copies to it the budget values by Country/Region and Brand, as depicted in Figure 2-12.

David created a formula in the table used by Power BI that allocates the budget value over 12 months. At this point, David wants to share this workbook so that his colleagues will be able to directly modify the content of the budget table, and this should automatically apply the new values to reports and dashboards published in Power BI.
Using OneDrive for Business is the best way to share his source Excel workbook with other colleagues. You might already know OneDrive, which is the personal service with which you can store files in the cloud. But, even though you can share files on OneDrive, there are limitations when using it as a data source for Power BI, especially when it entails automatic data refresh. OneDrive for Business removes those limitations and provides more control, as well. Moreover, OneDrive for Business is integrated with Office 365 and directly supports groups, making it easier to share documents across your organization. To access OneDrive for Business, in the upper-left corner of the Power BI site, click the yellow button with the nine small squares in it (see Figure 2-13), and then click the OneDrive tile.

Figure 2-13: You can access OneDrive by clicking the button in the upper-left corner of the Power BI website and then clicking the OneDrive tile.
Note
OneDrive for Business is a feature included in Office 365. If you do not have an Office 365 plan, you can subscribe to OneDrive for Business separately, without activating Office 365. If you are interested in using this feature, contact your IT administrator to determine which licensing option better fits your requirements.
On the OneDrive webpage that opens, David uploads the workbook to the Budget 2016 group he previously created to share reports and dashboards. A group defined in Power BI corresponds to a group in Office 365, so you have an associated OneDrive for Business folder where you can place files to share. Figure 2-14 shows the sequence of steps that David needs to do to upload the document.

When David finishes uploading the file, he can see it in the list of the files of the Budget 2016 folder, as depicted in Figure 2-15. Also in the figure, there is a Sync button which you can use to get information about how to synchronize the folder with a local computer, so that you can edit the file in a local folder of your PC and automatically upload any update to the shared folder on OneDrive. Thus, all of the files available in this OneDrive folder can now be shared among members of the Budget 2016 group, and the files will be available as a possible data source for reports created in the corresponding Power BI workspace.

Figure 2-15: After upload, the “Sales 2015 and Budget 2016” file is available and listed in the Budget 2016 group folder.
David has now shared a file to the Budget 2016 group. Later, he will ask other group members to update their budget data themselves. Before doing that, David wants to prepare a report that will display the aggregated total of the budget for every country/region, comparing it with the sales made in previous years.
Going back to Power BI, David opens the list of workspaces available (refer to Figure 2-11) and selects Budget 2016. Power BI displays dashboards, reports, and datasets for that group. Of course, initially all of these lists are empty, as shown in Figure 2-16.

Figure 2-16: The initial list of dashboards, reports, and datasets is empty for a new workspace group.
David wants to create a dashboard and a report based on data stored in the Excel file that now resides in the group folder on OneDrive for Business. The approach is similar to what he did when he made his first foray into Power BI (see Chapter 1), but instead of uploading a file from his own local computer (Local File), this time David selects the OneDrive tile to specify his data source, as shown in Figure 2-17. Notice, though, that the name on the tile is “OneDrive – Budget 2016.” Because David is using the Budget 2016 workspace, the associated OneDrive folder is automatically proposed as a possible data source. From a Power BI perspective, the biggest difference between a local file (one stored on your computer) and a file on OneDrive (stored in the cloud) is that the former cannot automatically update a report based on it, whereas the latter can propagate changes to data to Power BI reports without user intervention.

After David selects OneDrive – Budget 2016, a message asks him to select the file to which he wants to connect to Power BI. There is only one file in this folder, so David clicks it and then clicks Connect, as shown in Figure 2-18. The file selected is highlighted in a different color so that it is recognizable when there are multiple files available.

After choosing the Excel file on OneDrive for Business, David must then decide how he wants to use that file. There are two options (see Figure 2-19): Import Excel Data Into Power BI, and Connect, Manage And View Excel In Power BI. If you want to use the Excel file just as a “raw” data source for your reports, select Import Excel Data Into Power BI. Or, you might prefer to copy an existing Excel file as is, using both the data model (if you have one in Power Pivot) and all of the Excel features, such as PivotTables, PivotCharts, and other visualizations available in Excel. If this is the case, choose the Connect, Manage And View Excel In Power BI option. You will see practical examples of this choice later in this book.

Figure 2-19: Click the Import button to bring in the content of an Excel file stored in OneDrive for Business.
David selects Import Excel Data Into Power BI by clicking the Import button in that section.
David now has a dataset available, named Sales 2015 And Budget 2016. The dataset contains two tables, Sales and Budget2016, because the Excel file imported has two worksheets with one table each. The Budget2016 table (refer to Figure 2-12) is the one that needs to be modified by other managers, inserting updated numbers for their individual budgets. The Sales table is still the same as it was in Chapter 1 (refer to Figure 1-29), in which David has updated only the Budget column using a formula that searches the corresponding value in the Budget2016 table and allocates it by month. Thus, when a manager updates a row in the Budget2016 table, Excel automatically updates the Sales table.
Using the new dataset, David creates a report by dragging available fields to the report’s central pane. The goal of this report is to show a quick recap of the overall budget divided by brand and country/region. For this reason, David chooses a matrix visualization in which he inserts fields from the Sales table (Brand on rows, CountryRegion on columns, and Budget on values, as shown in Figure 2-20). While doing this, he realizes that the two tables have identical fields, and this could be confusing. Because the budget is allocated in the Sales table, it would be nice to hide the Budget2016 table from the Fields list.

When you import an Excel file, all of the tables become part of the Power BI data model and are visible. Later on in the book, you will see how to control the Power BI data model in more detail. For the moment, David just wants to create a first report, and he knows that using the fields from the Sales table is the right choice because he can also create a clustered column chart, below the matrix, that compares the budget with the sales of previous years.
David saves the new report as Budget Totals and he also pins both visuals to a new dashboard with the same name. David already included Wendy in the group, so he sends her an email asking for a review and edit of budget numbers for Germany (Wendy is the country/region manager for Germany).
Wendy receives David’s email, signs in to Power BI, and sees the dashboard. She chooses the Budget 2016 workspace, which she can see because David added her as a member of the group. She opens OneDrive and clicks the Sales 2015 And Budget 2016 file name. Now, she can see the content of the workbook in her browser, and she chooses the Budget worksheet. Next, on the menu bar, Wendy clicks Edit Workbook and then clicks Edit In Excel Online to edit the file in her browser, as illustrated in Figure 2-21.

Note
It is worth remembering that Excel Online is available on many platforms. This means that Wendy can edit the workbook directly on her iPad.
Wendy corrects the budget for Germany for the A. Datum and Contoso brands (see Figure 2-22), because she knows that different marketing conditions and product lifecycles will affect the previous estimation.

Figure 2-22: The numbers entered in Excel Online are immediately stored, updating the underlying workbook in OneDrive.
Wendy wants to see whether the new values have been correctly allocated, so she clicks the Sales worksheet and sees that the new value (15,000) for the A. Datum brand in Germany is divided into 12 identical parts (1,250 each) for each month, as shown in Figure 2-23. She makes a mental note that such an allocation does not correctly represent the seasonality of certain products, so she will discuss this issue with David during the next meeting.

Now, Wendy goes back to the Budget Totals dashboard in Power BI and can see the updated data (see Figure 2-24) correctly represented in the matrix. She also can see that all of the other totals are updated, too. Wendy is pleased and feels confident that the reports built by David will be accurate.
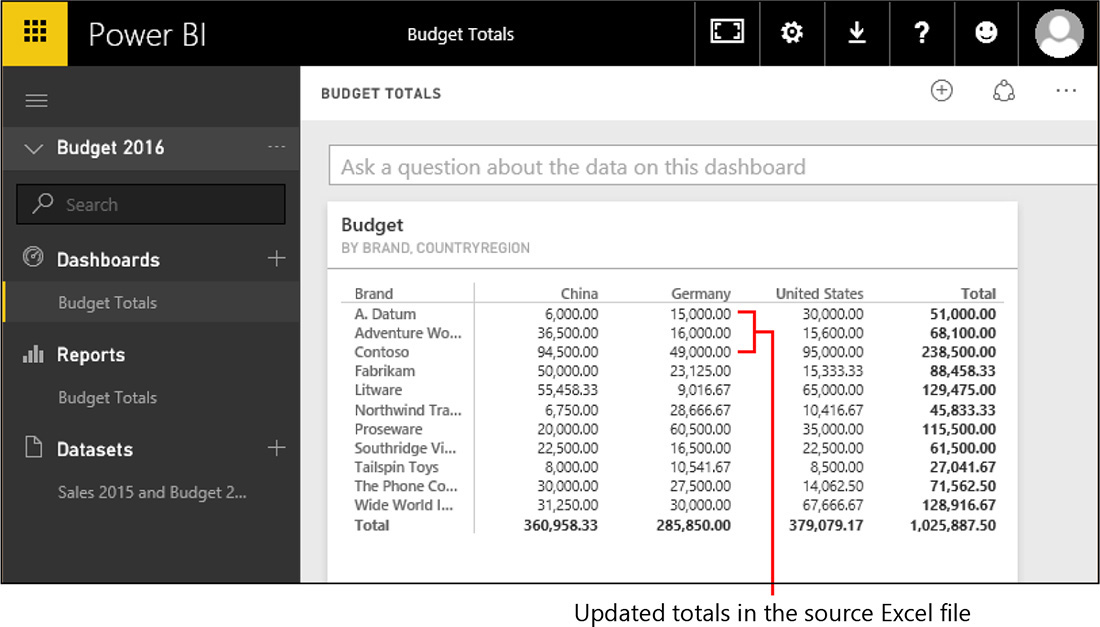
Figure 2-24: The dashboard in Power BI automatically updates numbers when someone modifies the underlying Excel workbook stored in OneDrive.
Note
The Power BI report and dashboard might exhibit some latency when displaying data that was updated in files residing on OneDrive. For performance reasons, the reports are not refreshed every second; thus, if you try to do the same operation, you might not see updated numbers immediately when you go back to Power BI from Excel Online. However, if you wait a few minutes, you will likely see updated numbers. You also might need to refresh the page in the browser to see those updated numbers.
You have seen how David created a collaborative environment in Power BI by using groups and OneDrive for Business. Such a collaboration requires licenses for Power BI Pro and OneDrive for Business (remember that an Office 365 subscription usually includes OneDrive for Business, too).
Using groups, you can share files in OneDrive for Business only with group members. If you want to share a file with someone outside the group, you must use the personal workspace in Power BI and the personal folder in OneDrive for Business. Remember: only group members can see everything you store in a group.
If you do not have OneDrive for Business available, you can still use the personal edition of OneDrive (which is available at no charge), but the scenario described in this chapter will be slightly different. You can share an Excel workbook in OneDrive, and other people can edit its content if you share the workbook with them. However, you can import such a workbook only to the personal workspace in Power BI, not to a group workspace. Thus, it is possible to do the following:
• Create an Excel workbook on OneDrive.
• Share the Excel file with other users, even those outside your organization (there are several limitations when doing so with OneDrive for Business).
• Import the Excel file stored on OneDrive in a Power BI dataset.
• Use the dataset in your reports and dashboards. However, you can share them only within your organization, not external users.
You can use the personal OneDrive to create a very similar scenario, but you will not gain the benefit of automatic visibility of files to group members as you do by using OneDrive for Business.
Viewing reports and dashboards on mobile devices
All users who can access Power BI can see all of the reports and dashboards, even on native applications for mobile devices. There are native Power BI apps for Windows (available at the Windows store), iOS (available at the Apple store), and for Android (available at Google Play). These native apps also have additional features, such as annotations. They are updated with new features regularly.
Getting back to David, he might, for example, want to show the dashboard on his Windows 10 tablet device to a colleague during a meeting. Because the meeting room does not have good Internet connectivity, he takes advantage of the offline availability of dashboards by using the mobile app. This feature also makes it possible to view reports offline, even if you have no interactive capabilities. Thus, David can see the data available with the last refresh of the report, and this is enough for the meeting he planned. Figure 2-25 shows that the rendering of the Budget Totals report is pretty similar to the one available in the browser.

You might also experience different visual presentations in the Power BI app on tablets and smartphones. For example, Figure 2-26 demonstrates how an iPad displays the dashboard created by David in Chapter 1. You can zoom in to each visualization and navigate with the benefit of larger graphics, making it easier to read numbers, as illustrated in Figure 2-27.


That same dashboard is rendered differently on the smaller screen of an Android smartphone, as depicted in Figure 2-28. Visualizations are organized in a vertical column, and you can zoom in to each one, as shown in Figure 2-29.


Users who need to enter budget data in Excel files can also choose to use the Excel app on mobile devices. This app provides a user interface that is optimized for the device, which offers a better user experience than the generic web user interface of Excel Online. Figure 2-30 and Figure 2-31 show how the two worksheets of the Sales 2015 And Budget 2016 workbook display on an Android smartphone.


Figure 2-31: The Excel app on an Android smartphone, displaying the Budget worksheet. Users can enter data here.
Different operating systems and devices might provide a slightly different user interface. The goal here is just to inform you of the options available for tools that complement the Power BI service and app. We suggest that you try these applications for yourself, with your own data, so that you can evaluate which of your data for Power BI can be displayed/edited using a mobile device.
Conclusions
In this chapter, you saw how to share dashboards, reports, and raw data with people within an organization.
• You can invite a user within your organization to see a dashboard. That person can also see the reports underlying the dashboard.
• To share a dashboard with users outside of your organization, you must provide them an account within the same tenant.
• You can publish a report on a webpage; however, anyone can view that report. You should consider this option only for data intended for public consumption; you should not use it for sensitive, company-private data.
• You can create groups of users within your organization and share datasets, reports, and dashboards.
• You can use the same groups with OneDrive for Business to make it possible for other users to directly enter data in shared reports, which are then automatically updated after each change.
• You can display dashboards and reports on mobile devices by using native apps. These apps typically provide a better user experience if you are using smaller displays and have limited offline access to dashboards.