Chapter 8. Using Microsoft Power BI in your company
With Power BI, you can create a dashboard using some data in a Microsoft Excel workbook, or you can connect to existing structured databases in your company. The previous chapters in this book demonstrate how you can create data models, reports, and dashboards, gathering information from different data sources. They also show you how you can consume these results on different devices. This chapter shows you techniques to obtain a deeper integration with existing systems and applications.
You can get data from many existing data sources in your company. You can embed a dashboard visualization in Microsoft Office with minimal effort. If you have developer skills, you also can take advantage of the REST API to automate operations in Power BI by implementing real-time updates of dashboards, with no more latency than just a few seconds.
Power BI is a platform that exposes several services through a REST API that is easy to use by any application, including standard web-based applications and those running on mobile devices. In this chapter, we will look at some example results that will help you to understand why the presence of this extensibility option is so important. The goal is not to describe in detail how to use these APIs from a developer’s point of view, but to make you aware of what you can obtain by using them. If you are a developer, you will find some links and references to additional material to understand how to use the existing API. If you are a business user or a BI architect, you will gain a fuller understanding and know what you can and cannot ask a developer. However, keep in mind that the API for Power BI is undergoing constant evolution. If something is not possible as of this writing, it might become possible in a future release. When in doubt, check what new features are available in the API.
Getting data from existing systems
Any company has a number of existing data sources that you can use in Power BI. You have seen that you can create a data model in Power BI by copying the content of tables that exist in other databases or files. You also have the option of refreshing this content dynamically, or you can directly query the data source whenever you access a report. By querying directly, you avoid the need to create a copy of the data that you must then synchronize periodically. In this section, you will see the available options with which you can connect Power BI to either your on-premises database or a database in the cloud.
Before looking at the details, here are a few terms with which you should be familiar:
• On-premises If you get data from a database that is physically stored in a server managed by your company, we say that the database is on-premises (often shortened to on-prem).
• Cloud If you get data from a Microsoft Azure service, you are using data in the cloud. Cloud computing accesses and uses shared compute and storage resources on the Internet.
• Relational database This is a database that stores data using tables that have relationships with one another. Typically, you query this by using the SQL language. Examples of on-premises relational databases that Power BI supports are Microsoft SQL Server, Microsoft Access, Oracle, IBM DB2, MySQL, PostgreSQL, Sybase, and Teradata. Cloud-based relational databases that Power BI supports include Azure SQL Database and Azure SQL Data Warehouse.
• Rich semantic model This is a database that stores both data and metadata, simplifying navigation by using tools such as Excel PivotTables and Power BI reports. A typical example is Microsoft SQL Server Analysis Services. Other supported providers are SAP HANA and SAP Business Warehouse.
• Power BI Personal Gateway This is a component installed on the user’s computer that makes it possible to perform data refreshes on models published using the Power BI service. (Chapter 3 explains how to install this.) A Personal Gateway serves only one user, and only when the user’s computer is turned on.
• Power BI Enterprise Gateway This is a component similar to the Personal Gateway that a system administrator installs on a server in your company. A single Enterprise Gateway can serve all the users of a company, and it is also available as soon as the server is turned on (servers are usually active 24/7). You can find more technical details about how to install it at https://powerbi.microsoft.com/documentation/powerbi-gateway-enterprise/.
There is also another concept to clarify before moving forward, which is the difference between a model requiring data refresh and a live connection.
Understanding differences between data refresh and live connections
When you navigate in data via Power BI, you can read a copy of the data stored in Power BI (either the Power BI service or the Power BI Desktop application), or you can have a live connection that sends a real-time query to the data source without creating a copy of the data.
Chapter 4 shows that when you connect Power BI to a SQL Server database, you have two connection settings from which to choose: Import and DirectQuery. The DirectQuery option does not create a copy of the data in Power BI, and it translates any user action made navigating on a report into one or more queries to SQL Server. In a more general classification, we can say that you can either import data in Power BI or connect to the data source via a “live connection.” With relational databases, DirectQuery is the tool used to obtain a live connection to the data source. As you will see later in this chapter, in Power BI you have similar options when you connect to a SQL Server Analysis Services data source: Connect Live and Import Data.
Regardless of the underlying database, when you create a model in Power BI by importing data, you have full access to the features of Power BI. However, you need to run or schedule a data refresh to keep data updated on Power BI.
On the other hand, when you use a live connection, your Power BI model can have only one data source, so a single Power BI report cannot mix visualizations connected to data coming from different data sources. To do that, you must import data into Power BI. In a dashboard, however, you can always include visualizations from different reports; thus, you can combine visualizations from different live connections in a dashboard only.
In the following sections, you will see in more detail how to use live and imported data sources using existing databases and models in your company.
Using relational databases on-premises
When you create a data model in Power BI Desktop, you often get data from an on-premises relational database. For example, Chapter 4 demonstrates how to create a new Power BI Desktop data model that gets data from a Microsoft SQL Server database. In this case, you use a database on-premises, and you can choose between the Import and DirectQuery connection types. The former creates a copy of the data in the Power BI Desktop model, which requires a refresh in order to synchronize the content of the Power BI data model with the source database. The latter does not create a copy of the data; instead, Power BI generates queries to SQL Server every time you navigate in a report.
In both cases, after you publish the Power BI Desktop file to the Power BI service, the refresh operation requires either a Personal Gateway or an Enterprise Gateway. If you use the Personal Gateway, you can only refresh datasets created by importing data, but you cannot use the DirectQuery option. To publish a Power BI Desktop data model created by using DirectQuery, you need the Power BI Enterprise Gateway.
Figure 8-1 illustrates what happens when you publish a Power BI data model connected to on-premises data sources via the Import connection type. A copy of the data and the description of the data model are stored in the Microsoft cloud. The data is always available to queries sent by any client, which sees data updated on the last data refresh. You need a Power BI gateway installed on-premises to complete the data refresh: either a Personal Gateway or an Enterprise Gateway, in this scenario.

Figure 8-1: A Power BI gateway is required to refresh a Power BI model, getting data from on-premises databases.
Figure 8-2 shows what happens when you publish a Power BI model created by using the DirectQuery option. The Power BI service does not store a copy of data in the Microsoft cloud; it has only a semantic description of the data model, with the information required to retrieve data from the original source database. Every time the Power BI service receives a query, it generates one or more queries in SQL language and sends these requests to the relational data source through the Power BI Enterprise Gateway.

Figure 8-2: For on-premises data sources, you must have the Power BI Enterprise Gateway for a model using the DirectQuery connection setting.
More info
The Microsoft cloud service does not preserve any data received from the relational databases on-premises; it might only keep a transient data cache on a volatile device in order to improve the performance of other queries sent by the same user. You can find more information in the Power BI Security whitepaper published by Microsoft at http://download.microsoft.com/download/4/8/C/48CFCF8A-2025-4B97-B249-7B505E26E7ED/Power%20BI%20Security%20Whitepaper.docx.
As of April 2016, you can take advantage of DirectQuery on SQL Server, Oracle, or Teradata relational databases, which are all supported in the Power BI Enterprise Gateway.
Using relational databases in the cloud
If you create a Power BI model that uses a relational database stored in the cloud, you might not need the Power BI Gateway to refresh data. Power BI supports direct connection to Azure SQL Database and Azure SQL Data Warehouse data sources, so you can schedule a data refresh or you can use DirectQuery without the need to install and configure any gateway.
You will still have a different architecture, depending on which connection setting you use, Import or DirectQuery. Figure 8-3 illustrates that by using the Import setting you still have a copy of data owned by the Power BI service, but you can refresh that copy without any gateway if the data source is Azure SQL Database or Azure SQL Data Warehouse.

Figure 8-3: Power BI can connect directly to Azure SQL Database and Azure SQL Data Warehouse to refresh a Power BI model.
Figure 8-4 illustrates the behavior of Power BI using DirectQuery connected to Azure SQL Database or Azure SQL Data Warehouse. As with any DirectQuery connection, the Power BI service has only a semantic description of the data model, along with the information required to retrieve data from the original source database. It does not store a copy of data in the Microsoft cloud. Every time the Power BI service receives a query, Power BI generates one or more SQL queries and sends these requests to the relational data source, with no gateway required.
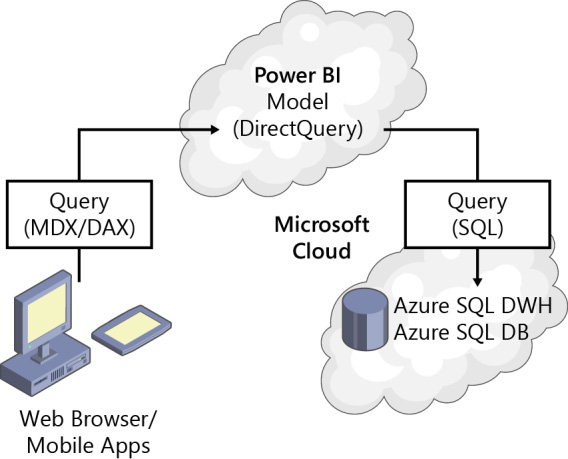
Figure 8-4: In DirectQuery mode, Power BI connects directly to Azure SQL Database and Azure SQL Data Warehouse.
If you have a cloud-based relational database, other than Azure SQL Database and Azure SQL Data Warehouse, you must use the architecture for on-premises data, and you need to install a gateway to complete the refresh operation or to implement DirectQuery.
Note
Multiple requests on different servers in different locations might increase the latency of requests, so you might want to consider installing the Enterprise Gateway on a server hosted in Azure Virtual Machines to improve the performance.
Using live connections to Analysis Services
When you create a live connection to Analysis Services in Power BI Desktop, you do not create a data model, and you do not have a copy of the data in the PBIX file. Thus, when you publish the model on the Power BI service, the PBIX file contains only the definition of the reports, but the entities are defined in the Analysis Services file. When you edit a report in Power BI that is tied to a live connection to Analysis Services, all of the operations requested by the client are redirected to Analysis Services through the Power BI Enterprise Gateway, as shown in Figure 8-5.

Figure 8-5: When a model has a live connection, Power BI redirects a query to Analysis Services on-premises.
The Power BI service contains neither data nor metadata for the data model. Any change made to the data model in Analysis Services is automatically reflected in Power BI, without requiring a data refresh operation in Power BI. However, keep in mind that usually Analysis Services has a copy of the data read from one or more data sources (unless you create a data model in Analysis Services by using DirectQuery), so you need to refresh the model in Analysis Services to keep it up to date.
Integrating Power BI with Office
Showing dashboards and reports created in Power BI using one of the options available (web browser, dedicated apps on mobile devices, and Power BI Desktop) is very useful. However, perhaps you want to create a particular report in Excel or a presentation in Microsoft PowerPoint, which could benefit from a tighter integration with Power BI. As you will see in this section, there are several features in Power BI that can take advantage of such a service in certain applications of Office.
Publish Excel data models in Power BI
When you publish a Power BI Desktop file to Power BI, you are copying to the cloud a file containing a data model, a copy of the data, the query to import and refresh the data, and all the reports you created. If you have an Excel file with a data model, you have a similar file, and you can publish such a file on Power BI, as well. In fact, the following correspondence exists between features in Power BI and Excel:
• Power BI data model → Excel Data Model (also known as Power Pivot data model)
• Power BI Query Editor → Workbook Queries (formerly known as Power Query in Excel 2010 and Excel 2013)
• Power BI report → Power View
You can load into Power BI an XLSX file containing a data model instead of a .pbix file. In doing this, you keep all of the existing features and reports in your Excel file, but you also can then use the same data model in Power BI. All the existing reports in Power View are converted in equivalent reports in Power BI whenever possible (certain features of Power View might not have a corresponding visualization or feature in Power BI). In this scenario, the PivotTables and PivotCharts you have in Excel continue to work with the Power Pivot data model. Figure 8-6 presents the Publish To Power BI feature that is available in Excel 2016, which guides you in publishing a Power Pivot data model to Power BI without even opening the Power BI website, similar to how you would publish within Power BI Desktop.

It is important to consider that, if you import the Power Pivot data model in Power BI Desktop, you will have a .pbix file instead of an .xlsx file. In this way, you can work locally with Power BI, but you will have two copies of the same data model and the same data. You will use Excel to navigate data with PivotTables and PivotCharts, and you will use Power BI to navigate using dashboards and reports. However, if you publish a .pbix file, you also can consume your data in Excel using the Analyze In Excel feature, which is described in the next section.
Consume Power BI content from Excel
In this book, you have seen how to import data from Excel to Power BI by using different techniques. However, you might want to move data in the opposite direction, consuming in Excel data that is published on Power BI. This is indeed possible, and you can do it by using the Analyze In Excel feature that is available in the Power BI service. Figure 8-7 depicts the Analyze In Excel action that is available for datasets and reports.

When you click Analyze In Excel, you might be prompted to install an updated driver for Excel; if this happens, follow the instructions to install the suggested driver. In any case, this action downloads a small file on your computer (with an .odc extension) that Excel uses to open a connection to the corresponding Power BI model, creating a PivotTable on top of the model. Figure 8-8 shows the result if you request Analyze In Excel on the dataset Google Analytics.

Figure 8-8: A PivotTable in Excel that is connected to the Google Analytics model in Power BI by using Analyze In Excel.
Note
By establishing a connection using Analyze In Excel, you are consuming your Power BI model as if it were an external analytical database. This is the same behavior you have in Excel when you connect to an Analysis Services database, or you connect Excel to a Power Pivot model published on SharePoint by using the Excel document URL as the server name. The Analyze In Excel feature uses Excel only as a client, without storing the data model within Excel, as you would do when you are using Power Pivot for Excel.
After you establish the connection with a PivotTable, you have all the tables, columns, and measures of the Power BI data model listed in the PivotTable fields. You can use only the measures that have been explicitly defined in the data model, so you cannot create measures during the navigation as you can do in Power BI. For this reason, it is important that you create all the measures that could be necessary to an Excel user, without assuming that any numeric column can be aggregated or that a measure can be created upon request. For example, the Sales 2015 – Analytics model that David created in Chapter 5 does not contain any explicit measures, and this makes it difficult to use in Excel. Figure 8-9 illustrates how the data of such a model is presented in the Excel PivotTable Fields pane.
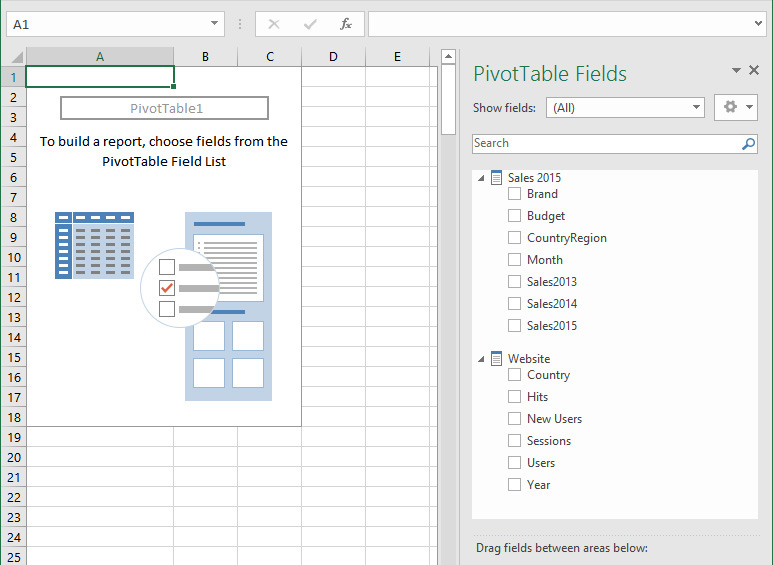
Figure 8-9: A PivotTable in Excel that is connected to the Sales 2015 - Analytics model in Power BI by using Analyze In Excel.
The model without explicit measures is not very useful in Excel, because you do not have any calculations to put in the Values area of the PivotTable. For example, Figure 8-10 shows the result of selecting the columns CountryRegion, Sales2013, and Sales2014 from the PivotTable Fields pane. These columns are placed in the Rows area of the PivotTable, and you cannot move them in the Values area. Thus, the result is a list of all the unique values of these columns, grouped by CountryRegion, Sales2013, and Sales2014.

Figure 8-10: A PivotTable in Excel that is connected to the Sales 2015 - Analytics model in Power BI by using Analyze In Excel.
Excel ignores that the nature of the sales columns is that of numbers that can be aggregated. This information must be provided by using explicit measures, such as those demonstrated in Chapter 6. For example, Figure 8-11 shows a PivotTable obtained by using Analyze In Excel on the Budget data model created in Chapter 6 and published on Power BI. In this case, the measure Sales Amount is aggregated by Brand and Year.

Figure 8-11: A PivotTable in Excel that is connected to the Budget model in Power BI by using Analyze In Excel.
One of the reasons to analyze data in Excel is to take advantage of specific Excel features. For example, in Figure 8-11 we applied a conditional formatting rule, so that higher values have a green background color, and smaller values have a red background color.
You might have many other reasons to use Excel to analyze a Power BI model. In general, Excel is a flexible application with which you can easily integrate data coming from different sources with data and/or calculations you have in the Excel file. Moreover, as of this writing, many of the features of a PivotTable in Excel are not yet available in the Power BI visualizations. Thanks to Analyze In Excel, you have the maximum flexibility to combine different clients (Power BI and Excel, for example) to analyze the data of the same data model.
Note
The authentication used to connect Excel to the Power BI model requires a new version of the OLE DB driver that is used to establish a connection to an external Analysis Services database (OLE DB for OLAP). For this reason, you might be prompted to install such a driver the first time you use Analyze In Excel on a computer. The connection to Power BI uses claims-based authentication, which is a different technology than the Windows integrated security that you might be using to connect to Analysis Services. You might be prompted to provide a user name and password to connect to Power BI the first time you open such a connection. If you need to connect to different Power BI models using different users, you might need to modify the connections string manually, even if this behavior might change in the future, because the Analyze In Excel feature is in preview mode as of this writing. For updated documentation, go to https://powerbi.microsoft.com/documentation/powerbi-service-analyze-in-excel/.
Using Power BI Tiles from Office Store
You can create an Office document in Excel and PowerPoint in which you embed one or more Power BI visualizations. You can create a PowerPoint presentation in which you show live data from Power BI. In a similar way, you can create an Excel workbook in which you embed some visualizations from Power BI on the same page where you also have other data presented with standard Excel tools. This is possible thanks to a free third-party add-in called Power BI Tiles, which takes advantage of the Power BI APIs (these APIs will be explained in more detail later in this chapter). If you are not a developer, you still might be interested in the technical details; you just want to use the existing tool.
You can download Power BI Tiles from the Office Store. It is compatible with Microsoft Office 2013 Service Pack 1, or any following version, including Office 2016. If you have a subscription to Office 365 that includes the licensing of desktop applications, you should already have a compatible version of Office installed on your computer.
Note
Power BI Tiles is a free add-in created by DevScope; it is not a Microsoft product, but as of this writing, there are no corresponding solutions produced by Microsoft. You do not need administrative rights to install Power BI Tiles.
Let’s visit with David once again, and consider how he can create a PowerPoint presentation that embeds some of the visualizations he created while working on the budget. In PowerPoint, on the ribbon, on the Insert tab, David clicks the Store button, as shown in Figure 8-12.

In the Office Add-Ins dialog box, in the search box, David types “power bi tiles,” which presents him with the result depicted in Figure 8-13.

Figure 8-13: A list of available Office add-ins, filtered by the string “power bi tiles” in the search box.
Note
If you do not have PowerPoint installed locally and you want to use Office online, you can still use the add-ins available in the Office Store by using the online version of the Office application.
After David installs the add-in, Power BI Tiles becomes available on the PowerPoint ribbon, on the Insert tab, in the My Add-Ins list, as demonstrated in Figure 8-14.

When David clicks Power BI Tiles in the list of My Add-Ins, PowerPoint inserts a new rectangular object in the current slide that will display the content of a report or a dashboard. Within this area, you are prompted to choose between connecting to your Power BI account or displaying a public report (Chapter 2 explains how to publish a report to a webpage for public access), as shown in Figure 8-15.

Figure 8-15: You can choose between connecting to a Power BI account or public reports for Power BI Tiles.
The first time David connects to Power BI, he is asked to grant authorization for Power BI Tiles to access certain Power BI features, as shown in Figure 8-16.

David clicks Accept, which authorizes Power BI to accept requests coming from Power BI Tiles. He now can use dashboards and reports available in any Power BI workspaces to which he has access. David can select either a dashboard or a report, and he needs to consider that there are a few differences in the visualizations and user interactions between the two. For example, Figure 8-17 depicts the list of reports available to David in the Power BI Tiles visualization in a PowerPoint slide. In this example, he chose the Budget 2016 group workspace, using the middle button of the three in the upper-right corner of the area used by the Power BI add-in. The list of reports displays the only report published in the workspace: Budget Totals. If you want to see the list of available dashboards in the same workspace, click the Dashboards button, located directly to the left of Reports, above the report list.
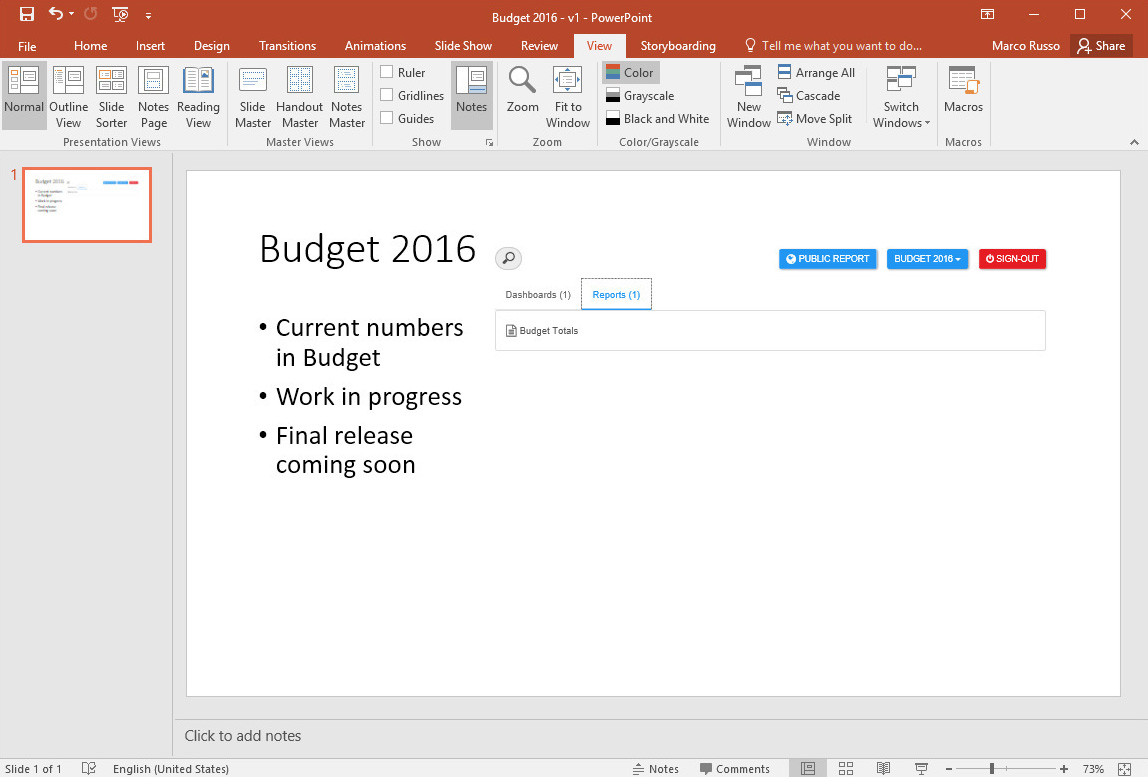
Figure 8-17: A Power BI Tiles object inserted in a PowerPoint slide lists the available reports to display.
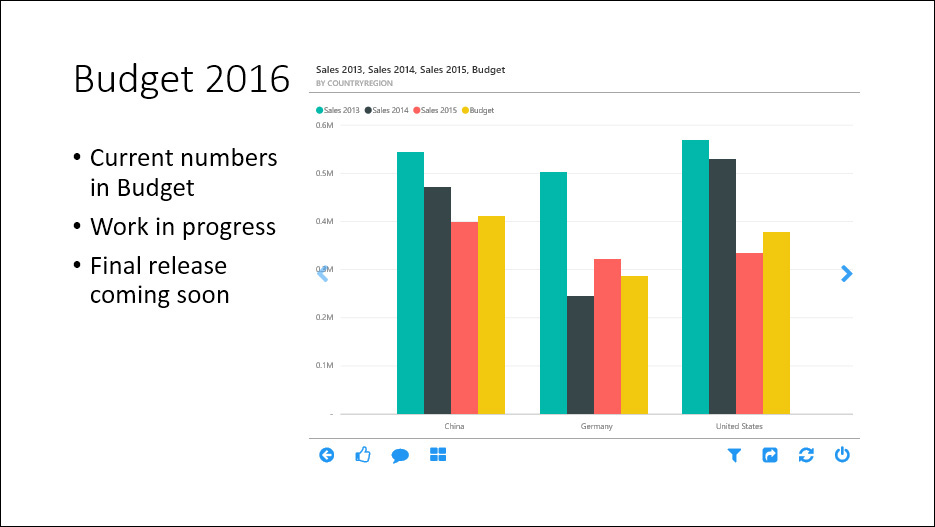
After David selects a report, it is rendered within the workspace of the PowerPoint slide. If the report size is larger than the available space, scrollbars will appear, as shown in Figure 8-18. The report embedded by Power BI Tiles is fully functional and interactive, so David can use filters and zoom single visualizations of the report, exactly as he can do on the Power BI website. He can even utilize this interaction in Slide Show mode.

You can change the objects displayed in the Power BI Tiles add-in by going back to the list of dashboards and reports (refer back to Figure 8-17). To do that, below the report, click the Back button (the left arrow), which is the one farthest left.
If you select a dashboard, you obtain a slightly different behavior: the Power BI Tiles add-in displays only one visualization from a dashboard at a time. If the dashboard contains two or more visualizations, arrows will appear on the left and right side of each one, which you can click to scroll through the visualizations, as illustrated in Figure 8-19. In this example, only one of the two available visualizations in the Budget Totals dashboard (which, by the way, are the same visualizations used in the report) is visible on the slide. Each visualization takes up the entire amount of space available, which makes them easier to view, but you do not have any interaction with the charts.
Whether you choose to embed a dashboard or a report depends on the type of presentation you are creating. If you want to interact with the data, you can modify either choice during the presentation, navigating in the list of dashboards and reports available. However, you should choose the visualization that is more readable and effective for your presentation.
If you want to refresh the data during the presentation, click the Refresh button, which is the second one from the right, below the Power BI Tiles add-in (see Figure 8-19).
You also can use the Power BI Tiles add-in in Excel, creating a worksheet that displays a visualization from Power BI next to data rendered in Excel; for example, using a PivotTable. The features of this add-in work well in Office online, too.
Managing security to access data
The previous chapters of this book demonstrated several ways to share data with other users, within and outside of your organization. In this section, you will review the features available in Power BI to share data with other users and to control access to data in a more granular way, up to the row level in each table.
The following list explains the visibility options available to a Power BI user (other options through APIs are described later in this chapter):
• My Workspace All of the datasets, reports, and dashboards you save in My Workspace are visible only to you, unless you explicitly share them by using one of the sharing features that follow.
• Group Workspace All of the datasets, reports, and dashboards saved in a group workspace are visible to all the members of the group. The group in Power BI corresponds to a group in Office 365, so you can administer the group from both administrative user interfaces. A new member in the group automatically has access to the data available to the group.
• Share dashboard When you share a dashboard, you send a personal invitation to a single individual identified by an email address. This email must correspond to a Power BI account. If the invited user connects to Power BI for the first time, he can create a Power BI sign-in to access data. You can control who has access to a dashboard, adding and removing users from the allowed list at any time. Optionally, you can choose to delegate another user, who can then share the dashboard to other users. When you share a dashboard with a user, you also provide him read-only access to all the underlying reports (from pinned tiles) and datasets used in the dashboard. In fact, users can freely navigate in data sources by starting with a request in the Q&A question box and then customizing filters and visuals, selecting different slices of data and changing the measures displayed and attributes analyzed.
• Create content pack You can publish an organizational content pack, sharing datasets, reports, and dashboards, at the granularity that you prefer. When you include a report in a content pack, you also automatically share the underlying datasets. When you include a dashboard in a content pack, you also share the underlying reports and datasets. Those who use an organizational content pack have access to all of the data included in the content pack and can freely navigate to them, creating new reports and dashboards based on that data.
• Publish to the web You can publish a report to the web, embedding it within a custom webpage on a website you can edit, or by simply providing a URL containing just the published report. Any user can access that report through this URL, and she can interact with the report using only the visualizations displayed in the report itself. The user cannot gain access to the underlying data source, and cannot modify measures, slicers, filters, and visualizations used in the report. You cannot control who accesses the report, because the URL can be freely shared with anyone; in fact, Microsoft can publish the report in a public gallery. You should not use this feature to distribute reports that contain sensitive data.
• Row-level security You can restrict data access for specific users by defining filters at the row level in one or more tables of a dataset. This is an additional security level applied to users who already have access to the data because you shared a dashboard with them. For example, you might share the same dashboard with five different managers, one for each country/region, letting them see only the data of the country/region that they manage.
When you choose the method by which you want to share data with other users, you need to evaluate the visibility you want to provide to reports and datasets, and the type of restrictions you want to apply. In the previous chapters, we describe each of the aforementioned features except the last one, which is the topic of the next section.
Using row-level security
When you want to restrict the rows visible to a single user, you must apply a security rule to the dataset, so that regardless of the report displayed or edited, the user cannot access data that he is not allowed to see. For example, the managers of China or Europe should see only data relevant to their area, even if all of them use the same report. This type of security is known as row-level security.
If you are using a live connection to Analysis Services or you created a model by using DirectQuery, you must implement row-level security on the source database, and you cannot modify its behavior in Power BI.
If you have a model that imported data in the Power BI service, you can apply row-level security to the dataset. You can manage row-level security by selecting the Security action available for datasets, as you can see in Figure 8-20.

In the row-level security configuration, you create one or more security roles, which define the rows a user can see in each table. You can find a step-by-step guide to configuring row-level security at https://powerbi.microsoft.com/documentation/powerbi-admin-rls/.
Note
As of this writing, this feature is in preview, and details might change very quickly. You might want to refer to the online documentation to see if there have been any updates to the user interface.
Figure 8-21 shows the final result of a security role (named China) providing access to only those rows corresponding to sales made in China.

Figure 8-21: The configuration for row-level security for limiting access to sales made only in China.
Each role contains one or more members; these are the users who can access the model through the role. The rules defined for the role are in the form of a DAX expression for each table. A row in a table is visible if the condition, for that row, is true. If a user belongs to more than one role, he will have access to all the rows that are visible in at least one of his roles. However, if a user does not belong to any security role and the dataset has row-level security active, he will not see any data for that dataset, regardless of whether he can access the dashboard containing data from that dataset because it has been shared by another user.
When you restrict access to a table that has a one-to-many relationship with other tables, you restrict access to the related tables, too. Consider a model with two tables: Customers and Sales. Applying a security rule to Customers also restricts Sales, showing only the sales related to a visible customer.
Let’s take a look at what happens when David creates the row-level security rule shown in Figure 8-21, assigning Wendy Kahn as a member of the role, and then he shares with her the dashboard depicted in Figure 8-22.

When Wendy opens the same dashboard shared by David, she sees only China; Germany and the United States are not visible, as illustrated in Figure 8-23.

The security restrictions applied to the dashboard Wendy received from David are also applied to any other visualization shown to Wendy and are based on the same dataset. By applying security at the row level, you can easily customize the aggregations visible to each user. However, keep in mind that you cannot prevent a user from viewing a particular table, column, or measure. The row-level security filters rows, not columns or other entities of a certain dataset. When you share a dashboard and its reports, in theory the user consuming the data cannot gain access to other entities (measures, columns) that were not published in the report, but this is not guaranteed by the row-level security filter and cannot be enforced at the dataset level. For this reason, if you need to ensure that certain measures are not visible to a group of users, you should consider creating a separate model for that, including only columns and measures that can be made visible to all of the users who can access a certain dataset.
Note
As of this writing, the row-level security feature is in preview. It has a number of restrictions that might be lifted or removed in subsequent releases. As of now, you can apply row-level security only in datasets included in My Workspace, but not in group workspaces and not in datasets published in content packs. You can add only single users as role members, not user groups or distribution lists. You can apply it only to datasets created by using Power BI Desktop, not to datasets created with Power Pivot for Excel (but you can import such a model in Power BI Desktop and then publish the Power BI Desktop file). However, when you publish a new version of the Power BI Desktop file, all the existing security roles are removed completely. DirectQuery is not supported for row-level security. Q&A and Cortana are not supported by row-level security, so Q&A input is not visible if role-level security is active for all the models related to a shared dashboard.
Extending and customizing Power BI
Power BI is not only a service that you can activate and use. Likewise, it is not only a product (Power BI Desktop) that you can download and install. You can extend and customize Power BI in many ways, because Power BI offers a number of extensibility points to developers who are interested in adding features, customizing the experience, or integrating existing applications with Power BI.
You can find a more detailed introduction oriented to developers at https://powerbi.microsoft.com/documentation/powerbi-developer-overview-of-power-bi-rest-api/. The goal of this section is to introduce you to what is possible and what the current limitations are. In this way, you will have a better understanding of the platform before looking for developers who might help you in this effort, if you do not have the required skills but are interested in achieving the results.
Creating custom visualizations for Power BI
Chapter 7 describes how to add custom visualizations in a Power BI report. As a user, you are likely interested in using existing custom visualizations, and you can find a public gallery of them at https://visuals.powerbi.com. If you need specific visualizations that are not available in the gallery, you can (or ask a programmer to) create a new visualization, following the guide available at https://powerbi.microsoft.com/documentation/powerbi-custom-visuals/. The main skills required to create a custom visualization are TypeScript (a typed version of JavaScript) and CSS. Thus, if you have programming skills in JavaScript and CSS, you will have a short learning curve to become proficient in writing code for a custom visualization. To become inspired to create new visualizations in Power BI, take a look at the examples of custom visualizations in Chapter 7.
Introducing the Power BI REST API
Previously in this chapter, we showed you how to use the Power BI Tiles add-in. Recall that this component interacts with the data and services provided by Power BI using a programming interface called REST API. In this book, we do not want to go into the details of a REST API or how to use it, but you can find these details in the online documentation. Most of the information there is useful to developers who want to integrate Power BI services in their applications. The goal here is to explain the importance of this API and why it is the foundation of an ecosystem that makes the integration between Power BI and other applications and services possible, going beyond the features currently available to Power BI end users.
Using the REST API for Power BI, a developer can create a new application or extend an existing one so that it can publish or consume data, reports, and dashboards in Power BI. REST stands for Representational State Transfer, which is a protocol that allows any existing programming language to interact with the API, and it is widely adopted in modern programming platforms. REST facilitates interoperability across different languages and operating systems. There are particular specifications to handle authentication and authorization, and you can find all of the details and many examples at https://msdn.microsoft.com/library/dn877544.aspx.
Besides the REST protocol, the API exposes several features that can manipulate the following entities:
• Dataset You can create new datasets and read existing ones.
• Table You can create new tables and modify the schema of existing ones that you created before using the same API. You cannot modify tables that are a part of a data model that imports data from external data sources.
• Row You can add and delete rows in tables that you created in a dataset. The delete operation removes all the rows, and you cannot specify any filter, whereas the add operation works incrementally, adding new rows to the existing ones.
• Group You can access a particular group to create a dataset in a group instead of a personal workspace.
• Import You can import a Power BI Desktop model (.pbix file) or a Power Pivot for Excel data model (.xlsx file) in Power BI.
• Dashboard You can retrieve dashboards and tiles from dashboards from a particular workspace to which you have access. The Power BI Tiles add-in, for example, uses this API to retrieve the selected visualization from a dashboard.
• Report You can retrieve reports from a particular workspace to which you have access.
You can integrate the visualizations and report objects that you can access through the API in an existing application (this is called “embedding an IFrame”), which is actually what the Power BI add-in does. In the following sections, you will see two examples of applications that are possible thanks to the Power BI REST API.
Limitations
It is worth mentioning the current limitations, considering that the API will evolve and new features will be added, hopefully also to cover some of the scenarios that are not available today. In general, you cannot manipulate the content of a single object. For example, you cannot alter a published dataset, dashboard, or report. You cannot create a report or a dashboard programmatically. You can publish a Power BI Desktop file (.pbix), which can include particular reports, but you do not have an API to create a report or a .pbix file programmatically. This is a current limitation for the Power BI embedded scenario that is described in the next section; but keep in mind that it is still in preview as of this writing, and new API features certainly will be added in the future. Thus, you’ll probably want to look at the updated documentation to check whether new features have been added to overcome the limitations described here.
By using the Power BI REST API, you can extend existing applications, integrating features available in the Power BI service. This API also opens myriad possibilities to third-party vendors to create components, applications, and services that extend the features available in Power BI.
Pushing real-time data to Power BI dashboards
One of the features available by using the Power BI API is the ability to “push” data in a dashboard in real time. By using this feature, the numbers and visualizations included in a dashboard are automatically updated almost every second, reflecting the changes received in the data. However, the datasets underlying these dashboards are designed in a particular way, and in this section, we want to give you an overall view of the features and limitations of this technique. If you’re a developer who is interested in creating these dashboards, a complete walkthrough is available at https://powerbi.microsoft.com/documentation/powerbi-developer-walkthrough-push-data/.
To obtain a real-time dashboard, you first need to programmatically create a dataset. Then, you need to build reports using this dataset, and finally you can pin report visualizations and Q&A visualizations in the dashboard. These tiles will be automatically updated as soon as the underlying dataset receives new data.
The first step also defines the biggest limitation that exists for real-time dashboards: You must first create a dataset programmatically, and this dataset can have tables and columns that will be filled with data sent by an application. The data refresh is not possible in these datasets. We call this a push mode, where an application sends data to Power BI, instead of having Power BI ask for data from the data source (which is the classic pull mode used by data refresh). You cannot create the data model by using Power BI Desktop, and you cannot add relationships and measures to the data model. You can obtain only standard aggregations for measures, such as sum, average, count distinct, and other predefined ones, but you cannot create either calculated columns or measures using custom DAX expressions. For this reason, it is difficult to display percentages and variations obtained by aggregating existing data. The dataset can be created in a personal workspace or in a group workspace.
The second step, which still requires that you or an application developer write custom code, is to insert rows in the tables of the dataset using the Power BI REST API. Every table has a limit of 5,000,000 rows, or 200,000 rows if you choose a storage model (also known as FIFO dataset) that automatically removes the older rows. The amount of rows written and the frequency of update depends entirely on the application that “pushes” data into the dataset in Power BI. A few limitations exist, based on the Power BI plan used (10,000 rows per hour for the free service plan, and 1,000,000 rows per hour for the paid service plan, Power BI Pro). You can write this code specifically for a single dataset, or you can take advantage of the Azure Stream Analytics service, which simplifies using the same stream of data in different datasets, as described at https://azure.microsoft.com/documentation/articles/stream-analytics-power-bi-dashboard/.
After a dataset is created and populated with data, you can create a report using Power BI online. You cannot use Power BI Desktop for such an operation. You can use all the visualizations and filters available in a report to create your visualization. A report is not updated in real time; you must always manually refresh it to display the updated data. You can pin every visualization used in the report to a dashboard visualization, and when you establish the connection between the dashboard and the dataset (by pinning the first visualization), you can also begin using Q&A to navigate the data and to obtain other visuals that you can pin to the dashboard. All the tiles in the dashboard that are connected to a dataset that receive data in push mode, automatically refresh their content as soon as new data is received. You might observe a refresh almost every second, and the latency between updates of data and visualizations is typically only a few seconds.
Figure 8-24 presents an example of the real-time dashboard we created to monitor the usage of the DAX Formatter service, which is available at www.daxformatter.com. Every time a user formats a DAX query using this service, the application updates the dataset on Power BI, providing the date and time of the request and a flag that specifies whether the request was formatted correctly (increasing the Formatted counter) or contained a syntax error (increasing the Errors counter).

Figure 8-24: A dashboard updated in real time with data from www.daxformatter.com.
It is interesting to note that using Q&A is important to obtain certain dynamic filters, which are impossible to build in a report because you cannot create custom measures in DAX in this type of dataset. For example, the number of requests made today can be obtained by asking the question through Q&A, as illustrated in Figure 8-25. The word “today” is converted to the current date and is applied as a filter to the date column, returning the number of requests made in the current day. Note also that the number of requests in Figure 8-25 increased from Figure 8-24 because data is continuously updated in the dataset!

Power BI embedded in applications
Another extension available through the Power BI REST API and specific libraries to manage authentication for custom application is Power BI Embedded, which is an Azure service with which you can set up integration between an application and Power BI services.
For example, consider a service that collects data about personal bicycle trips. This service has a web application to manage the configuration and manual upload of data, even if most of the information will be sent by specific devices and/or apps. When it comes time to analyze data, it would be nice for this application to use Power BI services. One way to obtain this integration is to export data to Power BI and create custom data models and reports. For the company that provides this service, it could be a good idea to create a service content pack to make it easy for existing Power BI users to import their data. However, this approach requires all users to create their own Power BI account (even if it is a free one), whereas the application instead should have some embedded solution to display standard reports containing personal data. By using Power BI Embedded, the developers who build the web application can design these reports and publish them within their application in a seamless way. In this way, the web application can show a report containing data of the user who signed in within the same webpage, and without requiring additional authentication to the user itself. The process is completely transparent to the user.
More info
You can find documentation for Power BI Embedded and its pricing details at https://azure.microsoft.com/services/power-bi-embedded/.
Note
It is worth to mention that we showed you another type of web publishing in Chapter 2, the Publish To Web feature. The main difference between Power BI Embedded and Publish To Web is that the former controls the authentication of the user and can display customized content within the same report, whereas the latter only shows the same content to anonymous users.
Conclusions
In this chapter, you learned how you can use Power BI in your company, what the architectural implications of the many options available for data refresh are, how to manage security, and what the options are to customize Power BI and/or integrate it with existing applications.
Here are the most important features you learned:
• Available options to update data with scheduled refresh or live connections
• Integration of Power BI with Microsoft Office
• Control data access for specific users with row-level security
• Possible extensibility options using the Power BI REST API
Power BI is an open ecosystem that is constantly growing, thanks to the features added by Microsoft and those additional options provided by third-party groups, which use the same API you can use to customize and extend Power BI according to your specific needs.