Chapter 8. Analysis and Models
Qualitative analysis can seem like a mysterious process. A group of people enters a conference room with interview notes and stickies and emerges with recommendations for creating or changing the functionality or interface of a system.
For us humans, this is actually the most natural thing possible. We’re social creatures and pattern-recognition machines. Getting people together to analyze qualitative data is like throwing a party for our brains.
This is where design truly starts. You take all this messy data and begin to organize it, and group it, and label the groupings. Through conversation, clarity will start to emerge. Clarity in the data analysis will translate to clarity of concept, content relationships, navigation, and interactive behaviors.
Best of all, if you work collaboratively, that clarity and deep understanding will be shared. Any models or maps you create will simply serve as documentation of what everyone already knows.
Affinity Diagrams
Your first pass—and if you don’t have a lot of time, your only pass—should be to extract general design mandates from your interviews. Then you can prioritize those mandates based on business goals. This also requires the least diagramming skill.
The process is pretty simple:
- Closely review the notes.
- Look for interesting behaviors, emotions, actions, and verbatim quotes.
- Write what you observed on a sticky note (coded to the sourcethe actual userso you can trace it back).
- Group the notes on the whiteboard.
- Watch the patterns emerge.
- Rearrange the notes as you continue to assess the patterns.
You will end up with a visual representation—an affinity diagram—of your research that you can apply toward your design work in a few different ways (Fig 8.1).
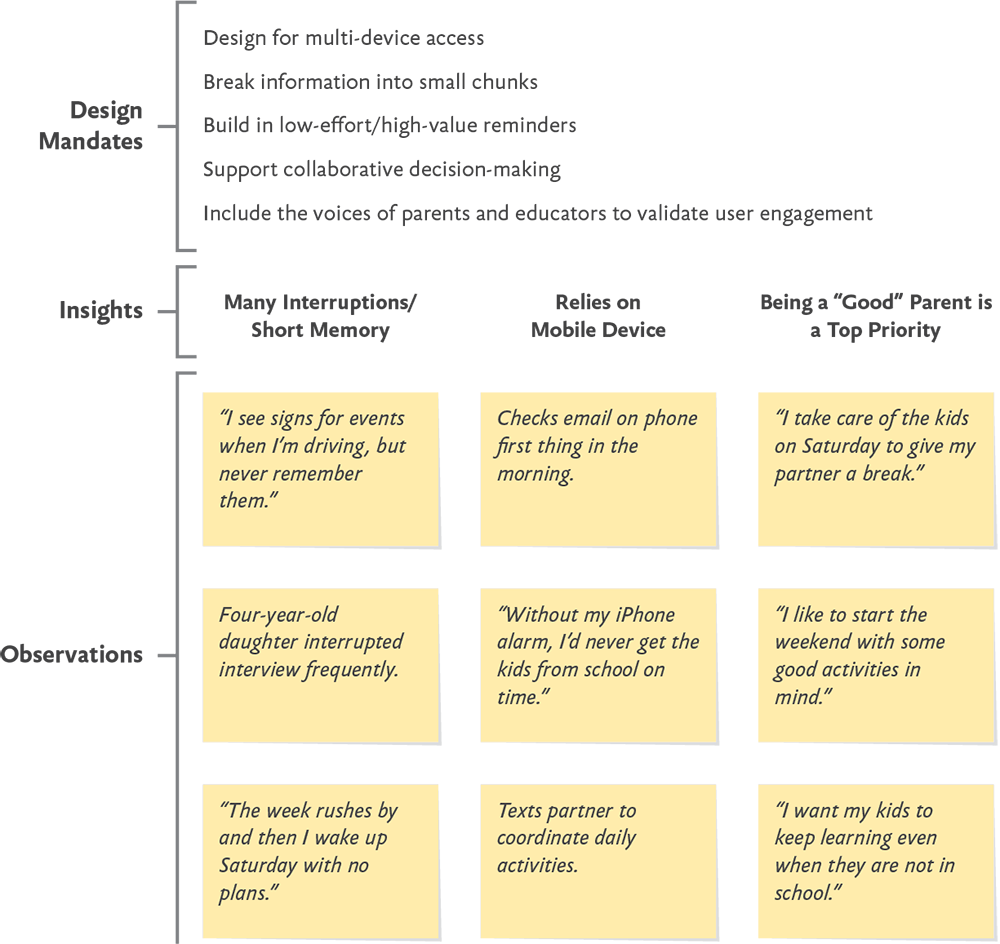
The participants in the analysis build clusters of related observations. Once a cluster starts to take shape, you can extract the insights and the overarching mandate or recommendation.
The act of creating an affinity diagram will allow you to distill patterns and useful insights from the many individual quotes and data points you gather through interviews and observation. The diagram itself can be a handy visual reference or a tool for communicating with a larger team about your research and the principles you’ve uncovered.
Write down observations
As you review the notes or recordings, write down anything interesting you observed on a sticky note. An observation is an objective description of what the user did or said, such as:
- “Participant’s four-year-old daughter interrupted three times during the thirty-minute interview.”
- “Participant reports checking email on her phone every morning before getting out of bed.”
Pull out all of the compelling quotes. Flag those that seem to represent the particular needs of each user type. These will be useful for your personas. Also note the vocabulary that participants used to describe their goals and the elements of the tasks or systems you are working with, especially if they differ from those used in your organization. Example quotes:
- “I reset my password every time I visit the website because I never remember it.”
- “I take care of the kids for the whole day every Saturday to give my partner some alone time.”
Note all stated or implicit user goals. Implicit goals can be found in quotes or actions that indicate a particular desire—for example, starting the weekend with some good activities in mind. In particular, flag goals that you didn’t anticipate, but that your product might readily satisfy. For example:
- “I like to start the weekend with some good activities in mind.”
- “I want my kids to keep learning even when they’re not in school.”
Create groups
Start grouping the notes on a whiteboard. You should start seeing patterns pretty quickly. Name the pattern and identify the user need that emerges from it. Quotes like “I see signs around town for events that look interesting, but I never remember before it’s too late” and “The week rushes by and then I wake up on Saturday morning with no good ideas” could be evidence of a pattern like “Needs reminders for organized activities.”
Identify next steps
The final step of the analysis is to identify the actionable design mandate or principle, like:
- When announcing an event, offer the ability to sign up for a reminder.
- Allow customers the option of digital access to all services.
- Improve promotion of and navigation to premium features.
- Create a stronger voice for the brand based on the attributes potential customers value the most.
In addition to serving as a useful input to other tools (like personas) and as a nifty visual representation of your research and analysis, the affinity diagram helps you make decisions. You can decide which features and functionality to prioritize based on the patterns of needs you recognize. You can decide to do additional research based on the questions it raises. And it can serve as a common reference point for your team in discussing those decisions.
Creating Personas
A persona is a fictional user archetype—a composite model you create from the data you’ve gathered by talking to real people—that represents a group of needs and behaviors.
Personas exist to represent the user in user-centered design, because there is no generic user. They embody the behavior patterns and priorities of real people and act as a reference point for decision-making. A persona is a tool for maintaining an empathetic mindset rather than designing something a certain way just because someone on the team likes it.
Good personas might be the most useful and durable outcome of user research. Design, business strategy, marketing, and engineering can each benefit in their own way from a single set of personas. If you’re following an Agile process, you can write your user stories based on a particular persona.
Some tips for working with personas:
- Design targets are not marketing targets. (Stamp that on every persona document you create.) Market segments do not translate into archetypes.
- The user type with the highest value to your business may not be the one with the most value to the design process. If you design for the users with less expertise, you can often meet the needs of those with more.
- A truly useful persona is the result of collaborative effort following firsthand user research. Otherwise you’re just making up a character that might be as relevant to the design process as any given imaginary friend. If you have interviewed some real people and worked collaboratively with your team to identify some patterns, you should be able to create some useful personas.
- You can create a vivid individual with just a few key details (Fig 8.2). It’s better for the team to keep a handful of attributes in mind than to have to refer to a lengthy CV or complex scenarios for every design decision.
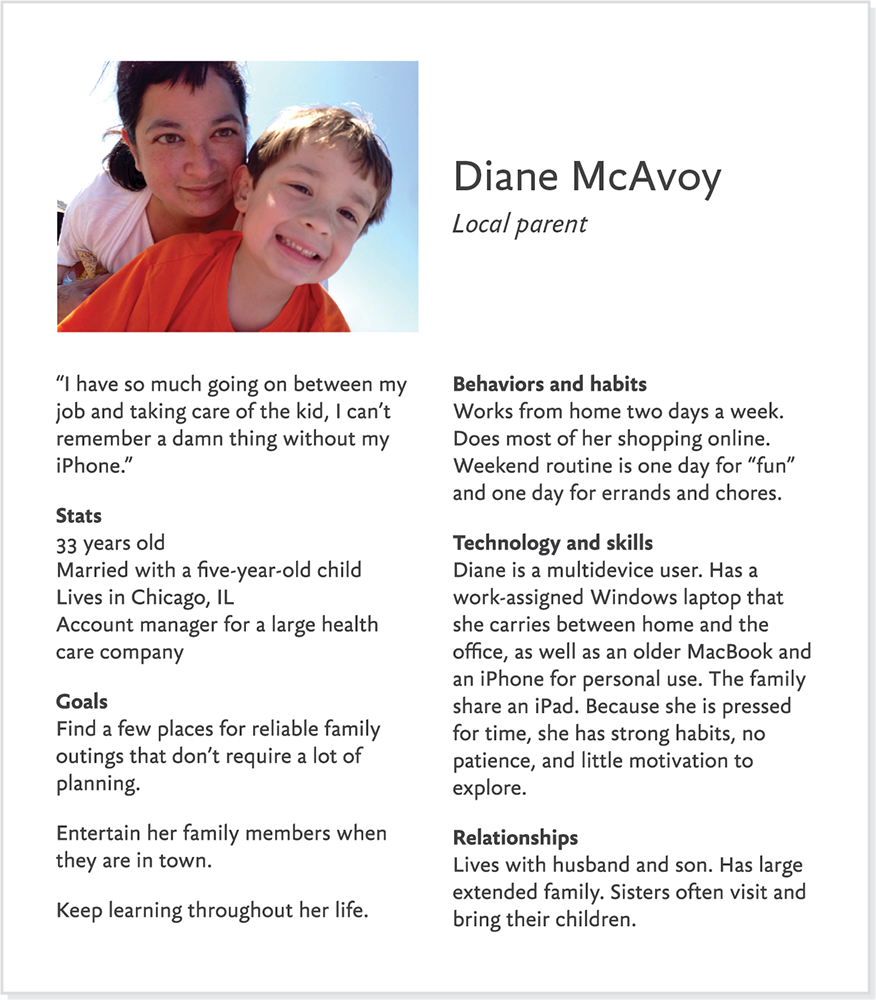
Fig 8.2: A persona document should feel like the profile of a real individual while capturing the characteristics and behaviors most relevant to your design decisions.
Capturing the character
A persona description should have just enough detail to capture those aspects of a target user most useful and inspiring for the designers and decision-makers to keep in mind. Consider your personas as a set—you don’t have to capture all concerns in a single one.
Personas can be a great tool for capturing accessibility concerns that otherwise might get lost in the process. Depending on the specific population and needs of your audiences, include factors such as low literacy in the primary interface language, the use of assistive technology, and temporary mobility impairments.
The persona must be plausible and representative (no teenage marketing VPs who model and fight crime on the side). Ideally, the attributes you list reflect those of actual users you’ve interviewed. However, recruiting can be unpredictable, and the lack of a complete match needn’t stop you from creating a suitable persona. Increase your knowledge by finding people online who match the roles and behaviors. Try searching local news stories and social media posts to for representative background details and quotes. Create a representative composite. Don’t just copy a profile from LinkedIn.
For the artifact itself, start with the conventional “place mat” layout and go from there. Make a movie or a poster or an animated GIF, as long as the essential information about context of use and patterns of behavior are in a form you can integrate into your workspace and refer to repeatedly.
Name
Be intentional about how you name your personas. The name you choose can help to thwart stereotypes across your organization by resetting expectations. Or, if you’re not careful you may end up reinforcing existing biases. While general descriptors, like “Power User” might seem less fraught, they are also less concrete and evocative. Give each persona a realistic name that helps frame thinking around the behavior pattern. The Random Name Generator (“Rare” setting) is a good source of inspiration (http://bkaprt.com/jer2/08-01/). The Game of Thrones Name Generator is not.
Photo
Use a real photo of a real, relatable person, not a stock photo. Creative-Commons-licensed photos from Flickr or other photo-sharing websites are very useful for this. Don’t use a photo of anyone who is known to the design team, or that has any distracting elements.
Demographics
It’s easy to overvalue demographic data, since this can be some of the easiest information to collect. As with your choice of name, careless use of demographic stats risks reinforcing stereotypes and decreasing the utility of the persona. After all, the same individual might get older, change gender identification, move to a new town, and get married, but still remain your customer with the same needs. Or not. Do age and gender really matter? Or can you refer to life phase and use a gender-neutral name?
Role
For the most accurate personas, select a role that closely matches that of one of the participants you interviewed and is also one of the identified target user types.
Quote
Use an actual quote from a user interview that embodies a core belief or attitude that is essential to keep in mind to meet their needs. The most useful quotes are those that could be answers to questions that reveal both behaviors and mindset, such as “What’s going through your head when you’re making plans for the weekend?”
Goals
Goals and behavior patterns are the core of a persona. Identify three to four key goals for that persona based on what you heard in your user research. These will be the goals that the product or website will serve or relate to.
Behaviors and habits
Note the specific and habitual behaviors that constitute the pattern that defines the persona. Parenting. Teaching. Researching activities online. Switching among multiple devices. Making decisions with another person. Making plans at the last minute. Real life is imperfect and complicated. Capture this. Maybe you spoke with a dad who is torn between wanting to relax on the sofa and wanting to get out and find new things to do on Saturdays. Does he have a habit of checking Facebook over coffee to see what his friends are up to with their kids? This detail could open up a whole conversation about social media.
Skills and capabilities
Capabilities include the level of technical expertise and experience this persona has as well as their physical and cognitive abilities. How much experience do you expect them to have based on their profession and educational background? It’s crucial not to make assumptions here. One of your target personas might be a successful physician who’s a relative technology novice because she is in surgery all day and gets very little time to learn expert features or acquaint herself with the latest applications. She could be a good proxy for everyone who has a lower skill level, but absolutely doesn’t want to be made to feel stupid.
Environment
Note all aspects of the environment that will affect this persona’s interaction with the product. Include the relevant hardware, software, and internet access. Do they go online at work, at home, or at a public library? Surrounded by people or in private? Using voice interfaces while working alone or texting in a crowd. Is their time online continuous or does it happen in specific chunks? A restaurant owner might have five minutes on their phone here and there. An accountant might have a browser window always open on the desktop.
Relationships
Note any relationships this persona has that will affect their interaction with your product. Is there a partner who influences decisions? Will children or coworkers be present or otherwise influence the use of your design? Relationships should be based on real-world data, either from your study or other research. Information from the census or from the Pew Center’s Internet & American Life Project is often useful in this regard. You can create some interesting multipurpose scenarios with personas that are related to one another.
Scenarios
If personas are your characters, scenarios are your plots. Each scenario is the story of how a persona interacts with your system to meet one (or more) of their goals. Running a persona through a scenario helps you think through your design from the user’s point of view. You can use scenarios at several points in your process:
- to flesh out requirements
- to explore potential solutions
- to validate proposed solutions
- as the basis for a usability test script
As long as a scenario hews closely to actual data gathered in user research, the actual format can be flexible. You can start from a specific answer to an interview question, such as “I wake up at 8 a.m. on Saturday and read a local news website while the kids run around the house making noise.”
While personas should remain reasonably constant in their characteristics and priorities, scenarios can evolve and deepen over time, and change as your understanding of the system changes. Your personas are the Simpsons, your scenarios are the couch gag.
You can write a scenario as a short text narrative, a step-by-step flow, or even a set of comic panels—whatever is easy for your team to create and use to keep each persona represented in design and technology decision-making. If you find anyone on your team resenting the effort required to work with personas and scenarios, you’re doing it wrong. Simply drawing out scenarios on a whiteboard can work.
Scenarios are not themselves use cases or user stories, although they can influence each. A use case is a list of interactions between a system and a user, and is typically a way to capture functional requirements. Scenarios are from the perspective of the individual human user represented by the persona, not the perspective of the system or business process.
For example: Diane and her family just moved to the area. Her job as an account manager is very demanding during the week, but weekends are family time.
- Goal: She wants to find local activities that will be entertaining for her son and relaxing for her and her husband.
- Motivation: When driving home from the office on Friday evening, Diane saw banners for a new museum exhibit on superstorms. Sitting in her driveway, she Googles the exhibit on her iPhone.
- Task: She needs to determine whether visiting the exhibit will meet her needs.
Stay on target
Developed with care, personas can be the most useful and lasting output of user research. They are the users in “user-centered” and an incredibly efficient and even fun distillation of your ethnographic work.
You will know your personas are working when they become the first people you want to see any new idea. Rather than asking “Does this work for me?” or “Does this make my boss happy?” you can ask “Does this address Dana’s concerns about privacy? Would Neven understand what to do? Would Chiamaka find time for this in her busy schedule?”
Mental Models
All of us carry around a library of mental models in our heads. Without them, every new experience would be a complete surprise and we would have to painstakingly figure out each situation. Using a term from cognitive science, a mental model is an internal representation of something in the real world—the sum total of what a person believes about the situation or object at hand, how it functions, and how it’s organized. This representation is based on a combination of hearsay and accumulated experience. People have mental models of how stoves work, how dogs behave, and what happens at a rock show. (Band plays, band says “Thank you and goodnight,” band waits offstage while audience applauds, band returns to play popular favorites.)
Mental models can be real time-savers for deciding how to behave—to the extent they are accurate. Sometimes there’s no encore. Sometimes you get burned. The first time I rented a Prius, I spent ten minutes sitting in the parking lot because my mental model of “passenger car” didn’t include the hybrid’s innovative ignition system.
In design, “intuitive” is a synonym for “matches the user’s mental model.” The closer an interface fits that image, the easier it will be to learn, use, and navigate. This is a concept with a lot of practical value.
You can use data from user research to diagram the (composite) mental model of each particular user type, and use that diagram to guide the design. This is, strictly speaking, a mental-model model. However, particularly following consultant and author Indi Young’s work in Mental Models: Aligning Design Strategy with Human Behavior (http://bkaprt.com/jer2/08-02/), people in the business tend to use the one term as a catchall. So there are two types of mental models: the type each of us holds in our head to help us deal with the world, and the type designers sketch out to better create that world. For maximum success, be aware of the former and get to work on the latter.
To design an application or a website, think about the mental models of the activities you want to support. If you’re designing a mobile app to help commuters find the best way to get to work on public transit, it’s useful to look at the mental model of “getting to work.” If you’re redesigning buses, you’d want to look at the mental model of “bus.”
As a designer, you have your own mental model of what you’re designing. You also have a mental model of the users themselves, your set of assumptions about what they know and how they will interact with your design. It’s easy to overestimate how well your view matches their reality.
Documenting the user’s mental model allows you not just to get inside their head, but also to get the inside of their head out of your head for everyone else to see. You can use a mental-model diagram to collaborate with your team, prioritize features, better organize information, and identify areas where users have needs that aren’t being served.
A mental-model diagram can help resolve issues that arise if different user types have widely divergent mental models, or if the actual design of the system is significantly different from the one that was originally proposed.
How to create a mental model
Building a mental model doesn’t have to be complicated. Just follow these steps.
- Do user research.
- Make an affinity diagram (see Fig 8.1).
- Place affinity clusters in stacks representing the user’s cognitive space to create the model. These groups will include actions, beliefs, and feelings.
- Group the stacks around the tasks or goals they relate to (Fig 8.3).

Fig 8.3: Mental model diagrams illustrate your users’ thought processes in detail. This information helps you identify relevant and necessary content and functionality.
Conceptual modeling/site mapping
For a new website or service design, you can translate the mental model to a conceptual map that relates content and functionality according to the target user’s view (Fig 8.4). The model will form the application framework or the basis of the information architecture as you proceed into more detailed design.

Gap analysis
If you have an existing product or service, you can use a mental model to identify gaps, or mismatches between what you offer and what the user needs or expects. This will help you design features that fill those gaps.
For example, when designing the app for urban commuters, you might find that their mental model of getting to and from work includes changing plans suddenly based on contingencies like bad weather, local events, or transit-system delays. If your application only offers route suggestions based on optimal rather than actual conditions, you may end up recommending a route adversely impacted by unexpected difficulties.
Reviewing the mental model suggests an opportunity to offer additional information and support that will allow users to anticipate and evade problems, leading to a more successful commute.
On the other hand, you may find out that features you had considered offering don’t fit in the users’ mental model at all. Perhaps you were planning to display after-work entertainment suggestions along the way, but find that this is incompatible with the user’s desire to quickly locate the most efficient route.
Task Analysis/Workflow
Task analysis is simply breaking one particular task into the discrete steps required to accomplish it.
Contextual inquiry is the best prelude to task analysis, but you can also use data from user interviews as long as you’ve collected sufficiently detailed information about how the participants work toward their goals step by step. Any given task has both cognitive and physical components that may be more or less important given the domain and the goal of the analysis. For example, making a complex purchase decision such as buying a new car typically has a series of cognitive activities surrounding identifying the need or desire for a car and conducting research online, as well as the physical component of actually going to the dealership and test-driving the car itself.
From simple to complex and back again
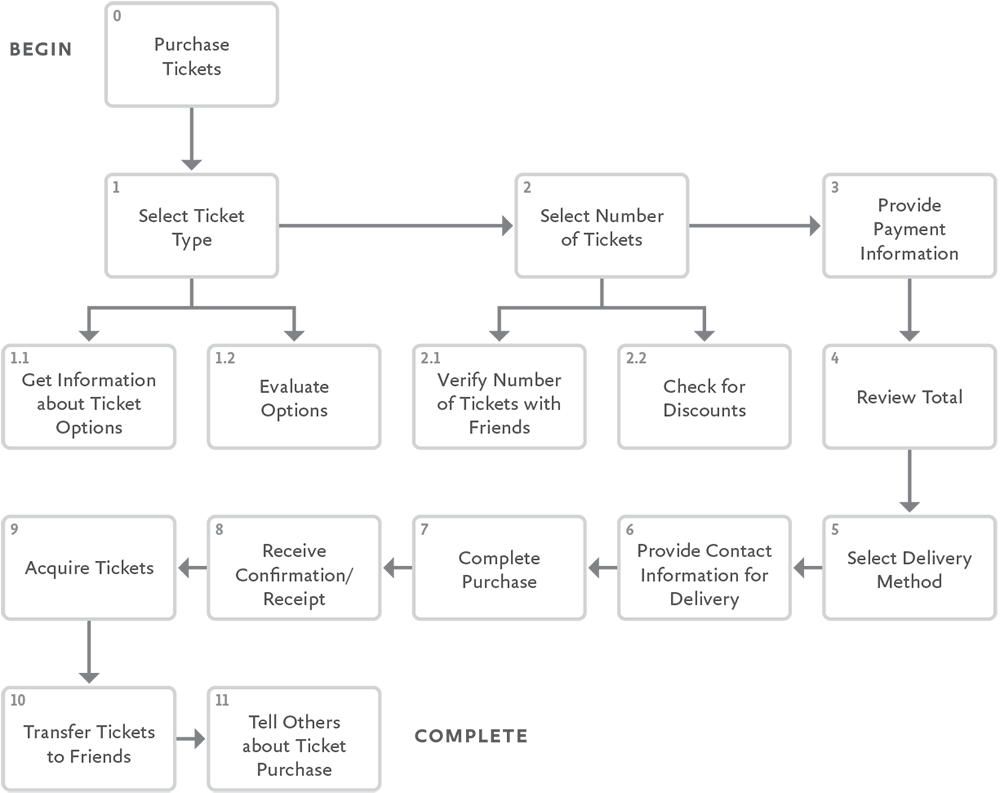
Task analysis can be particularly helpful to map what people do in the real world to functionality you can offer on a site or in an application. For example, “purchasing tickets” sounds simple, but the online process is often a complex and stressful multistep flow with a lot of decision points.
Task analysis can also be helpful when designing any system intended to replace a real-world task with an online interface, or when changing the nature of a physical interaction, as with the shift to mobile devices from desktop-based applications.
Break it down
Using the information from user interviews or contextual inquiry, identify each step the participants reported (or you observed them taking) to complete a given task. Note the initial state, the event prompting the user to begin the task, the information or tools the user needs at each step, and any steps at which the task is likely to be interrupted or resumed. Put all of these steps back together as a workflow:
- Receive postcard advertising fall event calendar.
- Go to website.
- Locate event information on homepage.
- Click on link to see all available upcoming events.
- Identify event.
- Verify ticket availability and price.
- Enter number of tickets desired.
- Enter preferred delivery method.
- Review information and total cost.
- Select “Buy Now.”
- Enter credit card information.
- View confirmation page and instructions for receiving tickets.
Make it flow
In addition to informing the feature set and flow of an application, task analysis will help you identify where specific content might support a user along their task path. Users might take very different paths than you anticipated, or be influenced by particular factors in the environment that you’ll need to consider in your designs (Fig 8.5).
Model Management
This is just a sample of a few common ways to work with the research data and incorporate your findings into design decisions. A little exploration of the UX corners of the web will yield many more. Communicating the meaning and value of research is a design activity itself. And the act of working together to synthesize individual observations will ensure that your team has a better shared understanding than a report could ever deliver.
You may also benefit from the fact that a clear, economical diagram is viscerally appealing. If you’re promoting the value of research among skeptics in your organization, don’t underestimate the accessibility and appeal of your analysis, visualized. And the act of working together to synthesize individual observations will ensure that your team has a better shared understanding than a report could ever deliver.