
Economic value added (EVA)
Strategic perspective
Financial perspective
Key performance question this indicator helps to answer
How well are we delivering value to our shareholders?
Why is this indicator important?
Conceived by the New York headquartered consultancy Stern-Stewart, EVA is an estimate of a company’s economic profit. It is basically the profit earned by a company less the costs of financing the company’s capital.
It is used as an internal governance mechanism for ensuring that meeting, and exceeding, investor expectations is central to directing all operational activities and investment decisions within the organisation.
EVA is a measure of economic profit that exceeds investor expectations, and as such is a performance measure that, by removing accounting anomalies, enables a direct comparison of companies of similar risk profiles. As examples of anomalies, through the EVA calculation expenses such as research and development and training are expensed: according to the theory these are investments and should be treated as such.
Central to the ability to compare performance accurately is the focus on the cost of capital. According to the EVA approach, organisations only make a profit when they take the cost of capital into the calculation of their financial performance. Capital is not free. There is an opportunity cost of capital, in that investors can put their money in many places (for instance into government bonds, the bank or equity markets). It is important to deduct the cost of capital in order to see the actual profitability of the enterprise, so a charge for the cost of capital is made. Capital accounts for both debt and equity. Capital is a measure of all the cash that has been deposited in a company over its lifetime, irrespective of its financing source.
EVA is also used extensively as a measure by which to set and assess incentive-compensation payments to managers. Particularly interesting in this post-credit-crunch world is that the bonus structure encourages the careful balancing of the delivering of short-term financial results and longer-term performance (thus safeguarding the interests of shareholders that have made long-term investments in the enterprise). Moreover, the incentive-compensation approach has been shaped to ensure that managers share the ‘pain and gain’ of investors. As the CEO of one organisation that deploys the EVA incentive-compensation scheme says: ‘We want to make sure that the people who work at [this company] have the same objectives as those who invest in it.’
The incentive-compensation model is based on a bonus bank. Essentially, the bonus bank works like this: each year a bonus is declared depending on EVA improvement versus target and that bonus is deposited into the bonus bank. Typically, one-third of the declared bonus is paid out in that year, with the remainder held ‘at risk’ against future years’ EVA performance.
It should be stressed that employees should be incentivised for EVA improvement over the previous year’s figure, thus ensuring that the focus is on continuous EVA improvement. Also, an important point is that bonuses are not necessarily paid when a positive EVA figure is reported, if the underlying performance has declined. Conversely, a business unit starting from a significant negative-EVA position may be incentivised for improving the figure, although at the end of the year it is still in negative territory.
How do I measure it?
Data collection method
The data are derived directly from the profit and loss statement, while taking into account the charge for the cost of capital and making amendments based on the capitalising of line items that are expensed according to conventional accounting rules.
Formula
EVA equals net operating profit after taxes, minus cost of capital, multiplied by the total capital employed
EVA = NOPAT − (C × K)
Where:
- NOPAT is net operating profit after tax
- C is the weighted average cost of capital (WACC), which represents the rate that a company is expected to pay on average to all its security holders to finance its assets
- K is the economic capital employed
Normally, the equity cost of capital for an organisation is measured through the Capital Asset Pricing Model (CAPM). A firm’s nominal equity cost of capital is calculated as a base risk-free rate plus ‘beta’ – the latter being a general equity risk premium adjusted for a firm-specific risk measure. In short, therefore, the equity rate is the return investors are seeking to achieve when buying a company’s common shares. This is expressed as: the firm’s equity investors’ expected return (future) = risk-free return (future) + the firm’s beta (a relative measure of volatility) × general equity risk premium (history).
The equity risk premium represents the excess return above the risk-free rate that investors demand for holding risky securities. So, with a risk-free rate of 7%, a beta of 1.1 and an assumed equity risk premium of 4%, a company would have the following cost of equity: Cost of equity = 7% + (1.1 × 4%) = 11.4%.
The cost of debt is the rate of return that debt-holders require in order to hold debt. To determine this rate the yield has to be calculated. This is typically worked out using discounted cash flow analysis, i.e. the internal rate of return. The cost of tax should be calculated after tax as follows: Cost of debt after tax = Cost of tax before tax × (100 − marginal tax rate).
Frequency
The EVA calculation is made on a monthly basis. The WACC can be done annually.
Source of the data
The EVA calculation can be extracted from the profit and loss accounts.
Cost/effort in collecting the data
Collecting data for the EVA metric requires a little more effort than other financial indicators. The more of the required data that are already available, the quicker and cheaper EVA can be calculated. If the data are readily available EVA only requires creating a new formula in the accounting system. However, if important data are missing then it can become very expensive to create processes and systems to collect missing pieces of data.
Target setting/benchmarks
Performance to EVA can be assessed by comparing it with those organisations that have similar risk profiles.
Example
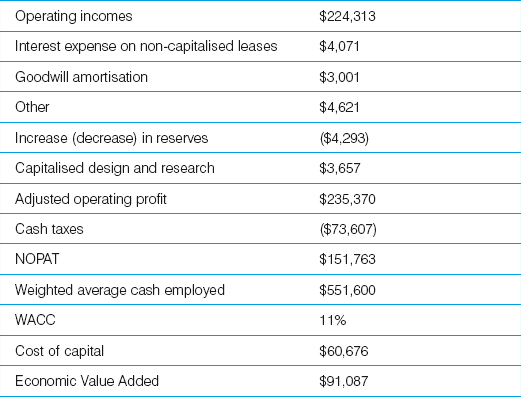
Consider this example from a company that designs, manufactures and markets household furniture (quoted from a case study written by James Creelman for the report Building and Communicating Shareholder Value, London: Business Intelligence, 2000). All figures are in thousands of US dollars:
EVA is used as a way to evaluate the investments that this organisation makes. Taking its packaging line as an example, the line could no longer fully meet customers’ demands and package mix. A new state-of-the-art line would help the organisation gain additional sales and also reduce packaging costs. The combined effect will be a £2.0 million increase in profit after tax (net income). But additional operating capital of £7.5 million is required. Assuming a cost of capital of 11%, the impact on economic added value will be:
Increase in net income (NOPAT) £2.0m
Minus: Capital charge of additional operating capital (11% of £7.5m) £0.8m
Economic value added: £1.2m
Tips/warnings
Implementing EVA is as much a cultural change as it is financial. Organisations must ensure that they create a culture where economic performance is more important than simple profit and loss.
Detractors of EVA state that changing the ‘accounting distortions’ makes it overly complex. For this reason, some companies do not rectify the ‘distortions’, and simply deduct the cost of capital figure from NOPAT, making this a very straight-forward metric.
Moreover, making decisions based on calculated likely EVA returns might put managers off making ‘risky’ investments. Organisations need to understand their risk appetite as well as the projected EVA number.