
Earned value (EV) metric
Strategic perspective
Operational processes and supply chain perspective
Key performance question this indicator helps to answer
To what extent are our projects making the desired progress?
Why is this indicator important?
With the previous two KPIs (PSV and PCV) we looked at the performance level after project completion. Especially for bigger and longer projects it is useful to monitor actual progress to date to get an understanding of where we are compared to where we should be.
To this end the earned value (EV) metric has been developed. EV is a project tracking measure that looks at the cost of work in progress and allows companies to understand how much work has been completed compared to how much was expected to be completed at a given point.
The user guide for Microsoft Project 2003 defines earned value as: ‘A method for measuring project performance. It indicates how much of the budget should have been spent, in view of the amount of work done so far and the baseline cost for the task, assignment, or resources.’ EV basically tracks the percentage of the total project budget actually completed at any given point in time.
In addition to assessing progress to date, EV allows companies to project what the likely costs of the complete project will be, assuming that performance levels remain as they have been to date.
How do I measure it?
Data collection method
Data for the EV metric will be collected from the project management system and requires data for project plan, actual work and work-completed value.
Formula
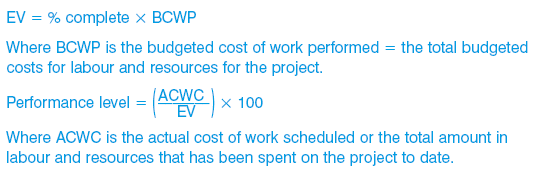
Frequency
The frequency for collecting EV data depends a little on the project type; however, as a rule of thumb, weekly (or for longer projects monthly) assessments would make sense.
Source of the data
The data for this KPI will usually come from a project management software application or any project records.
Cost/effort in collecting the data
The costs for measuring EV can be quite high because of the amount of effort that has to go into updating the records. If the records are updated automatically and sophisticated project management software tools are in place and being used, costs will come down significantly.
Target setting/benchmarks
The benchmarks and targets for this KPI will come from the project plan and the calculations – they will be unique to every project.
Example
The following example1 shows how EV can be calculated and used:
The total cost of Project A was estimated at £600. So far, the ACWP (the cost of the work done on it) is £200, but it’s only 20% complete.
The earned cost is £600 × 20% = £120.
The performance ratio is ![]()
![]()
£200 = £866.67, which is worse than planned and will mean the project is over budget.
Project B was estimated to cost £800. The ACWP is £400 and the task is 70% complete.
The earned hours are £800 × 70% = £560 hours
The performance ratio is ![]()
The predicted forecast is ![]() , which is less than the estimate.
, which is less than the estimate.
Tips/warnings
EV is easily misinterpreted, especially given the rhetoric surrounding this indicator claiming it to be an objective quantitative measure of project performance. It is very important to understand that the EV metric hinges on how project progress is reported.
As with so many KPIs, it is important not just to see the final number of the EV metric but to use the metric as a tool to identify and rectify potential problems in project delivery.
Take the above two EV scores as an example. The data would indicate that project B is doing really well compared to project A. However, one needs to take into account the earned hours and the time performance. For example, the company might have used a more experienced (and hence more expensive) resource in order to reduce the amount of effort needed to complete the task, which could in fact be ahead of schedule. On the other hand, if the task is under budget, lower-value resources may have been allocated, and they may be underperforming.
As EV relies on good reporting and evaluations, it is important to be aware of some possible unwanted behaviours which could quickly skew the data and show better EV scores:
- Schedule projects for longer than actually anticipated, e.g. schedule six-month project time when only three months are needed.
- Putting the easiest tasks at the beginning of the project and the hardest tasks at the end can keep a project EV score looking good for a long time.
- Exaggerate the task completion percentages.
- Etc.
References
www.projectsmart.co.uk/what-is-earned-value.html
http://abirdseyeview.wordpress.com/2008/05/08/earned-value/
www.cioinsight.com/c/a/Past-Opinions/How-to-Lie-with-Earned-Value/
1 Based on example provided by Linda Russell: http://abirdseyeview.wordpress.com/2008/05/08/earned-value/