
Revenue per employee (RPE)
Strategic perspective
Employee perspective
Key performance question this indicator helps to answer
How productive are our employees?
Why is this indicator important?
Employees are not only our most important assets but also usually our most expensive assets. Companies need to make sure that they are utilising their employees efficiently. In general, companies aim to deliver more revenue with fewer employees. This would demonstrate that a company is finding ways to squeeze more revenue out of each of its workers. Therefore, by putting revenues in relation to the number of employees you derive an important ratio of productivity.
Because labour needs vary widely between industries, the revenue per employee (RPE) KPI is most useful when compared with other similar companies in the same industry. Tracking the RPE ratio over time will provide managers with an insight into how well they are able to improve productivity per employee. Comparing RPE between companies allows investors and managers to understand the relative productivity of companies.
How do I measure it?
Data collection method
The data for the RPE KPI are easily collected from the financial statements of a company or the financial management system which will give you revenue data. The number of employees is usually readily available – it might need a little adjustment because you want to include full-time-equivalent employee numbers as part-time positions can inflate the employee numbers and skew the ratio.
Formula
RPE is calculated by dividing a firm’s revenue by its total number of workers:
![]()
Where number of employees are full-time equivalent.
Frequency
It makes sense to align the measurement of RPE with the calculation of revenue figures, with usually happens quarterly.
Source of the data
The data for this KPI come straight from the financial and HR systems.
Cost/effort in collecting the data
The costs for collecting RPE are minimal because all the data are readily available.
Target setting/benchmarks
Ideally, a company wants the highest possible RPE because the higher the number, the more efficiently the company uses its employees.
Even though there are no general rules about what constitutes a good level of RPE, there are some benchmarks available. To create benchmarks in your industry you can go to any business database and look up revenue numbers for companies (e.g. fact sheets for companies on www.hoovers.com). The employee numbers are often included, but if not they can usually be found on a company website.
Here are some RPE numbers for different companies:
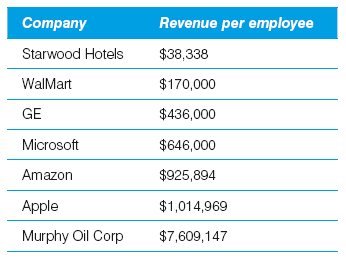
As benchmarks go, smaller companies usually average around $100,000 per employee while Fortune 500 companies average around $300,000 per employee.
Example
Let’s look at the Software & Service Industry and compare Google Inc. (GOOG) with Convergys Corp. (CVG), both listed in the S&P 500. Google with its 20,164 employees generates annual revenue per employee of $1,093,892 and annual profit per employee of $214,768. Convergys Corp. (CVG) with its 75,000 employees, on the other hand, is only able to generate annual revenue per employee of $36,855 and an annual profit per employee of −$1,344.
Tips/warnings
Taking the logic of this KPI slightly further, you could replace revenue with profits and employee numbers with payroll to create an even more meaningful internal indicator of Profit / Payroll ratio.
However, the problem is that the numbers for payroll are more difficult to obtain for your competitors.
Another popular variation of RPE is a salesperson performance ratio of sales per salesperson.
In Working With Emotional Intelligence, Daniel Goleman quotes a study of 44 Fortune 500 firms showing that the top 10% of salespeople had $6.7 million in sales compared to the average salesperson’s $3 million. So, the best salespeople were over twice as effective.
References
www.investinganswers.com/term/revenue-employee-918
www.jbryanscott.com/2009/02/07/nasdaq-100-revenue-per-employee/