
Inventory shrinkage rate (ISR)
Strategic perspective
Operational processes and supply chain perspective
Key performance question this indicator helps to answer
To what extent are we losing inventory along our internal processes?
Why is this indicator important?
Inventory shrinkage refers to the loss of products between the point where a product is produced or purchased and the point where it is sold. Losing inventory will push up costs for the producer and reduce profit margins for them and any retailer, which in turn are likely to be passed on and inflate prices for the consumer.
There are different reasons for inventory shrinkage, such as breakages, administrative errors, misplacement of goods, perishable goods not sold in time, etc. However, what is distressing is that the vast majority of shrinkage is assigned to theft. It is, in fact, estimated that about 44% of shrinkage is due to employee theft and another 35% to shoplifting.
Understanding the level of inventory shrinkage will help companies pinpoint to what extent inventory loss occurs, which in turn will help them to address the problem by adopting known good practices such as improved security, packaging or monitoring.
How do I measure it?
Data collection method
Data for the ISR will be collected by counting the level of inventory the company should have (according to its records of purchase or production) compared to the level of inventory it actually holds.
Formula
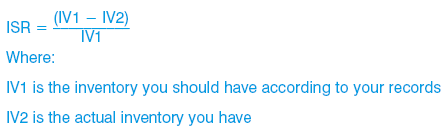
Inventory can be measured either in actual stock-keeping units (SKUs) or in financial terms using average selling prices.
Frequency
In most instances the inventory shrinkage is calculated on a six-monthly basis or aligned to the inventory stock-taking frequency. If automated systems are in place the frequency can be increased to e.g. monthly measurement.
Source of the data
The data for the ISR come from the inventory management system, manufacturing data, purchasing data and stock-taking information as well as sales and shipping data.
Cost/effort in collecting the data
Costs for measuring inventory shrinkage are moderate depending on the level of data already available. Most businesses will have an automated inventory system that allows them to understand the level of inventory they should have. Sales data or stock-taking data will provide the actual inventory, which often requires some manual counting. Manual counting will always push up costs but in many businesses the stock-taking process is a routine process already and not something that will have to be put in place specifically for this KPI.
Target setting/benchmarks
The target should be to eliminate or at least minimise shrinkage. As a benchmark we can look at the total shrink percentage of the retail industry in the United States, which was 1.52% of sales in 2008 according to the University of Florida’s National Retail Security Survey. According to the 2010 worldwide shrinkage survey of the retail industry, the rates vary from 0.72% in the liquor and off-licence sector to 1.81% in the DIY, hardware and building materials sector.
Example
Let’s look at a whisky manufacturer that produces single malt whisky. One reason for shrinkage is that during the ageing process in wooden casks some of the whisky in each barrel evaporates through the oak. The distilleries refer to this portion as the ‘angels’ share’, which increases the longer the whisky ages. For a 20-year-old whisky this can be 40% of the volume. This company produces a 10-year-old whisky which loses about 6% during maturation. In addition, spillage during bottling etc. results in a further 1% shrinkage. The overall shrinkage rate for the manufacturing process is therefore 7%.
Let’s look at their retail shops now and assume they put 2,000 bottles into the shop (their book inventory). They then sell 1,000 bottles in a month and re-stock 1,000 bottles in the same period. So the inventory should be 2,000 bottles at the end of the period. However, the stock count reveals that only 1926 bottles are in the shop, giving an inventory shrinkage rate of
![]()
Overall shrinkage for this company would be 10.7%.
Tips/warnings
ISR as outlined here looks within the company; however, research has found that there is significant shrinkage along supply chains. It would therefore make sense to measure shrinkage across supply chains to understand where shrinkage is most likely to take place and come up with solutions that go across the entire supply chain to benefit all parties.
References
www.detay.com/UPLOAD/brosurler/Barometre_210.pdf
Paul Chapman and Simon Templar, ‘Methods for measuring shrinkage’, Security Journal, 19(4), 2006, 228–240