
Project cost variance (PCV)
Strategic perspective
Operational processes and supply chain perspective
Key performance question this indicator helps to answer
To what extent are our projects delivered on budget?
Why is this indicator important?
According to the Standish Group, 70% of projects are over budget and 52% of all projects finish at almost 200% of their initial budget. There are many famous examples, such as the Concorde supersonic aeroplane, which cost 12 times more than scheduled, the Channel Tunnel between the UK and France had a construction cost overrun of 80% and one of the most famous budget overruns happened at Boston’s ‘Big Dig’ tunnel construction project which was 275% ($11 billion) over budget. The project was originally priced at $2.8 billion. The Boston Globe estimated that the project will ultimately cost $22 billion, including interest, and that it will not be paid off until 2038.
No company can afford significant cost overruns. What’s more, overruns can have not only severe financial consequences but also reputational or legal consequences. For example, the software giant Oracle has recently been sued for an alleged $20 million budget overrun of one of their software implementation projects.
While the previous KPI looked at whether the project was on time, we now look at the budget. Here we will look at the project cost against schedule, which provides information on whether projects are delivered within the planned costs.
PCV is a simple comparison of the planned or scheduled project costs and the actual costs to complete the project. If PCV is zero then the project was completed on budget, if the variance is negative it shows a cost overrun and if the variance is positive it highlights completion below the planned costs.
How do I measure it?
Data collection method
The data collection method for PCV is a simple comparison of the scheduled project costs and the actual completion costs.
Formula
PCV = SPC − APC
Where SPC is the scheduled project costs
And APC is the actual project costs
For overall PCV (a number of different projects taken together) you can simply add the individual project variances together for an actual number or calculate a straight or weighted average variance score.
Frequency
The measurement frequency for PCV is usually monthly but could be monitored more frequently for important short-term projects.
Source of the data
The data for this KPI will usually come from a project management software application or the financial planning applications, if it is not available from manual records.
Cost/effort in collecting the data
If the project costing is available in a system then the effort to calculate project schedule variance is negligible. However, if manual data collection and calculations are required then costs will go up.
Target setting/benchmarks
Actual project costs should be close to the scheduled project costs. The target for PCV should therefore be anything close to zero. Negative numbers will indicate a cost overrun, and positive numbers might indicate weak planning when projects are completed within or below planned costs.
Example
Let’s look at this example, where a division is running three key projects:
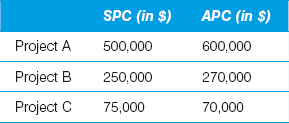
PCV Project A = 500,000 − 600,000 = −100,000
PCV Project B = 250,000 − 270,000 = −20,000
PCV Project C = 75,000 − 70,000 = 5,000
PCV Department = (−100,000) + (−20,000) + (5000) = −115,000
Tips/warnings
For longer projects it might make sense to break the costs down into milestones along the project to ensure that insights are gained as the project continues, to avoid any surprises at the very end.
Instead of calculating the variance between the scheduled costs and the actual costs of a project, some companies prefer to calculate the Project Cost Performance Index (PCPI), which puts the actual costs in relation to the scheduled ![]() . This means that if PCPI is less than 1, the project is over budget. If PCPI is greater than 1, the project is below budget.
. This means that if PCPI is less than 1, the project is over budget. If PCPI is greater than 1, the project is below budget.
Furthermore, it is important to look at project performance KPIs not in isolation but in the context of the other two project parameters (time and quality).
References
http://management.energy.gov/documents/performance_measures_final.pdf
www.ajdesigner.com/phpearnedvalue/schedule_variance_equation.php