
Overall equipment effectiveness (OEE)
Strategic perspective
Operational processes and supply chain perspective
Key performance question this indicator helps to answer
To what extent is our operating equipment effective?
Why is this indicator important?
When a company invests in equipment and machines it wants to make sure that these are effective, i.e. producing the desired output. If not, then as a consequence it will reduce operating efficiency and profit margins.
Overall equipment effectiveness (OEE) is a composite KPI that measures output based on capacity, taking into account process availability, efficiency and quality. It rolls up a number of output losses into a single index which reduces complex production problems to a good and intuitive information source for overall production effectiveness.
Furthermore, the results of OEE are stated in a generic form which allows comparison between process units or businesses across different industries. It should not, however, be used as an absolute measure that provides this one magic number but instead is best used to identify scope for process performance improvement that can be analysed by looking not just at the top-line OEE level but also at the data for availability, performance and quality.
How do I measure it?
Data collection method
Data for the OEE KPI are collected either from the manufacturing system (when automated) or manually by hand.
Formula
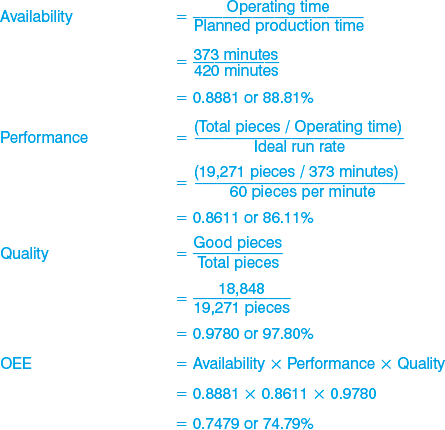
OEE = Availability × Performance × Quality
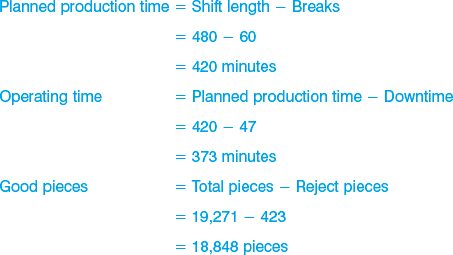
- where availability takes into account downtime loss, and is calculated as: Availability = Operating time / Planned production time;
- where performance takes into account speed loss, and is calculated as: Performance = Ideal cycle time / (Operating time / Total pieces)
Ideal cycle time is the minimum cycle time that your process can be expected to achieve in optimal circumstances. It is sometimes called design cycle time, theoretical cycle time or nameplate capacity. Also, performance is capped at 100%, to ensure that if an error is made in specifying the ideal cycle time or ideal run rate the effect on OEE will be limited.
- Where quality takes into account quality loss, and is calculated as: Quality = Good pieces / Total pieces
Calculating OEE for an entire plant or business can be achieved by creating a straight or weighted average of the individual OEE levels.
Frequency
The OEE measurement frequency depends a little on the circumstances. For individual machines it could be produced on a weekly basis, whereas for larger processes or plants a monthly measurement cycle should be sufficient.
Source of the data
Data for OEE come from the internal operational processes and are either automatically collected or manually recorded.
Cost/effort in collecting the data
Measuring OEE manually and keeping paper-based records will cost a lot of money and effort. However, many manufacturing solution providers offer integrated automatic data collection solutions which reduce the costs and efforts of calculating OEE.
Target setting/benchmarks
World-class performance would be an OEE target of 90%. However, this could be seen as unachievable and unrealistic. A better way would be to base the target on the best actual data for availability, performance and quality taken from historic data on the machine or plant that is subject to the OEE metric. These then become realistic and achievable targets because we know that the machine or plant is capable of that level of OEE.
Example
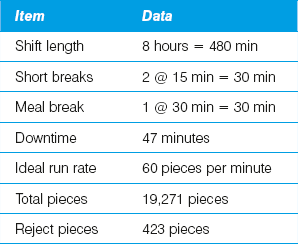
This worked example calculation is based on the table below, which contains hypothetical shift data. The source for this example is www.oee.com. Note that the same units of measurement (in this case minutes and pieces) are used consistently throughout the calculations.
Tips/warnings
As with any more complex or composite KPI, OEE data can be subject to misinterpretation if not understood and used properly. OEE is a measure that provides information that can be used for improvement of equipment effectiveness. This also means that OEE shouldn’t be used as the basis to compare different machines, processes or plants, as this can be misleading. Also, if the focus is to improve OEE as an absolute number, this can drive unwanted behaviours where people simply manipulate the data to improve the final score (e.g. log a breakdown as planned maintenance).
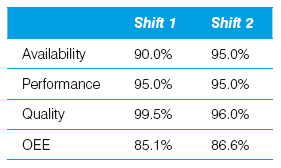
The following example (source www.oee.com) illustrates that comparing two OEE numbers is not advisable:
Source: www.oee.com
By just looking at the OEE data one would conclude that Shift 2 is performing better than Shift 1, since its OEE is higher. However, very few companies would want to trade a 5.0% increase in availability for a 3.5% decline in quality!
References
www.mas-nw.co.uk/resources_local/manufacturing-measurements-kpis/measuring-oee-a-worked-example
http://world-class-manufacturing.com/OEE/oee-calculation.html