
Chapter Seven. Optimize the Whole
There is an old saying in the systems field, “If you divide a cow in two, you do not get two small cows.” Systems have integrity. While they are composed of elements, they are not defined by their elements but by how all these elements function as a whole.
Joe Stenzel1
1. Joe Stenzel, Lean Accounting: Best Practices for Sustainable Integration (John Wiley & Sons, 2007), Kindle loc. 171–73.
“You get what you measure.” This mantra has helped many organizations embark on metrics-driven management initiatives to improve themselves. Certainly measurement is an important part of Lean thinking, but it is just as critical not to choose the wrong measurements or use them in the wrong way since they can harm the overall objective. Stenzel provides a cautionary note: “In a mechanical system one-dimensional quantities can both describe results and enable one to control the linear process that produces those results. In a living system quantities can only describe results, but cannot explain or enable one to control the multidimensional interactions and feedback loops of the process that produces the results.”2
2. Ibid., Kindle loc. 628–30.
Large, complex integrated environments behave more like living systems than mechanical systems, so we need to be thoughtful in choosing the right metrics and to use them in a way that optimizes the whole rather than the parts. In other words, we need to be careful not to read too much into certain metrics that may measure the composite impact of many activities by many individuals at different points in time. This chapter will explore these thoughts and suggest some ways to measure Lean progress to motivate and align an organization’s journey toward successful Lean Integration.
Optimize the Whole Rather than Optimize the Parts
Mary and Tom Poppendieck, in their book Lean Software Development, use the analogy of the Tour de France to communicate the concept of “optimizing the whole by sub-optimizing the parts.”3 The objective of the Tour de France is to complete all 21 stages with the lowest cumulative time. In recent years, no one has done this more successfully than Lance Armstrong. He has never won more than 4 of the stages in any year and has usually won fewer. Yet he won the overall Tour de France with the lowest cumulative time seven times in a row. Certainly, one could win the Tour de France by winning all 21 stages of the race. Lance’s strategy was not to go out and win each stage each day. Rather, with the objective of achieving the lowest cumulative time over 21 days, he chose to pick his spots, optimizing to push hardest when his performance relative to others would have the most benefit, and saving his energy at other times. He sub-optimized the stages with the objective of optimizing the overall race.
3. Mary and Tom Poppendieck, Lean Software Development: An Agile Toolkit (Addison-Wesley, 2003), p. 155.
In the IT and business world, we have a tendency to functionally decompose problems into smaller pieces to make complex problems more solvable. Once these problems are decomposed to smaller sizes, we correctly attempt to solve them. The difficulty arises when we lose sight of the fact that we’re trying to achieve the best cumulative score over all the problems. We’re not trying to optimize to win a single stage, or to solve a single problem. We’re trying to optimize the entire value chain.
Typically, piecemeal metrics do not necessarily cause irreparable harm to enterprises. There is often so much inefficiency in many business processes that shoring up a piece of the process has some value and can be done without harming the upstream or downstream steps in the larger process. But once you’ve handled the low-hanging fruit, what next? Doing harm is certainly possible.
Let’s take a supply chain example and consider how optimizing a part of the process could impact other parts:
• Optimize customer fill rate: If optimizing how often we’re able to deliver on time to our customers is our primary objective, what could happen to our inventory levels and to sales revenue?
• Optimize revenue: If we optimize revenue, costs could go up because “we get what we measure.” For example, we might carry more inventory or use expedited delivery methods in order to increase sales, which would increase costs.
• Optimize market share: If we optimize for market share, what might happen to quality, costs, or longer-term customer satisfaction?
• Optimize inventory: And if we reduce inventory to the lowest levels possible, what might happen to our fill-rate metric and customer satisfaction levels?
Of course, businesses do not necessarily optimize only one metric to the exclusion of all others. But for all the work going on in mission-critical data warehouse environments, how many companies have analysts actually performing these kinds of cross-departmental analytics to see the effects of these different metrics on each other, and for different products and customers in different regions?
This is a powerful concept. It is especially powerful for those who have been steeped in business intelligence, whether on the business side or on the IT side. Years of metrics-driven management and focus on providing those metrics can lead to thinking in terms of the smaller picture rather than the bigger picture.
How do you avoid a strategy of trying to win all of the stages of the race? By keeping the overall objective in mind and ensuring that your continuous improvement efforts and measurements are for the greater good for the long term. You need to avoid getting mired down in localized optimization that frequently ends in internal efficiencies that do not add value from the customer’s perspective. In other words, you need to understand the big picture of how value is delivered to the customer and work to optimize the overall process, not just one part.
Localized Measurements and Knowledge Workers
When we move out of the supply chain example and into dealing with knowledge workers within the Integration Competency Center, the problem gets more challenging. The actual number of parts of the process is extremely hard to pin down and measure. The amount of uncertainty and change is very high. Certainly, there are parts of the process that can be pinned down and measured, but therein lies the problem. We run the very real risk of sub-optimizing the whole by optimizing what we can actually measure. Frequently the parts we can easily measure are the internal efficiencies of the ICC, not the external successes of the ICC from the perspective of the end customer.
When we say “Optimize the whole by sub-optimizing the parts,” some people misunderstand the word sub-optimizing to mean “make worse.” That is not what we mean. The Nobel Prize winner Herbert Simon coined the word satisficing, which may actually be a better word to carry the intent of our meaning. Satisficing combines the words satisfying and sufficing, meaning that in a business environment with imperfect knowledge, incomplete information, yet lots of data and choices, rational decisions are bounded by time, cost, and available good information. So people possess only “bounded rationality” and use “satisficing” to choose the option that will work “well enough” but may not be optimal.4
4. Herbert Simon, The Sciences of the Artificial (The MIT Press, 1996).
What Is “the Whole”? An Introduction to Value Stream Mapping
The first problem, once the concept of “optimizing the whole” is accepted, is to work on defining what “the whole” is. Once again, it is helpful to see the ICC or Integration Factory as a small business within an enterprise that behaves like a market. “The whole” refers to the customer or, in the case of the ICC, the functions that require integration products and services.
One Lean technique that is widely used to assist this process was introduced in Chapter 2: value stream mapping (VSM). This technique helps analyze how material flows and information flows are used to deliver value to a customer. Usually done on paper or a whiteboard, value stream maps begin when the customer makes a demand of the ICC. They end when the solution to that demand is satisfied, thereby addressing the customer’s need. The value stream map is a timeline diagram of the steps that occur between initial request and final delivery.
The objective of Lean Integration is to reduce the lead time by removing non-value-adding activities. When you notice long delays and loop-backs in the flow, a clear picture of muda in the process appears. Creating a current-state value stream map and then a future-state value stream map where the non-value-adding activities in the process are incrementally reduced results in a road map for improvement of the ICC.
How to Create a Value Stream Map
A key advantage of value stream maps is that they can be done quickly and are remarkably effective at highlighting the opportunities for improvement. First, choose a process to map and identify the start and end times from the customer’s perspective. As an example, if we choose to map the ICC’s response to a customer request, we would start the map from when a request is submitted and stop the timeline when the feature is delivered. You would not start the timeline when a feature is approved, because you are looking at value from the customer’s point of view, and customers do not care about other requests or how busy the ICC is.
Next, map the different steps in the process, including those performed by external groups or functions, leading to delivery of that feature. Once that is completed, look at how long it takes to get a feature developed or to fill a customer request. Then examine what percentage of that elapsed time is spent actually adding value.
The value of value stream maps is not in their details or their accuracy. The benefit of value stream maps is that they generate insightful discussions about identifying and eliminating waste in a simple and practical manner. Don’t try to make the value stream map “perfect” since this is an iterative and continuous improvement process. As long as you end up with a picture that identifies opportunities for improvement by capturing data about each of the process steps, you have a useful diagram. Once you’ve made the improvements, redraw the value stream with more details to identify the next set of improvement opportunities.
Some Example Value Stream Maps
For this scenario, let’s say that a call center manager wants to improve call resolution times and suspects that a small number of customers are generating most of the problem. In order to quantify the problem and identify specific high-volume callers, the manager needs to add “call duration” to the customer call history database in the data warehouse. The scenario starts with a business request to add a data element to a data warehouse, from which we can draw the simple value stream map in Figure 7.1. The map shows the steps from initial request by the business sponsor, approval and prioritization, analysis and design, build, test, and finally deployment. Below the diagram we show where and how the time is spent, noting the time spent performing value-added work and the time spent waiting or reworking issues that are not perceived as adding value from the customer’s perspective. Making a calculation of the efficiency percentage of this value stream shows the proportion of value-adding activities to the time spent on non-value-adding activities.
Figure 7.1 Value stream map for an integration change request
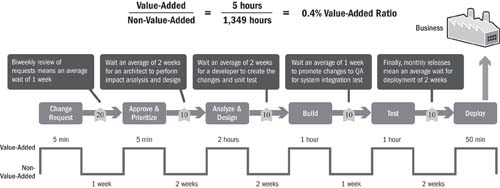
Note the amount of waste that accumulates every time there is either a handoff to another person or team or a review is required before proceeding to the next step. The number in the triangle shows inventory of partially done work accumulating before the next step. Our goal with Lean is to minimize these queues to achieve single-piece flow, or just-in-time, development of value for the customer. The goal is not to achieve maximally efficient use of ICC resources, but rather to achieve the best performance from the customer’s perspective, including delivering fast, high-quality solutions that meet the requirements. An efficiency of 1 percent from the customer’s perspective is typical of organizations that have been optimizing around silo resource utilization rather than end-to-end overall delivery of value quickly.
As the handoffs and reviews create a lot of queuing, how then does the team eliminate queuing without compromising quality? Many reviews performed by internal groups are rubber-stamp approvals that add little value. A common pattern we have seen is that organizations implement a review step in response to a specific incident, which then becomes institutionalized and over time turns into a mechanical process that no longer adds value. Certainly, checks and balances are important, but they should be done within the flow of the activity rather than as batches. For example, developers may be able to work in pairs to solve problems or could be trained and empowered to make more design decisions. Altering the way handoffs and reviews are done is typically a fruitful way to eliminate waste.
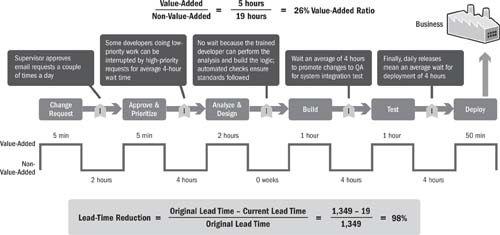
Figure 7.2 shows an alternative value stream map for handling a change request without the queuing, work-in-process inventory, and delays that the previous example showed. Keeping a small number of developers interruptible by higher-priority business requests and enabling those developers to make design decisions (because they have been trained on the standards and best practices to an appropriate certification level) can remove some of the inefficiencies. Furthermore, increasing the frequency of deployments and integration testing at the systems level surfaces problems earlier and allows the release of changes for the business more frequently. This may not seem as efficient from the ICC’s perspective, but this is where process improvements using automation around deployment and system testing (see Chapter 9) help to make this possible.
Figure 7.2 An alternative value stream map for an integration change request
Value stream maps should be created for larger projects as well. Identify the most common products and services that you are delivering to your customers, and create value stream maps when you want to improve productivity or reduce lead times. These value stream maps force a focus on the end-to-end process, “the whole.”
Selecting Metrics to Optimize the Whole
“The whole” must truly be defined from the customer’s point of view. Unfortunately, in many Lean organizations, the definition of the value chain sometimes conceptually ends at the shipping dock rather than at acceptance and use by the customer. “The whole” includes everything from managing expectations through training, delivery, and effective communications throughout the process.
James Womack, in Lean Solutions, describes this consumer-oriented thinking as Lean Consumption.5 Womack articulates six principles that describe Lean Consumption. Think of these principles as if you were a business person who requires products or services from the ICC:
5. James P. Womack and Daniel T. Jones, Lean Solutions: How Companies and Customers Can Create Value and Wealth Together (Simon & Schuster UK Ltd., 2005).
1. Solve my problem completely.
2. Don’t waste my time.
3. Provide exactly what I want.
4. Deliver value where I want it.
5. Supply value when I want it.
6. Reduce the number of decisions I must make to solve my problems.
None of these principles describes the specific attributes or performance of the products themselves. Typically, the product is usually not the problem. We are trying to understand the consumer’s total experience in order to understand the total cost of the situation (including waste) from the perspective of the customer.
If the ICC meets these requirements for the business, the ICC has won the Tour de France. On the other hand, the desires of the business can be at odds with the capabilities, resources, and temporary priorities of the ICC at a given point in time. Keep in mind that these Lean Consumption principles take years of work in the same way that Lean Integration principles are a process of continuous improvement over many years. Lance Armstrong didn’t win the Tour de France when he was 11 years old. It took years of individual and team training and continuous improvement before he began even entertaining the possibility of winning the Tour de France. But from the age of 11, he held out that goal as the objective that drove and aligned his efforts.
In order to make progress toward “optimizing the whole,” it is useful to look at “sub-optimizing the parts” that will have the highest returns. Continuing the Lance Armstrong analogy, where are the mountain stages where it is most useful to apply your efforts to win, because this will give the highest returns toward optimizing the whole?
If we describe our goal as creating products and services for our customers that are better, faster, and cheaper that the alternatives they have, we need some end-to-end customer and operational metrics. Following are a few of the key metrics that should be considered for a customer or operational scorecard.
Metrics for Getting Better (Improving Quality)
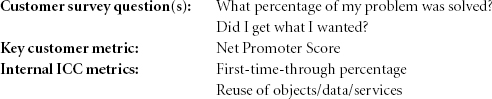
We want to continually improve integration quality from the customer perspective as well as the ICC’s perspective. The Net Promoter Score is a common measure of customer satisfaction; it could be an internal metric for an integration team that has multiple internal customers or could refer to the external customer of the enterprise. This measure was developed by Fred Reichheld in The Ultimate Question,6 which describes a formula for subtracting the number of dissatisfied customers from delighted customers to end up with a net score. The beauty of this method is that you need to ask only one question on the customer survey, such as “On a scale of 1 to 10, to what degree would you be willing to recommend our product/service to your coworkers and friends?” Scores of 9 and 10 are considered promoters, a score of 6 to 8 is neutral, and 1 through 5 are detractors. The formula for calculating the Net Promoter Score over a given time period is
6. Fred Reichheld, The Ultimate Question: Driving Good Profits and True Growth (Harvard Business School Press, 2006).
NPS = (Number of promoters − Number of detractors)/Total number of surveys
Achieving an NPS of more than 10 percent is quite difficult. World-class organizations are generally in the 30 to 40 percent range.
The ICC also needs to continually improve its internal processes to do things “better,” and two of these metrics are “first-time-through percentage,” which tracks the number of projects or requests that are completed successfully without rework, as well as a metric that tracks how successfully the ICC is reusing work to assist completing new work faster and with improved modularity. The team should note every time a defect is found in the integration test cycle that requires a bug fix and subsequent retest resulting in rework. Based on this definition, many ICCs will find a very low first-time-through percentage until their “build quality in” practices (Chapter 10) begin to mature.
Metrics for Getting Faster
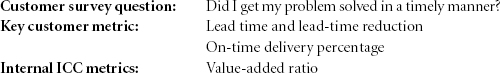
Lead time tracks the elapsed time from the start of a project (usually defined as the time when it was requested by the customer) until its deployment or completion. Lead-time reduction is an improvement metric that could be used to show improvements over time on a trend-line chart. The formulas are
Value-added ratio = Value-added time/Lead time
Lead time = Value-added time + Non-value-added time
Lead-time reduction = (Original lead time − Current lead time)/Original lead time
Tracking how fast the ICC is delivering to its customers is obviously critical to keeping customers happy. If you are tracking the “promise date” of projects or requests, tracking the percentage of tasks that are completed on schedule is a great customer metric. Note that it is most important to deliver “on schedule,” not early or late. Making promises and keeping promises are essential aspects of establishing credibility for the ICC.
Internally, operational metrics around how efficiently the ICC is operating from the perspective of “value-added” time to the “lead time” of the project or customer request helps to track the relative improvements in waste elimination. The value-added ratio is calculated as value-added time divided by lead time.
Metrics for Getting Cheaper (Lower Cost)
Tracking monetary information on integration is difficult if you don’t do a thorough job of keeping track of time or resource consumption for discrete activities. Adding this type of data collection typically imposes its own cost, but it is nonetheless essential in order to drive continuous improvements and to demonstrate the results to your customers. Detailed activity-based cost data is also critical feedback for job costing and estimating tools. It may seem counterintuitive, but the more detailed and specific your data is, the easier it becomes to create estimating tools that produce relatively high-level costs for generic classifications of integrations such as easy, medium, and complex. The end result of knowing how much integration processes cost is worth the time spent. Please refer to Chapter 11 on Financial Management for a more complete discussion of the concepts of chargeback models and on the financial aspects of thinking of the ICC as a business.
One could also take these metrics down to more specific, lower-level measures that are literally driven off of the metadata repository. For instance, it would be nice to tie the survey responses and project names or customer requests to the project names or object names in the actual metadata repository. This way, many of the aspects of the integration process can be tracked and analyzed over time and from multiple points of view, thereby providing a richer fact base for the development of business cases and continuous improvement.
To a certain extent, this chapter is the metrics-oriented chapter. In the Financial Management chapter, we’ll talk about approaches to chargeback models and some more theory behind treating the ICC as a business. But in this chapter, we have focused on what it means to follow the Lean principle of keeping “the whole” in mind and sub-optimizing (or satisficing) the parts.
As with all of the concepts in this book, we are not dictating precise practices for you to follow. Rather, we are outlining core principles to help you understand how you might serve your customers better with the purpose of helping the business to be more successful. You determine your own practices by understanding your own organization and thoughtfully considering your best approach.