
![]()
You now have this marvelous new Raspberry Pi that you have installed and configured to accept and run a version of Raspbian Linux. You have logged in and can comfortably move around within the system. You can do the basics on your Pi, but now feel that you are ready to take on more.
Well that’s what this chapter is dedicated to: teaching you a whole host of commands so that you can empower yourself as a Linux user. These commands will cover a whole host of functionality ranging from becoming the root super user, examining disk space, terminating processes, and configuring your user space and monitoring environment variables. All these tasks are common ones for the systems administrator and can have a big impact on how your system functions. So without further ado, let’s get started.
Become the Boss
Root is a word that describes the base of a tree, something from which all the rest grows. In Linux and UNIX, the term is used to denote the start point of a filesystem (as we saw in Chapter 4) and to denote the master administrative user on the system (covered briefly in Chapter 3). To perform any system or administrative function, you need to be identified as root in order to have permission to change core functionality. Because of this, being root is very much a two-edged sword: unlimited power to change your system and unlimited power to break system functionality. Probably one of the truest things I can say about working in a Linux environment is that eventually you will issue a command as root that will break something (if not everything) and this will cause you no end of hassle or may even require you to reinstall your operating system. For this reason (and related security reasons) its advised that a user never actually login to the shell as the root user.
To solve this problem, we use sudo, which we’ve seen a little of in Chapters 3 and 4. As you know, this tool is a wrapper for any shell command you can think of. This means that if you prefix a command with sudo (e.g., sudo ls) , you will no longer be executing this command as your own user but rather as the root super user. This does make working as the super user slightly more complex, but also far less risky. In fact, many distributions of Linux no longer set a root password, but rather assign a new user the power of sudo on creation. This means that all administration must be done via an empowered user with the sudo command to issue all the requisite admin functions.
So that you can execute as root, sudo requests your user password in order to validate that you are who you say you are, not just someone with access who left their keyboard unattended. In addition to asking all users for their passwords, sudo also has a steering file that governs which users and groups have access to the sudo command and even the capability to limit which programs they can execute via sudo. There is a special command, visudo, to edit this steering file (called the sudoers file) that must be run as root (so prefix with sudo):
$ sudo visudo
This code fires up a special instance of one of the system’s text editors (normally vi or nano) with the sudoers file already loaded to be edited. For a quick runthrough of how to use vi and nano, please check out Chapter 6.
Inside the sudoers file are a number of things that control how the sudo environment works, including a PATH variable (which we will cover later). The important thing, however, is the line down in the userauth section that looks like this:
root ALL=(ALL:ALL) ALL
This line states that the root user on all hosts can access all commands on all other hosts (a host is a server on the network). This is a bit confusing, but it basically grants full access to any user that can identify itself as root. There is also another line:
%sudo ALL=(ALL:ALL) ALL
This line says that members of the sudo group can also do the same things as the root user: accessing from all hosts on the network all commands that can be executed on all hosts on the network. You will notice the leading % that is used to signify that this is a group name. The basic format of one of these lines is this:
<user> <From which hosts>=(<On which hosts>:<which commands>) < command options and commands >
This syntax is a bit confusing at first so let’s have a look at creating a particular set of permissions for your pi user as an example. First we will need to create a new basic set of user permissions that will look just like the root users, but will instead refer to our pi user. This line will look like:
pi ALL=ALL ALL
I have removed the <on which hosts: which commands> section and replaced it with one generic ALL to make things a bit easier to understand. Now let’s say that we want the pi user not to be asked for a password. To do this, we add a NOPASSWD: before the final ALL that represents commands. This gives us a new line:
pi ALL=ALL NOPASSWD: ALL
If you add this now, you can run all commands as the pi user without needing to even provide a password. This is a very dangerous command, so let’s modify it slightly to make it only the visudo command that can be executed. To do this, we replace the final ALL for commands with the command we wish to use, which in this case is visudo. But we can’t just write visudo, we need to provide the whole path to the application, which is /usr/sbin/visudo. So we get the following:
pi ALL=ALL NOPASSWD: /usr/sbin/visudo
Now you should be getting the idea of what you can do within the sudoers file to control how the sudo command is accessed. You can have multiple entries that govern how these commands can be run, by whom and under which conditions. There is also a large amount of functionality for adding aliases, which can be large combinations of commands, hosts, or users. Much of the syntax for these commands is available from the manual for sudoers.
Finally, one last command for you to be aware of is the su command, which is short for switch user. This command does exactly what it implies and switches which user you are, and if you aren’t root it will prompt you to enter the password of the user you wish to switch to. One of the niftiest cheats for gaining root access is to combine sudo and su to switch into the root user, with only the current user’s password instead of the root user’s. This command is the way that many people get round the “no known root password” limitation placed by many Linux distributions:
$ sudo su –
The minus sign denotes that you wish to gain a login to the environment, and because no other arguments are provided, it will attempt to log in as the super user. You can also use this to switch users by adding the username for a given user prior to the minus. You can also use the sudo command with the –i option to gain an interactive shell that will achieve the same thing:
$ sudo –i
RTFM
One of my favorite refrains from the tech world is RTFM, which is short for Read The Flaming Manual. While I have found that asking people for assistance is good, it’s always comforting to know that there is a manual you can read, and Linux is no exception. Most applications come with a manual document that can be accessed by using the man command! This command takes whatever you wish to get the manual page for as its first argument. So, if you wanted to look at the manual page for the sudoers command in order to get a better idea of how to write your sudoers file, you would type this:
$ man sudoers
And then the manual page would appear. Navigating a man page is done in the same way one would navigate a document opened with less (which is a command we will cover further on in this chapter), so navigation is done with the arrows and with page up and page down keys. You can also search for a string by pressing / and then typing what you wish to search for. The n key will help you navigate your way through the file. So, if you ever find yourself in need of some more information on a command, remember to Read The Flaming Man Page!
One of the key things that a systems administrator will need to do is monitor the usage of resources on his system. While some of these commands may be of less use to your average Pi user, there are some times when being able to see what your system is doing will come in handy.
The first system command to be aware of is top, which is a command for displaying the current usage of resources within your system and displaying which processes are consuming what level of resources. The top command is incredibly powerful and displays a whole host of information about your systems resource usage. The output of top normally looks like Figure 5-1.

Figure 5-1. Top in action!
The output from the top command is huge and if you watch, all the values there are updated regularly. Let’s go over the top output line by line so you can understand what you are looking at.
Uptime and Load Average
The first line gives information about the current time and then uptime of the system. It then shows the number of users on the system and finally the load average. Load average is one of the most complex things to understand; it is a “meta” variable because it refers to what is going on within your system relative to your system’s capability to perform. It contains 3 values that give the average of the current minute, the last 5 minutes and the last 15 minutes. Load average represents the average of actual computation usage and demand for your system’s computation resources.
Probably the best way to think of load average I have heard is as a freeway. Normally the percentage value of CPU usage represents how much of the current available computation resources are being used. This is akin to measuring how much traffic is currently on the freeway. The load average compares both how much computation is being used and how much demand there is for CPU usage. This is like examining both the freeway and its onramps. The difference between the two comes when looking at it from the perspective of a “busy lunchtime,” meaning that there are lots of cars on the freeway, but just because “it’s a busy lunchtime,” everyone can get onto the freeway and use it, nobody is stuck waiting on the ramp, and traffic is flowing nicely.
This is why load average is such a powerful metric; it allows you to see demand for your system’s computing power in real time so that you can see when your demand begins to spike and can thus take action to lower demand.
Wow, that’s a lot on just one line!
Tasks
The second line of the top output lists the tasks that the system is currently performing:
- The total number of processes
- The number of actively running processes
- The number of processes that are sleeping in the background
- The number of stopped processes
- The number of zombie processes
Most of these processes are general purpose for being aware of what is going on within your system. But zombie processes can be a real problem. These processes are processes that have finished executing, but are still resident in system memory—often because they need to send a return value to the process that spawned them, but are yet to do so and thus must wait there as the living dead before they can send their final message and depart to the afterlife.
Having a long running zombie process can indicate a problem with the application that is used to spawn it, which is called its parent. If you see zombie processes on your system have a look to see which process spawned them and check over its running state and log files (log files are output from applications that are written to disk, so you as the systems administrator can see what they are doing), as this may be indicative of a larger issue.
CPU Utilization Percentage
The third line of the top command is the CPU utilization percentage value. This shows in terms of percentage how much of your current computation resource is allocated to which domain of your system. The values are the following:
- us (for user applications)
- sy (for system applications)
- ni (for processes that have been “niced” in order to give them more or less CPU priority)
- id (representing idle)
- wa (for processes that are waiting for I/O completion)
- hi (for processes waiting for hardware interrupts)
- si (for processes waiting for software interrupts)
- st (which indicates time stolen by a hypervisor—a hypervisor is software that runs a virtualization platform like Xen or VMWare ESX)
Of these values, the one that will normally have the most computation resource allocated to it is id, which represents free available computation that can be used elsewhere. Seeing high values of wa, hi, si, or st are never good signs as they suggest that your system is waiting on a particular piece of hardware or another function to finish processing. If these numbers stay high, you should look at investigating which processes cause them and see if you have any hardware issues.
Memory Usage
Lines 4 and 5 represent the memory usage of your system. Line 4 is for the actual memory usage, and line 5 is for the swap space usage. Both of these lines will show the total, used, and free memory in their given space. This final value represents the buffers and cached value. These two are interrelated and are the cause of much concern for users new to Linux. This hass to do with the way that RAM is allocated. Linux can sometimes take up all available RAM and place it into a buffers, which means that it is taken by the buffers but can still be used later for your applications. Linux will treat this RAM as being used, but it is just sitting there in the buffers waiting. The buffers value can be a little hard to understand; this leads to another command showing how these resources are used (I will cover it next).
After the fifth line there is a large section that contains a process table, which lists all running processes and, in near–real-time updates, which processes are consuming how much of which resource. The following shows a number of different columns and the pieces of information they represent:
- PID: The processes’ ID number
- USER: The user who owns the process
- PR: The priority of the process
- NI: The nice value for the process
- VIRT: The amount of virtual memory consumed by the process
- RES: The size of actual resident virtual memory
- SHR: The amount of shared memory the process is using
- S: The process status (e.g., sleeping, running, zombie)
- %CPU: The percentage of CPU consumed
- %MEM: The percentage of RAM consumed
- TIME+: The total CPU time the task has used since it started
- COMMAND: The actual name of the command
top also has a host of keypress actions that can manipulate the order in which these processes are displayed; you can check them out in the man page for top.
So top is a fantastic command for showing all the ins and outs of your system’s resource usage and one of the best tools for diving into the exact nature of what your system is doing within itself.
Using free to View Memory Allocation
As mentioned earlier, there is an easier way than using top to see what your memory allocation is like. The command to do this is the free command, which you can invoke with the unit you wish to have it display in (−k for kilobytes, -m for megabytes, -g for gigabytes, and so on). For our purposes. megabytes is best, so invoke it as follows:
$ free –m
Your output should look like Figure 5-2.
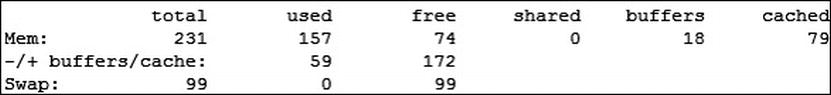
Figure 5-2. Free as in free
From this, you can see the +/− buffers and cache line that change the used and free values. This is a great way to question any time your system shows spikes of memory up to 100%, as it just may be lots of buffers and cache in action. From these two utilities you should be able to gain great insight into exactly what is going on within your system and how its resources are being used.
Now that we have looked at CPU and RAM usage, which are fairly dynamic, it’s time to have a look at something of a more static nature, disk utilization. In most operating systems you can quickly and readily view how much of the available storage space is in use, and Linux is no exception. The command to show the current usage of the whole system’s disks is df, which is short for disk free and can be used on the command line with no arguments to show everything you need. If you do, your output will resemble Figure 5-3.
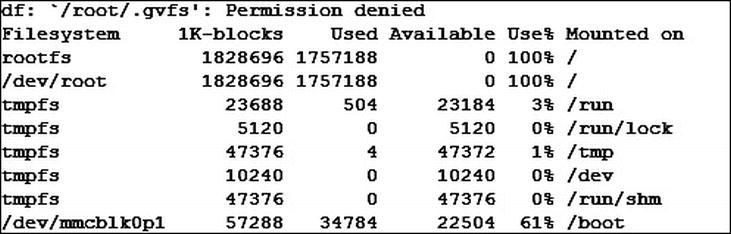
Figure 5-3. Disk free, ouch!
Figure 5-3 shows disk free in action and shows that the main rootfs mounted on / is basically 100% full—ouch. You can see the number of 1 k blocks being used by the system, but the values don’t stand out very easily. You will also note that there is a permission denied error at the top.
Fortunately, there are solutions for both these issues. First is to run this command with sudo so that it has root access to the whole system. The second is to add the –h argument. This argument is fairly universal in being one of two things: either –h for help or –h for human, which is to say human readable units. So we run this command:
$ sudo df -h
The output should be much more understandable to the average human being (see Figure 5-4).
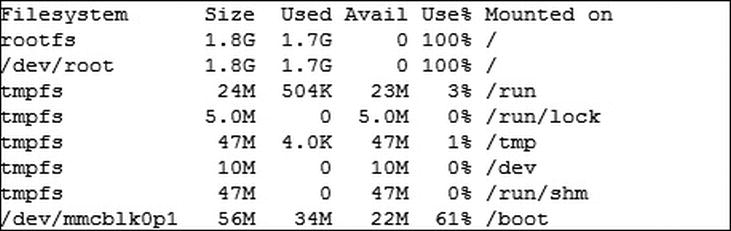
Figure 5-4. df for humans
As you can see, the human readable flag has changed those Size and Used values over to a human readable number with a nice little flag on the end denoting unit. Experimenting with display flags is a great way to help you make sense of some of the complex data coming out of Linux commands. Normally you will find a huge section detailing (in way too much depth) all the flags for a command in its man page.
So, we have seen the full disk utilization of the system, but let’s say we want to find the detailed utilization of all the files in a folder. There is another command we can use to do just this: du, which is short for disk usage and is used to summarize the disk usage of each file, recursively for directories. If you run du, it will tell you what the estimated usage of each file within this folder is and that of each subfolder and each item within it and its subfolders, and so on. du will also take advantage of the –h for human flag that was in df. So if we run it, we get an output like this:
$ du –h
4.0K    ./.cache/dconf
12K     ./.cache/menus
576K    ./.cache/midori/web
4.0K    ./.cache/midori/thumbnails
24K     ./.cache/midori/icons
608K    ./.cache/midori
4.0K    ./.cache/openbox/sessions
12K     ./.cache/openbox
640K    ./.cache
12K     ./.dbus/session-bus
16K     ./.dbus
5.0M    ./.tor
12K     ./.ssh
1.8M    ./python_games
8.0K    ./.dillo
20K     ./.vnc
4.0K    ./.gvfs
124K    ./.gnupg
8.0K    ./.fltk/fltk.org
12K     ./.fltk
48K     ./Desktop
8.0K    ./.config/lxpanel/LXDE/panels
16K     ./.config/lxpanel/LXDE
20K     ./.config/lxpanel
8.0K    ./.config/pcmanfm/LXDE
12K     ./.config/pcmanfm
8.0K    ./.config/lxterminal
28K     ./.config/midori
4.0K    ./.config/enchant
28K     ./.config/openbox
104K    ./.config
76K     ./.fontconfig
16K     ./.netsurf
40K     ./.local/share/gvfs-metadata
36K     ./.local/share/webkit/icondatabase
40K     ./.local/share/webkit
88K     ./.local/share
92K     ./.local
9.0M    .
Wow, that’s a big output for such a simple command. It shows the utilization of every folder within the current folder, and right down the bottom it shows the total usage. This is where we can take advantage of another flag in order to shorten the output: the –s flag that stands for summary. Doing this will only print the total allocation for this directory and all within it, rather than everything as we have just seen. So go ahead and execute the command; your output should look much neater:
$ du -sh
9.0M    .
That’s much better. You will notice that the output is using the . value to denote the current directory because du will work on the current working directory if not told where else to look. You can specify a directory to use by simply adding one to the end. The next example will look at /var/log, which is where all system logs are kept, so we will need to run this command as root using sudo as some of these logfiles are protected:
$ sudo du -sh /var/log
9.8M    /var/log
And there you have it! With these two utilities, you can find out the current disk usage of your system and even work out which parts of your system are consuming the most space.
Probably one of the most important tasks when working within a Linux environment is knowing how to manage running processes. After all, a computer is just a processing system, and if you can’t manage what it is processing, how can you make truly good use of your machine? The first command you should become aware of is the ps command. The ps command is short for processes snapshot and can be used to list all the current processes being run by your user; when invoked, you should get an output like the one shown in Figure 5-5.

Figure 5-5. Current processes
Yes, it’s a little lackluster right now as I am only running two processes: the bash application that is running my user shell and the copy of ps. Since this is a snapshot, the application will always capture itself. This is useful if I want to control those processes run by my current user, but if I am to do more, I will need to add some arguments to my ps command. The argument to show every process on the system in the standard syntax is –ef, so go ahead and run that and see how your output changes (see Figure 5-6).

Figure 5-6. ps –ef
Wow, that’s a lot of output, so much that it went off the top of the screen! There are always a large number of processes running on your system when you run ps –ef as this lists all the systems background processes along with all user processes. If you want to see them in a list, you can simply add a | less to the end of your command, which will let you go up and down and manipulate the list (I will explain what the less command actually does a little later in this chapter):
$ ps -ef | less
ps is a lot like top, but does require fewer resources and has a few other advantages that we will cover later in this chapter. For now, you should just be aware of what each of the columns in ps means:
- UID: Represents the user who owns this process
- PID: Represents the process’s PID number
- PPID: Represents the PID number of the process that created this one
- C: Represents CPU utilization of this process
- STIME: Represents the start time of this process
- TTY: Represents the terminal controlling this process
- TIME: The cumulative CPU time consumed by this process
- CMD: The command-line argument of this process
So you might be saying, “Well fine. You have shown all the processes in the system, but what can I do with them now?” This is where the magic of ps comes in; it makes it very easy for us to pick out the PID of a particular process. The PID number is very important as it is a unique number for each process and is the way that the system references processes. This will come of use in our next command: kill.
Killing a Process
kill is used to do exactly what its name implies: kill processes. But it also provides a number of other useful functions via the mechanism through which it kills processes. In Linux and UNIX, a signal is a low–level system message that is passed into an application from the operating system. Signals have no actual function beyond being a signal, and it is up to the application to respond to it in the correct manner. This is not true for all signals, as some cannot be handled within the application, but it is true for most. The function of the kill command is to send signals to applications. There are 64 signals that the version of kill on Raspbian can send to an application. To list them all, issue this command:
$ kill –l
I won’t list all the functions of the signals now, but you will need to be aware of these, the most common signals:
- Signal 1 (SIGHUP): Short for hang-up. Tells the application to hang up its current connection. Normally used to make an application reinitialize itself.
- Signal 3 (SIGQUIT): Signals that this application should gracefully close itself down and quit.
- Signal 6 (SIGABRT): Signals that the program is aborting; it is to close immediately.
- Signal 9 (SIGKILL): Signals to forcibly “pull the plug” on an application.
These signals are the most common as they are used to perform application shutdowns, with nine being the most prevalent. The format of the kill command is this:
kill –<signal> <PID>
So to kill a process with the highest force, execute this:
$ kill −9 <PID>
This is the point where those PIDs out of the ps command come into play. Those PID numbers are the ones that you will feed into kill in order to direct the signals from kill.
Since we are playing with PIDs, it’s probably good to revisit the /proc filesystem, first discussed in Chapter 4. This is part of the OS in which all the process information lives. If you use ls /proc, you will see a number of files and a set of numbered directories. These directories correspond to each of the process PIDs. If you look within one of these directories, you should see a whole host of files that relate to a given process. While you should never edit any of these willy-nilly, there are some files within these directories that are very useful.
Probably the most commonly used is a system-wide file that contains information on all the system’s processors. This is the /proc/cpuinfo file. You can output the contents of a file to the screen using the cat command, which is short for concatenate and is normally used to get the contents of a file into a buffer (in our case, it is the console screen). Go ahead and issue this:
$ cat /proc/cpuinfo
Your output should look like this:
Processor       : ARMv6-compatible processor rev 7 (v6l)
BogoMIPS        : 697.95
Features        : swp half thumb fastmult vfp edsp java tls
CPU implementer : 0x41
CPU architecture: 7
CPU variant     : 0x0
CPU part        : 0xb76
CPU revision    : 7

Hardware        : BCM2708
Revision        : 0003
Serial          : 000000007a8a46ba
This is the Linux internal information on the Raspberry Pi’s processor. If you are ever in doubt on some of the particulars of your processor, this is the place to look.
In addition to cpuinfo, there is another file within /proc that you can take advantage of when diagnosing system configuration information. It is the /proc/<pid>/cmdline file. This file lists the full command-line argument used to invoke a process. If you need to get your hands on the commands used here, executing cat against this file is the best way to do it.
File Commands
As mentioned earlier, you can use the cat command to output the contents of a file. There are a number of other tools you can use to work with the contents of files within your system. The first is one that was mentioned earlier: the less command. It is a command to display the contents of a file to the screen in a way that can be moved around and searched as if it were a text editor. This is a great command for working with logfiles or the output of long commands such as ps. less allows you to move up and down the file with the arrow keys or with the page up and page down keys. You can also search using simple word searches by typing / and then entering your search string. less will then highlight the found instances of your expressions, and you can tab between them with the n key to go down and the N key to go up.
In addition to being able to search within a file for things, less has the ability to watch the file and constantly display any new content on the last line. This is great for watching growing logfiles as you can pick up new lines without needing to reopen the file, to get less to perform this function, simply press the F key. Along with this, you can also automatically navigate to the end of a file by pressing the G key. This process will also grab any new lines that have been added to the file and display them. You can also use the lowercase g to navigate to a specific line number, so if you wish to go to the first line, would press 1g. Finally, less is able to respond to all of its command-line arguments within itself. This is useful for enabling line numbers as you can simply give less the command –N<enter> and it will display numbers next to each line.
After less, one of the commands that provide a startling amount of flexibility is the find command, which is used to find files. It does this by examining every file within the given directory and all of its subdirectories. find is useful on its own, but extraordinary when paired with other commands as you will see later. It also has a healthy cache of options that are interchangeable and can also be combined. I will cover a few that I have found incredibly useful here:
- The first is –L, which says to follow symlinks, which find does not do by default.
- Second is –maxdepth <number>, which represents how many directories deep this command will search through. Just the one? Just this and all its subdirectories?
- Third is –newer <file>, which shows anything that was changed more recently than a given file.
- Fourth is –empty and it, as its name implies, finds empty files.
- Fifth is –atime <number>, where the number represents the number of days that have passed since a file was accessed.
- Sixth is –name <filename>, which searches for files named exactly like the name passed in.
- Last is exec <command>, which tells find to execute a given command on each of the files and is where the real power of find comes out. You can use this command to find specified files and then execute commands on them. In this way, using find is a fantastic way of executing a cleanup of older unwanted files for instance. I’d also advise that when using find in this manner you should test first and test thoroughly because one incorrect key stroke could spell doom for your system or your data.
Combining these commands, you can achieve something that looks like this:
$ find /mnt/Volume1 –empty –name fooBar –exec rm
This command will find all empty files within /mnt/Volume1 that are empty and named fooBar and then remove them! There is so much power in the find command that you can harness when administering your Pi.
Another command that has a significant if limited use is the file command. The file command is used to go through the contents of a given file and determine what “kind” of file it is. Kind is a bit of a loose term here because file knows only a moderate number of different file types. However, it is fantastically useful when you want to know an answer to this question: “Can I safely open that file in a text editor, or is it a binary application?” This particular command can save you much heartache. You can also use file to determine which archival format an application is written in, which is a great help when you need to extract from an archive but don’t know what kind! As an example, if you run file against a binary executable such as /bin/bash, you should see the following:
$ file /bin/bash
/bin/bash: ELF 32-bit LSB executable, ARM, version 1 (SYSV), dynamically linked (uses shared libs), for GNU/Linux 2.6.26, BuildID[sha1]=0xe370a0be978f49569f115c9f41bc54688be9fe32, stripped
The code shows that the file is an ELF 32-bit LSB executable compiled for an ARM system, so the file should be compatible with your Pi. This is a good way to diagnose any issues you may have with applications downloaded from the Internet because they may be compiled for x86!
The last file command I have for you in this section is one of those commands that many people hate and many more love: grep . grep is short for Generalized Regular Expression Parser and is best known as being a pattern matcher. Like less and find, grep is both useful on its own and useful when combined with other commands. You can use grep to search a given file for any lines that contain a given text string. The basic format of grep is this:
grep <pattern> <file>
Both these values will take the wildcard format, so you can use grep to search through every file in an entire directory for a string. As an example, let’s look for the word find in the /etc./init.d folder:
$ grep find /etc./init.d/*
The output would be this:
/etc./init.d/checkfs.sh:# Include /usr/bin in path to find on_ac_power if /usr/ is on the root
/etc./init.d/checkroot.sh:# Include /usr/bin in path to find on_ac_power if /usr/ is on the root
/etc./init.d/kbd:            LIST_CONSOLES='cd /etc./init; find -name 'tty*.conf' -printf '%f ' | sed -e 's/[^0-9 ]//g''
/etc./init.d/kbd:            # eventually find an associated SFM
/etc./init.d/nfs-common:# particularily heavy daemon, so we auto-enable it if we find an /etc./exports
/etc./init.d/rc:# Now find out what the current and what the previous runlevel are.
/etc./init.d/sudo:                find /var/lib/sudo -exec touch -t 198501010000 '{}' ;
grep also has some wonderful command-line options, including –i, which makes the search case insensitive. grep also has the –v option. which turns a search on its head and returns everything not matching the given search string! This should give you an idea of how powerful a tool grep can be when you wish to find a given piece of information and thus why it is an awesome part for a systems administrator’s arsenal of commands.
Combining Commands
Now we get to the fun part! The ability to combine commands so that you can use the output of one command and give it to a second command to work with. There are also a number of commands that I will detail here as they are fantastic when combined with others. But first you need to understand how to combine commands and thankfully it is a rather easy thing to accomplish. To combine commands, we use the pipe symbol (|).
Yep, it’s that simple. Let’s say we wanted to grep some things, but wanted the output in a more manageable way. We would simply write the grep, add a pipe, and then add a less. By doing this you will find yourself inside less looking at the output for your grep! This is where the fun truly begins. Want to search all the filenames in a given directory? Use ls to list the files and pipe the output to grep to search. In this instance, you don’t even need to include a filename with the grep as the pipe will provide grep with what is known as a buffer that grep will treat the same as file contents! So the command is this:
$ ls <directory> | grep <search string>
Now, if you want to play more with things, you can combine grep with ps –ef! In this way, you can search for a specific application; for example, to search for the SSH application sshd,we would run this:
$ ps –ef | grep sshd
This will generate the following output:
root      1722     1  0 19:24 ?        00:00:00 /usr/sbin/sshd
root      1956  1722  0 19:43 ?        00:00:00 sshd: pi [priv]
pi        1963  1956  0 19:43 ?        00:00:01 sshd: pi@pts/0
pi        2030  1964  0 20:33 pts/0    00:00:00 grep --color=auto sshd
Ah! There’s a problem! We seemed to have caught our own grep in the command. But that’s no problem we can simply pipe again to grep and do a –v for grep, which will return us every line without a grep. This gives us the command:
$ ps –ef | grep sshd | grep –v grep
This gives an output of this:
root      1722     1  0 19:24 ?        00:00:00 /usr/sbin/sshd
root      1956  1722  0 19:43 ?        00:00:00 sshd: pi [priv]
pi        1963  1956  0 19:43 ?        00:00:01 sshd: pi@pts/0
Much better! Now you can begin to see what we can accomplish with pipe, but I am far from done with the things you can use this for! Let’s introduce the next command: awk. awk is a tool for doing data extraction from a line of text. In this way, you can pull all kinds of information out of whatever commands you’re running. By default, awk will pull each element out by splitting on whitespace, which is any tab or space between characters. You can set the character to split against using the –F <delimiter> argument. Once you have told awk how to break your text, you will need to output it. awk has an entire syntax for outputting commands, and it is an incredibly complex art form.
However, for most of your needs, simply printing the correct field will do. All awk outputs are wrapped in curly braces { and }, and you will normally need to wrap them in single quotes so the command line will ignore any spaces. This means the basic syntax looks like this:
$ awk '{ <command> }'
The most useful command for anyone working with awk has to be the print command because it is used to display the delimited variables. Each of these variables is treated as the number it is in the sequence, so $1 for the first, $2 for the second, and so on. Using this we can combine the awk with our ps –ef from earlier to print out the second space delimited field, the PID! This gives us the following command:
$ ps –ef | grep ssh | grep –v grep | awk '{print $2}'
Wow, these commands are getting long! But examine the output of this command:
1722
1956
1963
Aha! The quick among you will realize what is coming next! We can pipe this to kill! In this fashion, we can use a ps, grep, and awk to grab only the PIDs of processes matching a given pattern and then pass them off to be killed!
xargs to Work with Each Result
This is one of those pieces of magic that never gets old; however we can’t pass a list of PIDs directly to kill because we want them passed one at a time. To do this, we need to take advantage of another command, xargs, which works the same way that the –exec does in find. It allows you to treat each line of output from the commands before as an individual argument for another command. To use xargs, we simply have them wrap the command in the same manner sudo does. So if we wanted to pass each of those PIDs to xargs via kill, we would simply run the following and that would be it:
$ ps –ef | grep ssh | grep –v grep | awk '{print $2}' | xargs kill −1
In this case, I will not be killing off my sshd process as I don’t want to reboot my Pi. But you should get the idea of how you can begin taking output from one command and passing it through to another command to run further executions on these commands.
There are actually a number of other commands that come in really handy when doing these kinds of “shell-fu.” The first is wc, which is short for word count. By default, wc will give you the newline, word, and byte counts for a given block of text or file, but it also has some great arguments, such as –l, which will give you the number of lines; –w, which will give you the number of characters; or –m, which will give you the number of words.
Next is sort, which sorts each line of the output into order. You often see sort paired with uniq, which is short for unique. With these two, you can pipe an output to sort then to uniq, and you will have only the unique values in your given output!
The final thing to be aware of when working with a number of commands is the output operator >. This operator is from the same family as pipe, but instead of being used to direct your command output to another command, it is used to direct your output to a file. This is a great way to save the output of commands to a file so that you can revisit it later or to have it useable as arguments for another command. By now, you should be getting the impression that the shell is incredibly powerful and you can do all kinds of tricky manipulations by combining commands with pipe!
We are going to take a small break from examining commands and have a look at some of the things that make up the environment in which you work. Your environment is launched every time you log in, and each time is the same. This is due to a number of files and commands that provide directives on how your simple shell environment is to be made up and how it is to function. One of the key files involved in performing these tasks is your systems master controlling environment script /etc./profile. This file provides the basis of the shell and environment variables that are the base of each user’s session.
The profile file sets a number of variables, including the PATH variable. This variable is one of the key variables in setting up how your shell environment works. So we will have a look at it in depth.
The PATH is one of (if not the most) important variables in your whole environment. It represents the systems search path that basically means where it will look for applications. As an example, I am sure that by now you are aware that all the commands we have run are just words entered into the shell, but in fact they are the names of fully functional applications that are located within the OS. The PATH contains a list of folders that your shell will search through and execute any command from within automatically. This means that you aren’t always searching for the exact path of a command; you can just run it as needed by its name. The problem here is that you cannot be certain where the program is being run from, or if you have multiple versions, which one is being run. There is a command that solves this problem: the which command. It outputs the path of the application that your shell would use to execute a given command. For example, let’s find the path of the ssh application, we type which ssh and we get this:
$ which ssh
/usr/bin/ssh
Yep, it’s that easy. The PATH is used by a number of programs to find information that they need. Your path variable is initially set within /etc./profile but this can be modified. But before we go out and start playing with the path variable we should find out what it is currently set too. There are two ways you can do this, first is to use the echo command to print the variable. echo will interpret whatever you give it and then print to the command line, so if we execute echo $PATH the echo command will output the contents of the PATH variable like so:
$ echo $PATH
/usr/local/sbin:/usr/local/bin:/usr/sbin:/usr/bin:/sbin:/bin:/usr/local/games:/usr/games
Okay, that’s what the PATH variable is. The path is a list of folders separated by colons. This brings us to the second way of viewing the PATH variable: the env command displays all the currently set environment variables. This is a fantastically useful command to check the current state of your whole system environment. Running env should give you an output like this:
$ env
TERM=xterm
SHELL=/bin/bash
XDG_SESSION_COOKIE=eb95d80869be1ad62af36ec5502c41a1-1349772229.897557-1575821964
SSH_CLIENT=10.0.0.104 3643 22
SSH_TTY=/dev/pts/0
USER=pi
LS_COLORS=rs=0:di=01;34:ln=01;36:mh=00:pi=40;33:so=01;35:do=01;35:bd=40;33;01:cd=40;33;01:or=40;
31;01:su=37;41:sg=30;43:ca=30;41:tw=30;42:ow=34;42:st=37;44:ex=01;32:*.tar=01;31:*.tgz=01;31:*.
arj=01;31:*.taz=01;31:*.lzh=01;31:*.lzma=01;31:*.tlz=01;31:*.txz=01;31:*.zip=01;31:*.z=01;31:*.
Z=01;31:*.dz=01;31:*.gz=01;31:*.lz=01;31:*.xz=01;31:*.bz2=01;31:*.bz=01;31:*.tbz=01;31:*.
tbz2=01;31:*.tz=01;31:*.deb=01;31:*.rpm=01;31:*.jar=01;31:*.war=01;31:*.ear=01;31:*.sar=01;31:*.
rar=01;31:*.ace=01;31:*.zoo=01;31:*.cpio=01;31:*.7z=01;31:*.rz=01;31:*.jpg=01;35:*.jpeg=01;35:*.
gif=01;35:*.bmp=01;35:*.pbm=01;35:*.pgm=01;35:*.ppm=01;35:*.tga=01;35:*.xbm=01;35:*.xpm=01;35:*.
tif=01;35:*.tiff=01;35:*.png=01;35:*.svg=01;35:*.svgz=01;35:*.mng=01;35:*.pcx=01;35:*.mov=01;35:*.
mpg=01;35:*.mpeg=01;35:*.m2v=01;35:*.mkv=01;35:*.webm=01;35:*.ogm=01;35:*.mp4=01;35:*.m4v=01;35:*.
mp4v=01;35:*.vob=01;35:*.qt=01;35:*.nuv=01;35:*.wmv=01;35:*.asf=01;35:*.rm=01;35:*.rmvb=01;35:*.
flc=01;35:*.avi=01;35:*.fli=01;35:*.flv=01;35:*.gl=01;35:*.dl=01;35:*.xcf=01;35:*.xwd=01;35:*.
yuv=01;35:*.cgm=01;35:*.emf=01;35:*.axv=01;35:*.anx=01;35:*.ogv=01;35:*.ogx=01;35:*.aac=00;36:*.
au=00;36:*.flac=00;36:*.mid=00;36:*.midi=00;36:*.mka=00;36:*.mp3=00;36:*.mpc=00;36:*.ogg=00;36:*.
ra=00;36:*.wav=00;36:*.axa=00;36:*.oga=00;36:*.spx=00;36:*.xspf=00;36:
ALL_PROXY=SOCKS://localhost:9050
MAIL=/var/mail/pi
PATH=/usr/local/sbin:/usr/local/bin:/usr/sbin:/usr/bin:/sbin:/bin:/usr/local/games:/usr/games
PWD=/home/pi
LANG=en_US.UTF-8
SHLVL=1
HOME=/home/pi
LOGNAME=pi
SSH_CONNECTION=10.0.0.104 3643 10.0.0.56 22
_=/usr/bin/env
There are a lot of variables here that cover a range of things, including the shell we are using (SHELL), the variables governing the colors displayed when we execute ls (LS_COLORS), the path, my current location (PWD), my home directory (HOME), and my username (USER) in addition to the PATH. All these pieces of information can be incredibly useful when trying to diagnose issues with running commands.
Now that we have been able to view the PATH variable, we should look at modifying it. To modify a variable, we need to use the export command in order to assign it into our environment. The syntax for setting a simple variable is this:
$ export VARIABLE="SOMETHING"
If you run this and run env again, you should see this new variable show up within its output like so:
VARIABLE=SOMETHING
If we were to do this to our PATH variable, we would reset it to whatever we set it to, which is not what we want. We could also simply rewrite the whole path, but that’s quite arduous for a simple change. The easiest way to append something to the PATH variable is to include the PATH variable within the assignment. Let’s work with an example: say we want to include the /opt directory into our path. We would start with export PATH= and then we would want to use the current PATH variable (as we would use to display it with echo), so we write "$PATH". To the $PATH we would add a colon as a separator and the new directory /opt, which gives us this command:
$ export PATH="$PATH:/opt"
When run, this will change your PATH variable to this:
/usr/local/sbin:/usr/local/bin:/usr/sbin:/usr/bin:/sbin:/bin:/usr/local/games:/usr/games:/opt
Awesome; the /opt was appended to the end. This brings us to a key point; PATH has an order, left to right. Those on the left side of the PATH variable will be used before those on the right. In our example, /opt would be the last place we search for any given file.
Now that you understand your user environment and how PATH works, you should learn about a special file within your home directory. This is your local shell profile override file. In your home directory there are a number of hidden files that end with rc. These files are normally executed by your shell or whichever application upon its execution to load your personal preferences. The file for the standard Linux BASH shell is the .bashrc file. This file is responsible for a number of the environment variables we saw before; it is also the reason that some of your commands have color. For example, the ls command, which is normally located at /bin/ls (you can check with which ls). If you were to execute this instead of the normal ls, you would not see the colors! These colors were added specially by the .bashrc file using the alias command.
alias, as its name implies, is used to alias a command or a group of commands under a single shell command, just like a program. In the case of your .bashrc file, it has aliased the ls command to execute this:
$ ls –-color=auto
This addition means that every time you issue an ls command, you are automatically adding the color argument to ls. The way the .bashrc achieves this is by adding this line:
alias ls='ls --color=auto'
The great thing about files like .bashrc is they are designed to be user modified—after all, they are your local system variables. In this way, your local environment is made from the base system values given by /etc./profile and the additional values given in .bashrc.
The last command is probably one of the most powerful and useful tools in a systems administrator toolkit: the cron command. cron is a timing application that executes commands at a given time based on rules passed to it by a steering file. cron has a steering file per user called a crontab, which it will check each minute to see if another command needs to be executed. To view your current crontab, you would simply need to execute this:
$ crontab –l
Unfortunately, you won’t have one to begin with, so all you will get from this command is this:
no crontab for pi
Fear not because we will now go over the basics of creating a crontab timing file. The command to enter the special crontab editor is as follows:
$ crontab –e
This will open a copy of your system’s standard editor and create an initial file with a nice block of comments that outline how a crontab entry is laid out. It provides the following example:
0 5 * * 1 tar -zcf /var/backups/home.tgz /home/
This command will perform a tar and zip of all users’ home directories every Monday at 5 a.m. Recall that tar creates a single archive file of all the documents, and the zip will compress the file—the upshot being a single compressed file containing all the files. The five numbers at the start of the line govern the timing; these numbers represent the following things, in the following order:
- Minute of hour
- Hour of day (in 24 hour format)
- Day of month
- Month of year
- Day of week (Sun, 0 to Sat, 6)
As you can see from the example, this command runs on the zero-th minute of the fifth hour of any day of the month, in any month of the year as long as that day is a Monday. With this combination, you can set up any number of timing jobs in order to perform systems administrative functions. The best part is that you can use all the commands we have discussed earlier to perform these tasks for you! Want to kill a process at a certain time? Write the cron timing out for when you want things killed and then use the ps, grep, awk, xargs, and the kill command we worked up earlier! With the combination of cron and all the commands we covered earlier, there is no limit to the tasks you can do!
Summary
Congratulations, you should now be well on your way to being a fully fledged systems administrator. You have at your disposal more than two dozen individual commands and the ability to combine them in new ways to perform almost any task your heart desires. In addition, you should now have the tools to automate the execution of these commands using cron by editing your crontab file. All these tools form the basis of how a systems administrator will manage a Linux system as they provide the flexibility to write robust commands and have them executed automatically.