
In the previous chapter, you were introduced to ArcGIS Runtime and provided with an example of how to architect your solution without many details on how exactly ArcGIS Runtime works with maps and layers. This chapter's aim is to provide more details on maps and layers and how to apply them to both online and offline content. In short, you will be exposed to the following topics:
- MapView
- Layers
- Using online content
- Using offline content
When you're done with this chapter, you will know how to create and consume online content via ArcGIS Online / Portal for ArcGIS or offline content via a Runtime geodatabase, tile package, map package, and so on.
In essence, MapView is a container for a map. It resides in the Esri.ArcGISRuntime.Controls namespace and is the most important control in ArcGIS Runtime because, without it, you can't view a map. It contains a series of properties, methods, and events just like any other .NET control. However, it's easy to get overwhelmed with all of the options, so let's dissect these options one by one and show some examples of use. Before we look at the details of this control, we first need to understand some mapping concepts.
As a mapping developer, you really need to understand projections and coordinate systems. They have a huge impact not only on how data is displayed, but also on performance, usability, and other factors. Projections attempt to portray the surface of the earth on a flat surface. Coordinate systems use a three-dimensional sphere to define a location on the earth's surface.
There are many kinds of projections you can use and it really depends on the location in which your users will be working with your app. If you want a general-purpose method to display your data, latitude/longitude is an excellent choice. However, it has its drawbacks as all projections/coordinate systems have, because if you draw a circle on the map at the equator and then near the poles, the same exact circle will look very different. This is because of the nature of this projections/coordinates system: they distort. In fact, the circle will go from being a circle near the equator to an elliptical shape near the poles:
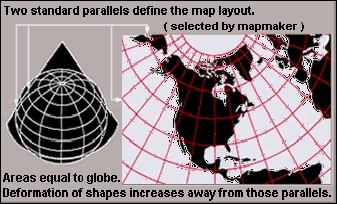
Distortion caused due to the nature of the projections
Choosing the right projections/coordinate system is an important choice because it will affect the following properties of the map:
- Area
- Shape
- Direction
- Bearing
- Distance
- Scale
No matter what projection you choose, at least one of these properties will be affected at the expense of the other properties. For example, if you choose any of the Mercator projections, you'll note that circles become larger if you move from the equator to the poles:
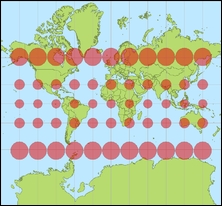
Circle difference when you move from the equator to the poles
For more information about projections and coordinate systems, consult a reputable site on the Web or a book.
When you add a layer to the map, the spatial reference of MapView is set by default by the first layer in MapView. Because of this, you really don't have to do anything if you're OK with the first layer's projection. Most of the time, the first layer you add will be a basemap layer. (Don't confuse the word basemap with map; it's a layer.) A basemap layer is a nice-looking background layer that allows users to orient themselves in the world. A typical basemap is of the streets, buildings, and other important background information. As you are setting the spatial reference by adding the layer, you can't actually set the spatial reference on MapView; you can only get it. You can set the spatial reference of the map object, however.
A spatial reference is a map projection or coordinate system. You can get the spatial reference represented as a well-known ID (WKID), such as 4326, or well-known text (WKT), such as GCS_WGS_1984. The number 4326 just happens to be the latitude/longitude coordinate system (Lat/Lon). Lat/Lon uses angular units for the y and x fields, respectively, and meters for the z (elevation) field. You can find a complete list of coordinate systems at https://developers.arcgis.com/net/desktop/guide/geographic-coordinate-systems.htm.
For a complete list of projections, navigate to: https://developers.arcgis.com/net/desktop/guide/projected-coordinate-systems.htm
Coordinate systems come in meters, feet, and other units for the x, y, and z fields, which will be very important later when you learn how to add objects to the map using these coordinate systems.
One of the first things you're probably going to want to do is to remove the Esri logo from MapView. In your XAML code, just set IsLogoVisible to false like this:
<esri:MapView x:Name="MyMapView" Grid.Row="0" IsLogoVisible="False" LayerLoaded="MyMapView_LayerLoaded">Run the app and you'll see that the logo no longer displays. If you also want to remove Licensed for Developer Only, you'll need to read Chapter 12, Configuration, Licensing, and Deploying.
The MapGrid property is a pretty nice feature if you want to help your users find a location based on a coordinate system. There are four options:
- Latitude/Longitude (
LatLonMapGrid) - Military Grid Reference System (
MgrsMapGrid) - U.S. National Grid (
UsngMapGrid) - Universal Transverse Mercator Grid (
UtmMapGrid)
To create a grid, just add some XAML code like this, after the </esri:Map> tag and before </esri:MapView>:
<esri:MapView.MapGrid>
    esri:LatLonMapGrid/>
</esri:MapView.MapGrid>
The map will look something like this:
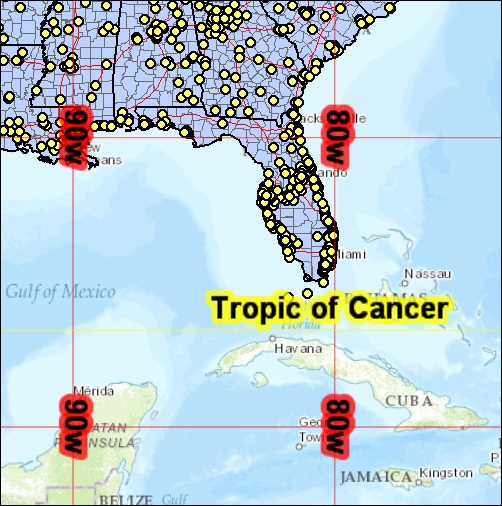
MapGrid
You can change whether to use decimal degrees or DegreesMinutesSeconds by using LabelStyle. If you want to give your user the ability to turn this option on or off, just create a property on ViewModel and bind to it via IsVisible.
Another option to constrain the map is to set the minimum and maximum scale so that users can only zoom in or out so far. This can be important for novice users because they can zoom in too far and not see any detail and not realize that they just need to zoom out with their mouse or a gesture. The two properties are MaxScale and MinScale. You can use them alone or together. For example, you may want to restrict the user from zooming in beyond a scale of 1:1,000.
Giving your users the ability to click on an object on the map is a nice feature that your users will enjoy when they interact with the map. Otherwise known as MapTips, overlays define what happens when your user clicks on an object using XAML or in code. For example, the following XAML code sets the overlay for a single layer that is using a field named MYFIELD from a layer named FeatureLayer:
<esri:MapView.Overlays>
    <esri:OverlayItemsControl x:Name="overlayItemsControl">
        <Border
            CornerRadius="10"
            BorderBrush="Black"
            Margin="0,0,25,25" Visibility="Hidden"
            BorderThickness="2" Background="#995C90B2" >

            <StackPanel Orientation="Vertical" Margin="5,10,18,15">
                <StackPanel Orientation="Horizontal">
                    <TextBlock Text="" FontWeight="Normal"
                Foreground="Black"/>
                </StackPanel>
                <Line X1="0" X2="200" Y1="0"  Y2="0"
                     Stroke="White"
                StrokeThickness="2" />
                <StackPanel Orientation="Horizontal">
                    <TextBlock Text="Name: " FontWeight="Normal"
                     Foreground="Black"/>
                    <TextBlock Text="{Binding [MYFIELD]}"
                        FontWeight="Normal"
                    Foreground="Black" />
                </StackPanel>
            </StackPanel>
        </Border>
    </esri:OverlayItemsControl>
</esri:MapView.Overlays>
The FeatureLayers are a kind of layer that contains geometry such as points, lines, polygons, and attributes. With an overlay, you can click on a point and see information about that point as shown here:
Displays the information about the point
In order to edit layers that allow editing, the MapView container contains an Editor class. Once you have a reference to MapView, the Editor class is available to add, update, and delete objects on the map, such as points, lines, arrows, triangles, and polygons. With this single class, you can edit both online and offline layers, which makes editing pretty easy to accomplish. Editing not only includes the ability to manipulate geometry, it also includes the ability to edit attributes (fields) of the data too. If the data resides in an online service, the edits you make will be immediately reflected online. If you allow your users to edit offline data, the edits will be stored in a local store until you synchronize them to an online service or copy them to an enterprise geodatabase for other uses.
WrapAround is a nice property if you want to give your users the ability to pan east or west around the globe. When they pan the map, they will automatically go around the International Date Line. Just set this property to true to activate it.
With the LocationDisplay property on the MapView container, you can get your current location via a location provider. A location provider can be the GPS in your device, an attached GPS, or a custom location provider, such as a random location simulator.
The MapView container also has many events that aid in the development of providing your app with a rich user experience. Some of the more interesting and useful events are Initialized, MapViewDoubleTapped, MouseDoubleClick, MouseDown, MouseMove, StylusButtonDown, StylusDown, TouchDown, TouchMove, and TouchUp. Depending on whether the app is being interacted with via mouse, stylus, or touch, will determine the events that you need to handle and the requirements you are trying to implement.
When it comes to how the user interacts with the map, you have many options you can control. You can enable the zoom options, whether double-tapping is enabled, whether a zoom box is enabled, whether rotation and panning are allowed, and so on. To set this in XAML, add the following example code after you've defined the MapView container and before the Map XAML line:
<esri:MapView.InteractionOptions>
    <esri:InteractionOptions>
        <esri:InteractionOptions.ZoomOptions>
            <esri:ZoomOptions IsEnabled="True"
                IsDoubleTappedEnabled="False"
                IsZoomBoxEnabled="True"
                IsMouseWheelEnabled="True"
                IsPinchEnabled="True"
                IsTwoFingerTapEnabled="True"
            IsKeyboardEnabled="False" />
        </esri:InteractionOptions.ZoomOptions>
        <esri:InteractionOptions.RotationOptions >
            <esri:RotationOptions IsEnabled="False" />
        </esri:InteractionOptions.RotationOptions>
        <esri:InteractionOptions.PanOptions>
            <esri:PanOptions IsEnabled="True"
                IsDragEnabled="True"
                IsFlickEnabled="True"
            IsKeyboardEnabled="True" />
        </esri:InteractionOptions.PanOptions>
    </esri:InteractionOptions>
</esri:MapView.InteractionOptions>Now that you've been introduced to the MapView container, it's time to get to the main attraction: the map. The map is really a container for layers, but in order to do just about anything, you will need to access the map directly or indirectly via the MapView container so that you can do things with layers. The map has three properties that you can interact with in XAML: InitialViewpoint, Layers, and SpatialReference. Most of the other important methods, properties, events, and so on are controlled with code.
Every time you zoom in and out, panning whether with a mouse or your finger, you are changing the extent of the map you are viewing. The extent is set with coordinates, hence it's important for you to understand your coordinate system. The extent is rectangular with a minimum and maximum x and minimum and maximum y value. You can set the initial extent of the map in XAML like this:
<esri:MapView x:Name="MyMapView">
    <esri:Map x:Name="MyMap">
        <esri:Map.InitialViewpoint>
            <esri:Map.InitialViewpoint >
                <esri:ViewpointExtent XMin="12.34" YMin="41.85"
                XMax="12.55" YMax="41.95"
                SpatialReferenceID="4326" />
            </esri:Map.InitialViewpoint>
        </esri:Map.InitialViewpoint>
    </esri:Map>
</esri:MapView>
You're now looking at Rome, Italy. This will work no matter the projection of the first layer in the map because the spatial reference was also set using SpatialReferenceID. If your map shows up in an incorrect location, the first thing to check is the extent coordinates and the spatial reference.
You can also just use ViewpointCenter to set the x and y fields and the scale too. This property will place the map at the exact x and y coordinates and the scale you provide.
These are the only two parameters that you can use to set the extent using XAML. All other parameters have to be set with code, which would reside in the ViewModel classes. Setting the extent is handled with the following methods: SetView, SetViewAsync, ZoomAsync, and ZoomToScaleAsync. The extent can be set with MapPoint and Viewpoint with geometry such as a bounding rectangle, or scale. Here is an example:
MapPoint point =  new Esri.ArcGISRuntime.Geometry.MapPoint(12.5,
    41.9, new SpatialReference(4326));
mapView.SetViewAsync(point, 100000);
This code has the same effect as the previous code except that it zooms out to a scale of 1:100,000 around Rome.
Layers typically come in three flavors when you add them to the map:
- Basemap layers
- Operational layers
- Dynamic layers
The basemap layers are typically static layers that usually show a collection of layers, such as streets, imagery, oceans, states, and country boundaries in a single layer. They are generally speaking view only and have been designed to be fast. The operational layers are typically layers that users view, query, and edit. These kinds of layers serve the same purpose as transactional tables in a relational database. The operational layers are viewed on top of the basemap layers. They can also be edited and persisted to a geodatabase. Lastly, the dynamic layers are the layers that are updated frequently, even in real time. This includes temporary graphics on the map, such as tracking aircraft in real time or the current position of the user as they drive down a street. Once the app closes or the user stops tracking themselves, these kinds of layers are not persisted into the geodatabase or any other persistence mechanism.
The MapView and Map containers don't do you much good unless they have layers in them. ArcGIS Runtime supports many types of layers. In this section, we will explore them so that you can get a feel for all of the options. All layers are located in Esri.ArcGISRuntime.Layers. You've already seen a couple of layers in the previous chapter when you added XAML like this:
<esri:ArcGISTiledMapServiceLayer ID="Basemap"
    ServiceUri="{Binding Source={StaticResource VM},
Path=BasemapUri}"/>
<esri:ArcGISDynamicMapServiceLayer ID="USA"
    ServiceUri="{Binding Source={StaticResource VM},
Path=USAUri}"/>
But what exactly is a tiled map service or a dynamic map service? What kinds of layers are supported? Refer to the diagram shown here:
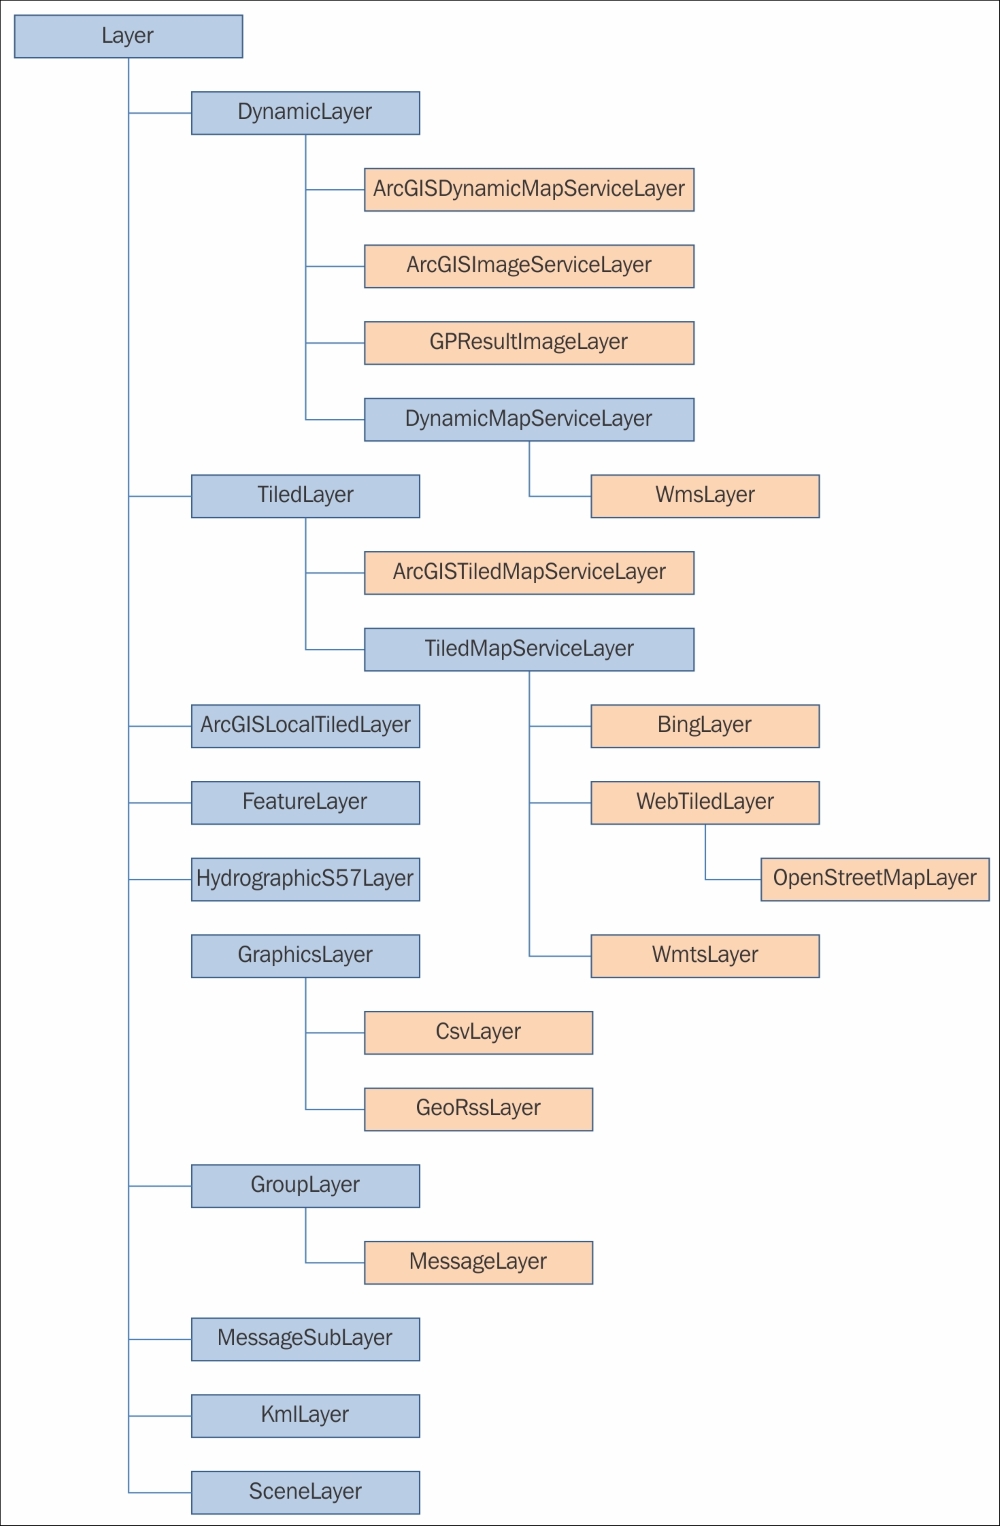
As can be seen in the object hierarchy, Layer is the base class. All subclasses inherit all of its properties and methods. In the second tier, there are the following classes:
DynamicLayerTiledLayerArcGISLocalTiledLayerFeatureLayerHydrographicS57LayerGraphicsLayerGroupLayerMessageSubLayerKmlLayerSceneLayer
Let's start with some of the ones we've already been exposed to, and then build our understanding from there forward.
A dynamic map service is a map with one or more layers, which users can interact with just as they do from ArcGIS Desktop. In other words, users are able to view and interact with the geometry and fields of the layers. A user can search, change symbology if enabled, identify, and so on. Every time the user zooms or pans, an image is generated on the fly. This can be an expensive process because this step involves taking a snapshot of the extent with the geometry and sending it to the client.
To access these services, all you have to do is specify the REST endpoint from either in the cloud via AGOL or from your own implementation of the ArcGIS Server.
You can think of a tiled map service as a high-performance approach to taking many geometry-based (vector) and/or imagery-based (raster) layers and converting them to tiled images. When you look at one of these layers across the entire earth, you are actually looking at a few images, which are actually snapshots. Basically, the earth is being divided up into a series of tiled images. So, instead of seeing the original geometry, which would be too slow to visualize, you are seeing pictures broken up at different scales.
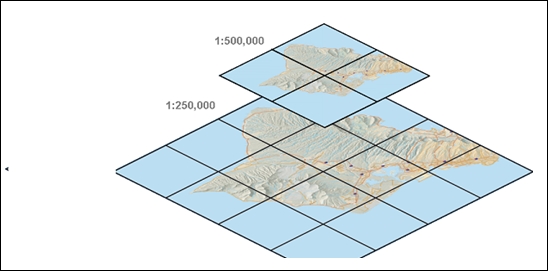
Many of these layers are called basemaps because they contain a set of layers that have been merged to form a picture that is fast and can move quickly across the Internet due to the fact that the images have been compressed in some cases.
Creating these tiles is done with ArcGIS Desktop, and then published to AGOL or ArcGIS Server. Although the process to generate these tiles can be slow, sometimes very slow, the end result is that users of these kinds of layers get very fast rendering times because they are just looking at pictures (tiles). As we are only viewing tiles, you can't do anything else with the tiles, such as querying, identifying, and the other things you can do with dynamic map services and feature services.
As you've seen many times now, all you have to do is specify the URI and name and you now have a basemap layer. There are many basemaps available, which has lessened the need for most organizations to develop their own.
Navigate to the following link to see a complete list:
http://www.arcgis.com/home/group.html?owner=esri&title=Tiled%20Basemaps
Click on Details under the snapshot of the basemap, and then find the REST endpoint in the description or Map Contents section. You can use as many of these maps as you want, but always remember that the more you add, the slower the performance, so choose the best one for your app.
A local tiled layer is similar in concept to the ArcGISTiledMapServiceLayer, except that it resides on a local disk for disconnected viewing. The tiles are cached to a disk using ArcGIS Desktop into a single .tpk file and copied to the device for offline use. As such, it is very fast because it doesn't rely on an Internet connection.
The feature service is a service in some ways like a dynamic map service except that no image is generated when it is drawn. What actually happens is that the geometry and attributes are returned across the Web in the form of JSON to the client, which users can view, query, change symbology, and edit. The editing capability is the primary reason to use the feature service. This is an important type of service because it allows for both connected and disconnected editing on a device. In fact, with this service, you can download data, go disconnected, perform edits, and then synchronize your edits when you go back online. Or, if you're always connected, you can just edit this service directly at all times.
To create this kind of layer, you must create it using ArcGIS Desktop. It is, by default, not enabled when a service is created. Once the service is created, you can access it by using the following code:
<esri:FeatureLayer ID="Incidents">
    <esri:ServiceFeatureTable
        ServiceUri="http://sampleserver6.arcgisonline.com/arcgis/rest/services/SF311/FeatureServer/0" />
</esri:FeatureLayer>
Note that in the REST endpoint, it denotes this service as FeatureServer/0. This indicates that it's a feature service and we're accessing the zero layer, which is the first layer in this service. Also, note that we define the layer using FeatureLayer, and then inside the FeatureLayer class, there is a ServiceFeatureTable property. Using ServiceFeatureTable indicates that this service is coming from an online source. Alternatively, you can use a FeatureLayer class to access an offline data source coming from an ArcGIS Runtime geodatabase via ArcGISFeatureTable. The first thing you will need to do is open the Runtime geodatabase with the following code:
var gdb = await Geodatabase.OpenAsync(gdbPath);
Once you have an access to the geodatabase, you can find and add layers to the map with the following code:
// loop thru all tables in the geodatabase
foreach (var table in gdb.FeatureTables.ToList())
{
// create a new feature layer to display each table
var lyr = new FeatureLayer
{
ID = table.Name + "Offline",
DisplayName = table.Name,
FeatureTable = table
};
// add each layer to the map
MyMapView.Map.Layers.Add(lyr);
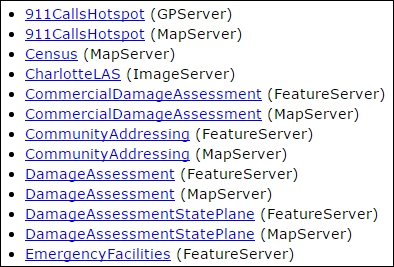
}If you navigate to http://sampleserver6.arcgisonline.com/arcgis/rest/services, you will find many feature services. Any service listed with (FeatureServer) beside its name is FeatureService:
Later on in this chapter, we will explore how to open a Runtime geodatabase without using a feature service. Also, in Chapter 9, Editing Features, we will explore the editing pattern in much more detail.
The image services are accessed via the ArcGISImageServiceLayer. These kinds of layers can come from both online and offline local sources in the form of aerial photography, for example. To add one of these kinds of services from XAML, use this code:
<esri:ArcGISImageServiceLayer ID="Imagery of Toronto"
    ServiceUri="http://sampleserver6.arcgisonline.com/arcgis/rest/services/Toronto/ImageServer">

</esri:ArcGISImageServiceLayer>
The following site has some image services that you can use: https://sampleserver3.arcgisonline.com/ArcGIS/rest/services/World.
A graphics layer is used for showing dynamic content or any content that is temporary in nature. For example, you may want to give your user the ability to mark up a map or show the real-time position of a fast-moving drone on the map. You can add as many graphic layers as you need, but typically, you'll find that you need three or less. To add a graphics layer via code, you'd enter something like the following:
var graphicsLayer = new Esri.ArcGISRuntime.Layers.GraphicsLayer();
graphicsLayer.ID = "MyGraphicsLayer";

// add the graphics layer to the map
MyMapView.Map.Layers.Add(graphicsLayer);
However, this only creates the layer; it doesn't actually add anything to the layer. To accomplish this, you will need to input the following code:
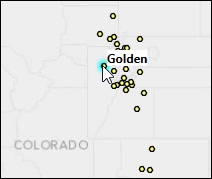
// create a symbol (large cyan circle) for displaying a point
var markerSym = new Esri.ArcGISRuntime.Symbology.SimpleMarkerSymbol();
markerSym.Color = Colors.Cyan;

markerSym.Size = 18;
markerSym.Style = Esri.ArcGISRuntime.Symbology.SimpleMarkerStyle.Circle;

// create a marker graphic for the center of the map's extent
var pointGraphic = new Esri.ArcGISRuntime.Layers.Graphic(MyMapView.Extent.GetCenter(), markerSym);

// add the graphic to the graphics layer for display on the map
graphicsLayer.Graphics.Add(pointGraphic);
This code creates a symbol with a certain color, size, and style, and then creates a graphic from a point using the center of the map, and finally adds the resulting graphic to the graphics layer. More details on symbology will be covered in Chapter 5, Geometry and Symbology.
A CSV layer is a layer from a CSV file, which contains text data that is delimited by some characters for each column. Each line of the file contains a row. The CsvLayer class is a type of GraphicsLayer.
A Bing layer is a service provided by Microsoft's Bing tiled map services. The key difference between this service and other services that we've discussed is that it's accessed via SOAP as opposed to REST. Also, you must acquire a key using a Bing account from https://www.bingmapsportal.com/.
Once you've acquired this key, you can add a layer using the following code:
var bingMapLayer = new Esri.ArcGISRuntime.Layers.BingLayer();
bingMapLayer.Key = "gqw%2ss@2";
bingMapLayer.MapStyle = Esri.ArcGISRuntime.Layers.BingLayer.LayerType.AerialWithLabels;
Keyhole Markup Language (KML) is an XML notation for representing geographic data in 2D and 3D in Google Maps and Google Earth. Since its inception in 2004, it has become very popular with both GIS and non-GIS professionals as a means to make layers. To add a layer via code to the map is just as easy as the previous examples:
// create a KML layer from an online file
var sourceUri = new Uri("http://earthquake.usgs.gov/earthquakes/feed/v1.0/summary/1.0_week_age_link.kml");
var kmlLayer = new KmlLayer(sourceUri);

// Add the kml layer to the map
MyMapView.Map.Layers.Add(kmlLayer);A group layer is a mechanism to logically group your layers. For example, you can group all of our operational layers (FeatureLayers) into a group so that when they show up in a legend they are under one branch (folder) in the legend. The group layers don't store data themselves, they just contain other kinds of layers. You can create as many group layers as you need. Here is an example of creating a group layer in XAML:
<esri:GroupLayer DisplayName="Basemap Group">
    <esri:ArcGISTiledMapServiceLayer
        DisplayName="Imagery" IsVisible="False"
        ServiceUri="http://services.arcgisonline.com/ArcGIS/rest/services/World_Imagery/MapServer" />
    <esri:ArcGISTiledMapServiceLayer DisplayName="Street"
        ServiceUri="http://services.arcgisonline.com/ArcGIS/rest/services/World_Street_Map/MapServer" />
</esri:GroupLayer>A message layer displays military symbols using graphics that conform to the MIL-STD-2525C or APP6B standards by having a message using a Symbol ID Code (SIC) sent to this layer type.
A message sublayer is a sublayer of a message layer and it's where messages are sent for display on the map.
A scene layer is a layer for rendering 3D content in a scene/scene view. This kind of layer can't be viewed in a MapView/Map container. With this kind of layer, 3D content such as buildings, trees, and transmission towers, and generic 3D objects such as spheres, pyramids, and cones can also be viewed. This kind of layer will be discussed in the next chapter.
Now that you've been exposed to some concepts, let's put this into action by building an app that allows you to explore MapView, Map, and some of the layers in more detail than we've done in previous chapters. While we're at it, let's add some functionalities to the app, such as a button that zooms to a certain location, setting Viewpoint, removing the Esri logo, and setting the interaction options:
- Make a copy of the last project from Chapter 2, The MVVM Pattern (
Chapter2b). Make sure to resolve any errors and make sure it will build and run as it did before.In order to make some of the functionalities, such as accessing the
Editorclass, we will need to make sure ourViewModelclass has access to theMapViewcontainer; otherwise, our app won't work and we wouldn't satisfy SoC. To achieve this, we will customize ourMapViewcontainer to use a custom behavior. Behaviors are not a part of MVVM Light, but that's OK because we can go beyond MVVM Light while at the same time using more advanced features of WPF while achieving all of the goals of MVVM. - Add a reference to
System.Windows.Interactivity. - Create a new folder in your project and name it
Behaviors. Add a new class and name itMapViewBehavior.cs. - Enter the following code in
MapViewBehavior.cs:using Esri.ArcGISRuntime.Controls; using GalaSoft.MvvmLight.Messaging; using System; using System.Collections.Generic; using System.Linq; using System.Text; using System.Threading.Tasks; using System.Windows; using System.Windows.Interactivity; namespace Chapter3.Behaviors { public class MapViewBehavior : Behavior<MapView> { protected override void OnAttached() { base.OnAttached(); AssociatedObject.Loaded += AssociatedObject_Loaded; } void AssociatedObject_Loaded(object sender, RoutedEventArgs e) { MapView mapView = sender as MapView; Messenger.Default.Send<MapView>(mapView); } } }
As we discussed in the previous chapter, a behavior is mechanism to change how an element behaves. In this case, we're just making the MapView container send a reference to anything that is listening to the MVVM Light messenger. In the constructor, OnAttached is called as soon as the MapView class is initiated. Then, we wire up an event handler to handle when the MapView class is loaded. In the event handler, we get a reference to the MapView class and send it to Messenger. Anything listening will get the MapView class. We are now going to make our ViewModel class receive this MapView class:
- In
MainViewModel.cs, add a reference toEsri.ArcGISRuntime.Controls. - Add a private member to the calls like this:
private MapView mapView = null;
- Add the following lines after the
this.SearchRelayCommandas shown here:public MainViewModel() { if (IsInDesignMode) { // Code runs in Blend --> create design time data. } else { // Code runs "for real" ConfigService config = new ConfigService(); this.myModel = config.LoadJSON(); this.SearchRelayCommand = new RelayCommand<int>(Search); // added Messenger.Default.Register<Esri.ArcGISRuntime.Controls.MapView>(this, (mapView) => { this.mapView = mapView; }); } } - Open
MainWindow.xamland add the following two references:xmlns:behave="clr-namespace:Chapter3.Behaviors" xmlns:i="clr-namespace:System.Windows.Interactivity;assembly=System.Windows.Interactivity"
- Right after the
MapViewclass is defined with XAML, add the following lines:<i:Interaction.Behaviors> <behave:MapViewBehavior/> </i:Interaction.Behaviors> - Run the app. If you put a break on the line where the
MapViewclass is set in the constructor (this.mapView = mapView), you will see that it captures a reference to theMapViewclass. There you have it! YourViewModelclass is now set to do just about anything because it now has access to theMapViewclass, which gives it access to everything of relevance for building a complete app. - Add a button on top of the map like this:
<Button Content="Zoom To Italy" Width="80" Height="35" HorizontalAlignment="Left" Command="{Binding ZoomRelayCommand}"> </Button> - Add a new relay command to
MainViewModellike this:public RelayCommand ZoomRelayCommand { get; private set; } - Modify the constructor of
MainViewModelto instantiate theRelayCommandclass like this:this.ZoomRelayCommand = new RelayCommand(Zoom);
- Add the following method to the
ViewModelclass:public async void Zoom() { MapPoint point = new Esri.ArcGISRuntime.Geometry.MapPoint(12.5, 41.9, new SpatialReference(4326)); await mapView.SetViewAsync(point, 100000); } - Add the following method to the
ViewModelclass:public void SetInitialExtent() { // Set the initial extent. Esri.ArcGISRuntime.Geometry.SpatialReference sr = Esri.ArcGISRuntime.Geometry.SpatialReferences.Wgs84; Esri.ArcGISRuntime.Geometry.Envelope envelope = new Esri.ArcGISRuntime.Geometry.Envelope(10, 40, 14, 43, sr); this.mapView.Map.InitialViewpoint = new Esri.ArcGISRuntime.Controls.Viewpoint(envelope); } - Add the following line at the end of the anonymous method of the
Messengerclass:this.SetInitialExtent();
- Run the app. You will note that you are zoomed in over Italy because
InitialViewpointis set to an extent over Italy. Next, click on Zoom To Italy. TheViewpointbutton is set using an envelope, which is a rectangle that has been set with latitude and longitude coordinates because we specified a spatial reference of WGS84.
While it's true that we could have just passed in the MapView class similarly to how we did in the previous chapter, that doesn't satisfy other situations we'll encounter. For example, if we had another ViewModel class, how would we pass the MapView class to it? What if we didn't have a button at all? What if we need to perform some logic on what layers to load without using XAML at all? What if we wanted to set up MapTips dynamically to multiple layers in the ViewModel class without knowing the layers that we'd load up? This is a powerful technique that will now allow us to write our apps without having to be concerned with getting the MapView class in our ViewModel class. It's just there and we can now focus on the requirements.
One last thing before we move on. The astute observer will note that we just placed a reference to Esri.ArcGISRuntime.Controls in our ViewModel class. This breaks SoC, but it can easily be resolved by passing the MapView class directly to a service without adding the using statement to the ViewModel class. This was done to illustrate the concept because we only have one method we're calling on, called Zoom. In a production-level app, we'd add a service that handled all of our navigation operations. Better yet, we'd place this in its own ViewModel class that used this service:
- Let's configure the map, but let's add it in the
ViewModelclass instead of XAML, so we can see that we can now configure our map using this approach. InMainViewModel.cs, updateMessengeras shown in this code:Messenger.Default.Register<Esri.ArcGISRuntime.Controls. MapView>(this, (mapView) => { this.mapView = mapView; this.mapView.MapGrid = new LatLonMapGrid(LatLonMapGridLabelStyle.DegreesMinutesSeconds); this.mapView.InteractionOptions.PanOptions.IsEnabled = true; this.mapView.InteractionOptions.PanOptions.IsDragEnabled = true; this.mapView.InteractionOptions.PanOptions.IsFlickEnabled = true; this.mapView.InteractionOptions.PanOptions.IsKeyboardEnabled = true; this.mapView.InteractionOptions.ZoomOptions.IsEnabled = true; this.mapView.InteractionOptions.ZoomOptions.IsDoubleTappedEnabled = false; this.mapView.InteractionOptions.ZoomOptions.IsMouseWheelEnabled = true; this.mapView.InteractionOptions.ZoomOptions.IsPinchEnabled = true; this.mapView.InteractionOptions.ZoomOptions.IsTwoFingerTapEnabled = true; this.mapView.InteractionOptions.ZoomOptions.IsKeyboardEnabled = true; });This is pretty nice. We've configured how users can interact with the map but we've placed this code in the
ViewModelclass instead of XAML. - Add a reference to
Esri.ArcGISRuntime.LayersandSystem, and then at the end of this same anonymous method, add the following layers using the following code:Uri uriBasemap = new Uri(this.BasemapUri); ArcGISTiledMapServiceLayer basemapLayer = new ArcGISTiledMapServiceLayer(uriBasemap); Uri uriUSA = new Uri(this.USAUri); ArcGISDynamicMapServiceLayer dynamicMapLayer = new ArcGISDynamicMapServiceLayer(uriUSA); this.mapView.Map.Layers.Add(basemapLayer); this.mapView.Map.Layers.Add(dynamicMapLayer);Just like with the XAML code we've been using before, we've added the layers.
- Remove the XAML code from
MainWindow.xamlbetween<esriMap>and</esri:Map>, and then run the app. You should see the same layers you've been seeing but this time the layers are coming from theViewModelclass viaMessenger. See the sample app namedChapter3provided with this book if you need any help.
At this point, we have a good architecture to build on. We now know how to use MVVM Light to the point that we could extend this to use a service factory so that we completely satisfy SoC. We could even make this service factory load the layers by simply using a foreach statement to load them all without even knowing how many layers we have in the configuration file.
The other important point to understand about layers is that each layer is drawn in the order in which it is added. The basemap was added first, so it will be drawn first. The USA layer was added second, so it will be drawn after the basemap.
So far, we've been working with online services, which are great, but ArcGIS Runtime allows you to use offline content too. In this section, we're going to explore three ways of using offline content: tile package, map package, and Runtime geodatabase. If you have ArcGIS Desktop, feel free to use your own data. However, in the following examples, we're going to use data provided with this book for the city of San Francisco.
A local tiled package is similar in concept to a tiled service from an online source except that it is saved into a file, which can be side loaded on a device. Refer to the following ArcGIS site for help and more details about creating a tile package: http://desktop.arcgis.com/en/desktop/latest/map/working-with-arcmap/how-to-create-a-tile-package.htm.
Let's create a new app based on San Francisco that allows us to visualize this great city using the MVVM pattern in case we need to have offline access:
- Create a new project and copy the same code over from the previous project. Make sure it contains all of the same classes.
- Using NuGet, install MVVM Light and
Json.NET. - Update all the namespaces and
usingstatements. - Remove the XAML code related to the last project, including the
Grid,TextBlocktags,Findbutton, andZoom To Italybutton. - We will need the configuration file,
C:ArcGISRuntimeBookJSONconfig_sf.json, which has the following contents:- Tile package:
C:\ArcGISRuntimeBook\Data\SanFrancisco.tpk - Map package:
C:\ArcGISRuntimeBook\Data\MyRestaurants.mpk - GDB:
C:\ArcGISRuntimeBook\Data\sf_parking_meters.geodatabase
- Tile package:
- Update your
configservice to this location of the.jsonfile. - Remove the
Search,Zoom, andSetIntialExtentmethods in theViewModelclass. Also, removeSearchRelayCommandandZoomRelayCommand. Remove the property namedGridDataResults. - Update the
Modelclass to have these three properties:TilePackageas a string,MapPackageas a string, andgdbas a string. Make sure to update theViewModelclass with the new property names. Remove theSearchmethod, and all the code for adding the layers. Remove all XAML in theMapclass. - In the
ViewModelclass, add the following code in the anonymous method of theMessengerclass:Messenger.Default.Register<Esri.ArcGISRuntime.Controls.MapView>(this, (mapView) => { this.mapView = mapView; ArcGISLocalTiledLayer localTiledLayer = new ArcGISLocalTiledLayer(this.TilePackage); localTiledLayer.ID = "SF Basemap"; localTiledLayer.InitializeAsync(); this.mapView.Map.Layers.Add(localTiledLayer); }); - Run the app and you will see the tile package of San Francisco:
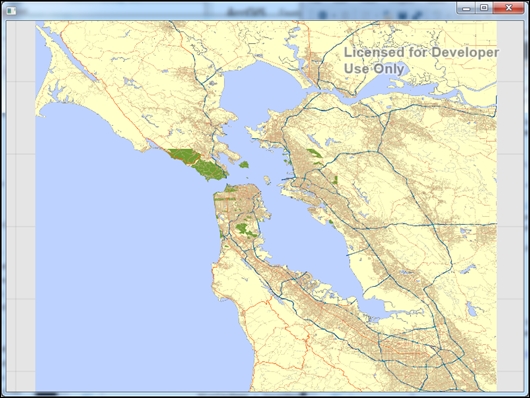
As you can see in this screenshot, our map contains the tile package that covers the bay area. We are no longer using a web service of the world. We had to instantiate the layer using the path to the tile package, initialize it, and then add it to the map. All of this occurred in our ViewModel class.
A map package is simply a compact representation of an ArcGIS Desktop map document. With ArcGIS Runtime, it's possible to view and query this data in the map. This is accomplished by instantiating a local server that allows you to interact with the map as if you were interacting with a map service from ArcGIS Server. Did you catch that? A local server is like a mini version of ArcGIS Server running on your desktop machine. With this local server, you are the administrator and consumer of the data. You have full control over how the local server is configured, including the service life cycle. In fact, it's up to you to start and stop the local server just like you would run ArcGIS Server.
To create a map package via ArcGIS Desktop, navigate here:
http://desktop.arcgis.com/en/desktop/latest/map/working-with-arcmap/creating-a-map-package.htm
We will once again use some sample data and make use of a map package:
- Add a
usingstatement in yourViewModelclass toEsri.ArcGISRuntime.LocalServices. - Add the following method to the
ViewModelclass:public async void CreateLocalServiceAndDynamicLayer() { LocalMapService localMapService = new LocalMapService(this.MapPackage); await localMapService.StartAsync(); ArcGISDynamicMapServiceLayer arcGISDynamicMapServiceLayer = new ArcGISDynamicMapServiceLayer() { ID = "Restaurants", ServiceUri = localMapService.UrlMapService, }; this.mapView.Map.Layers.Add(arcGISDynamicMapServiceLayer); } - Call this method at the end of the
Messengerclass just like all of the other initialization code we've added:this.CreateLocalServiceAndDynamicLayer();
- Run the app. You will see a message box that lets you know that this isn't licensed. Click on OK. The restaurants layer should also appear.
A Runtime geodatabase is basically a SQLLite database, which is ideal for a mobile app. It can contain feature layers for editing on a device. For more details on how to create this kind of geodatabase, see the ArcGIS Desktop help here: http://desktop.arcgis.com/en/desktop/latest/map/working-with-arcmap/creating-arcgis-runtime-content.htm
Let's add a Runtime geodatabase to our app:
- Add a
usingstatement toEsri.ArcGISRuntime.Data. - Add the following method to the
ViewModelclass:private async void CreateFeatureLayers() { var gdb = await Geodatabase.OpenAsync(this.GDB); Envelope extent = null; foreach (var table in gdb.FeatureTables) { var flayer = new FeatureLayer() { ID = table.Name, DisplayName = table.Name, FeatureTable = table }; if (!Geometry.IsNullOrEmpty(table.ServiceInfo.Extent)) { if (Geometry.IsNullOrEmpty(extent)) extent = table.ServiceInfo.Extent; else extent = extent.Union(table.ServiceInfo.Extent); } this.mapView.Map.Layers.Add(flayer); } await this.mapView.SetViewAsync(extent.Expand(1.10)); } - Add this method at the end of the anonymous method of the
Messengerclass in theViewModelconstructor, as you have in previous steps with other methods. This method reads the Runtime geodatabase, createsFeatureLayers, adds them to the map, gets the extent of theFeatureLayers, and finally zooms around by 110 percent. - Run the app. You will see the parking meters of San Francisco. See the provided sample named
Chapter3aif you need help.