In all the previous chapters, we explored all the capabilities of ELK Stack, and how it makes your life easier to analyze logs. Now, we will explore some of the plugins and utilities that extend the capability of the stack and make it more wonderful, secure, and easy to maintain. We'll also take a look at the roadmap for the components of ELK Stack.The following topics are covered in this chapter:
- Elasticsearch plugins and utilities
- Curator for index management
- Shield for security
- Marvel to monitor
- ELK roadmap
Elasticsearch is a very important component of ELK Stack, so it's very important to have a good management of the Elasticsearch cluster, and to maintain security. There are a few plugins and utilities that are available.
Curator is an important utility that helps manage the Elasticsearch indices. As your data grows, it becomes important to manage the kind of information that you want to retain and what information you can remove from your system. Curator can help remove old indices and optimize the system.
The following are some of the high level tasks that Curator can perform for your Elasticsearch indices:
Curator can be easily configured as cron entries in your system, where you can schedule the cleanup of indices regularly. Let's take a look at the command-line syntax of Curator:
curator [FLAGS] COMMAND [FLAGS] SUBCOMMAND [FLAGS]
All available options can be explored using the help command:
curator --help
Let's look at some examples of how Curator can be used:
- Deleting the indices older than a certain period:
curator --host 10.0.0.X delete indices --older-than 180 --time-unit days --timestring '%Y.%m.%d' - Show all the indices matching a timestring:
curator --host 10.0.0.x show indices --timestring '%Y.%m.%d' - Add indices older than 30 days to
aliaslast_month:curator alias --alias-older-than 30 --alias last_month - Remove indices older than
60days fromaliaslast_month:curator alias --unalias-older-than 60 --alias last_month
Curator installation is very easy and quick; it can be done via the python pip utility:
pip install elasticsearch-curator
Curator is hosted at https://github.com/elastic/curator, and detailed information about Curator can be found in its official documentation at https://www.elastic.co/guide/en/elasticsearch/client/curator/current/index.html.
Shield is an Elasticsearch plugin from Elastic that adds security to your Elasticsearch cluster. Shield helps protect the data by adding a secure authentication or role-based authorization process.
The following are high-level capabilities of shield:
- It adds authorization control to cluster by enabling password protection, role-based access control, and IP filtering techniques
- It adds SSL/TLS encryption, and message authentication capability
- It adds auditing capabilities to maintain an audit trail of changes in data
Shield is available for 30 days with a trial license, and a subscription needs to be purchased after that. There are open sources alternatives for shield for Elasticsearch security, such as Search Guard (https://github.com/floragunncom/search-guard).
To install shield, you need to follow these steps from the Elasticsearch installation directory:
- Install the license plugin:
bin/plugin -i elasticsearch/license/latest
-> Installing elasticsearch/license/latest...
Trying http://download.elasticsearch.org/elasticsearch/license/license-latest.zip...
Downloading ....................................................
DONE
Installed elasticsearch/license/latest into /usr/share/elasticsearch/plugins/license
- Install the shield plugin:
bin/plugin -i elasticsearch/shield/latest
-> Installing elasticsearch/shield/latest...
Trying http://download.elasticsearch.org/elasticsearch/shield/shield-latest.zip...
Downloading
DONE
Installed elasticsearch/shield/latest into /usr/share/elasticsearch/plugins/shield
- After installing plugin, start your Elasticsearch instance and check in the start up logs for references of shield:
[2015-10-17 07:46:27,508][INFO ][transport ] [Witchfire] Using [org.elasticsearch.shield.transport.ShieldServerTransportService] as transport service, overridden by [shield][2015-10-17 07:46:27,510][INFO ][transport ] [Witchfire] Using [org.elasticsearch.shield.transport.netty.ShieldNettyTransport] as transport, overridden by [shield][2015-10-17 07:46:27,511][INFO ][http ] [Witchfire] Using [org.elasticsearch.shield.transport.netty.ShieldNettyHttpServerTransport] as http transport, overridden by [shield]
Once the shield plugin is added, your access to Elasticsearch at http://localhost:9200 is restricted without a valid authentication.
You need to add users and roles in shield to access Elasticsearch. The following simple command can help you add users with a role, and you can set a password for each user:
bin/shield/esusers useradd es_admin -r admin

Adding roles in shield
Once added, you can verify the user through a list command, or you can delete users, change the password, and so on.
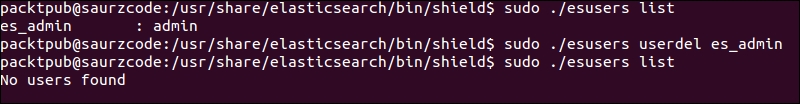
Listing and removing roles in shield
Please note that the license plugin that we installed enables the 30 day trial version of shield, beyond which it is degraded to limited functionalities and the license needs to be purchased to enable full functionality.
If we need to use Kibana on top of Elasticsearch that is now protected using shield, we need to add a kibana4-server role in shield, and provide a corresponding configuration in the Kibana configuration file in the Kibana installation at config/kibana.yml.
The following is the Kibana server role:
esusers useradd kibana4-server -r kibana4_server -p password
The following is the Kibana configuration:
kibana_elasticsearch_username: kibana4-server
kibana_elasticsearch_password: password
Marvel is a product that helps monitor an Elasticsearch cluster. It provides a single interface to view aggregated analytics on the cluster. You can view the essential metrics for your cluster, such as health, state of nodes, and indices. Marvel can help perform a root cause analysis of cluster-related issues so that you can anticipate problems before they occur and fix them. You can also analyze historical or real-time data with it.
Note
Marvel 2.0, supporting Elasticsearch 2.0, is a complete rewrite as a Kibana plugin. It is free for use by everyone, but multicluster support comes as a commercial feature. More on Marvel 2.0 can be found here https://www.elastic.co/guide/en/marvel/current/index.html.
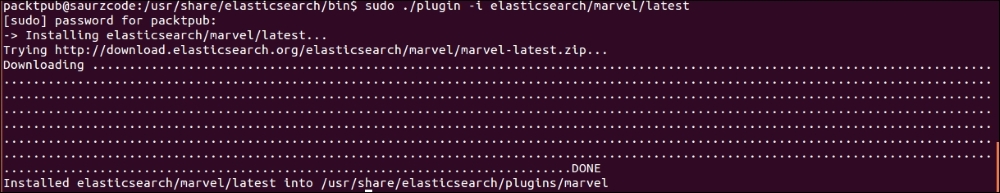
Just like shield, the Marvel installation is also a one step process. We need to execute the following command from the Elasticsearch installation directory:
bin/plugin -i elasticsearch/marvel/latest
Marvel installation
The following are some of the features that Marvel provides.
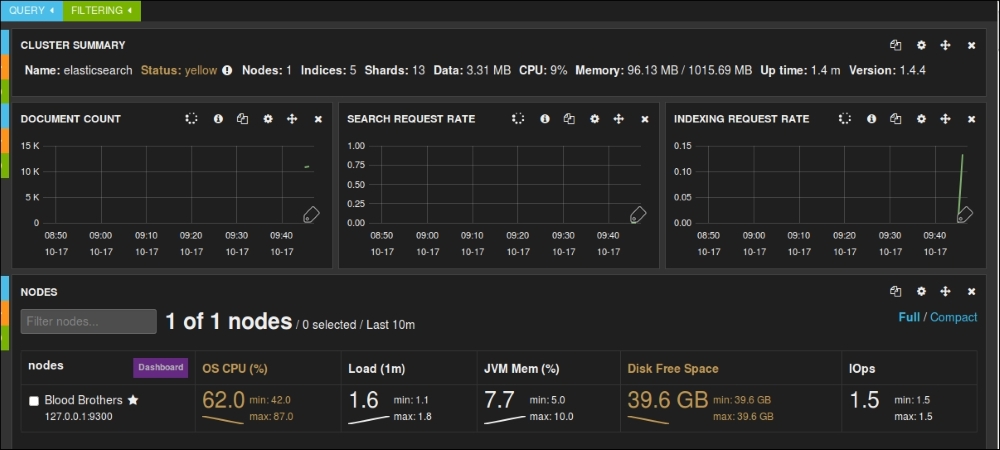
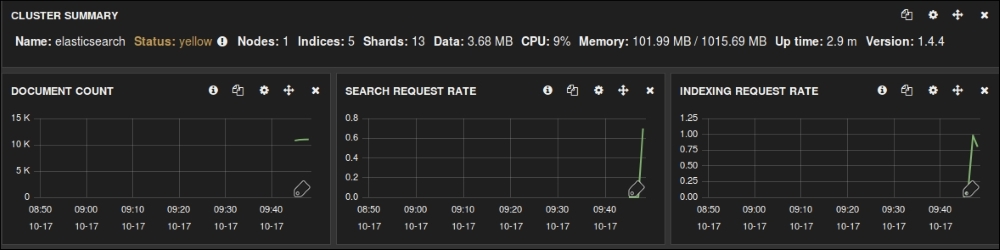
Looking quite similar to Kibana dashboards, Marvel dashboard gives you various metrics about your Elasticsearch cluster, and various nodes and indices. Values in yellow need your attention and have to be taken care of.
Marvel dashboard
It gives you the DOCUMENT COUNT, SEARCH REQUEST RATE, INDEXING REQUEST RATE, various statistics on nodes and indexes, such as OS CPU, Load, JVM Mem, Disk Free Space and IOps operations, as shown in the following screenshots:
Marvel dashboard statistics
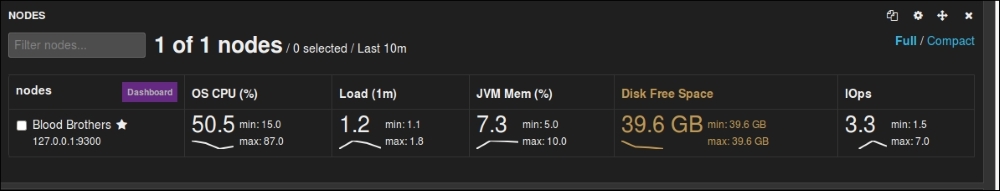
Marvel node metrics
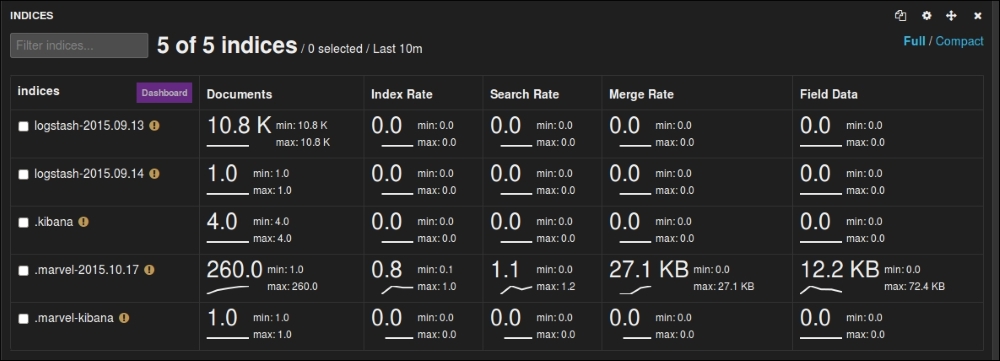
Marvel indices metrics
There is also a very good dashboard that represents the Shard Allocation in your cluster, and where different indices sit on various shards and replicas. It displays all primary nodes and replica nodes with different color codes along with the state of various nodes.
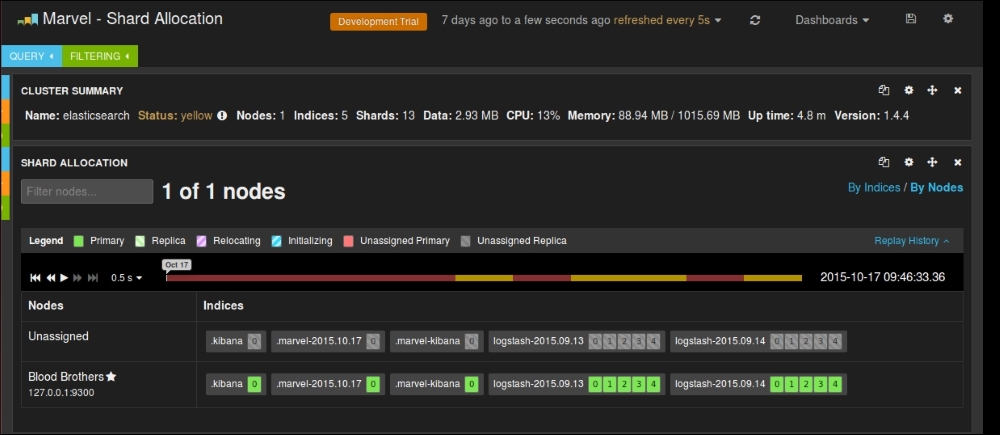
Marvel Shard Allocation dashboard