4 Poverty and Asset Accumulation
among Smallholder Farmers
in Uganda
4.1 INTRODUCTION
Poverty research in recent years has shown that poverty can be considered in multiple dimensions and there are degrees of poverty in every dimension. In Pouw (2008) it was further shown that poor households tend to accumulate welfare attributes in a particular dominant order. If dominant sequencing patterns can be discerned, this would provide us with useful insights into the dynamics of poverty and the kind of livelihood strategies adopted. The combination of both notions can lead to a number of useful insights into the kind of assets and foods consumed prioritized by the poor; i.e., distinguish what are relative ‘basics’ and ‘luxuries’ within a given context. By looking at what people have or lack, a more direct approach to poverty can be taken, which can be easily applied in settings where statistical capacity and resources to monitor poverty are few. This is the case in Uganda, where both the money-metric approach and more participatory approaches have been applied to map and monitor poverty trends over time (e.g., Appleton 2001; GoU 2001). The approach pursued in Pouw (2008) integrates qualitative and quantitative poverty research as an input into the development of an instrument to characterize and monitor poverty in a more cost effective manner.
After presenting the theoretical approach to this kind of poverty research in section 4.2, the chapter will proceed by discussing two methodological applications of the study as follows. First, it will be established how the different dimensions of poverty are related to each other. In a context of widespread poverty and imperfect capital markets, corner solutions are likely to occur (section 4.3). People who climb up the welfare ladder are likely to desire more instead of less of most attributes. Because of the implicit ranking underlying each of the poverty dimensions, the number of welfare attributes owned/consumed can be taken as a proxy for welfare. People owning a more varied set of assets or consuming a more varied diet are therefore assumed to be better off. Second, it will be assessed to what extent households are ranked similarly into ‘poor’ and ‘nonpoor’ categories when the attribute data are compared to people's subjective notions of poverty and well-being. The self-categorization of respondents in different welfare groups provides us with an internal check to validate the number of attributes data (section 4.4). In section 4.5 we will discuss what this implies in practical terms for poverty-reduction policies, the development of asset indices (e.g., Filmer and Scott 2008) and poverty monitoring. Finally, section 4.6 concludes.
4.2 THEORETICAL UNDERPINNING
Poverty is conceptualized as the deprivation of multiple resources that leads to hunger and material deprivation. People can be poor in different dimensions and in varying degrees. To have no land to cultivate may be a sign of poverty in one community, but perhaps not in an urban context where people without a formal job are more likely to be poor. Likewise, one household may be deprived of shelter and another one of food, but both may be equally poor in terms of ‘lack of income’. It is important to consider these different forms of deprivation in order to better understand poverty. The study context is one of rural smallholder communities in Uganda where the majority of people are chronically poor; they are born, live and die in poverty. Only a minority of people within these poor communities manage to escape poverty or create better opportunities for their children. In trying to do so, people adopt different livelihood strategies. As argued by Krishna (2004), people may well advance their living standards by other means than those that cause them to decline into poverty.
An important characteristic of poverty is vulnerability (e.g., Dercon 2005; Elbers and Gunning 2006). Vulnerability, like poverty, is a much debated concept. In the present study, vulnerability is understood, according to Chambers (1989), as the exposure to risks, shocks and stress, and the difficulty to cope with them. Vulnerability to an individual or household means being ‘defenseless, meaning a lack of means to cope without damaging loss’ (1989:1). The people in destitution are the most severe poor and on the brink of survival; they live a hand-to-mouth existence. The destitute are poor in (nearly) all poverty dimensions and, as a result of this, largely defenseless against risks and shocks. They lack welfare attributes of any sort to secure their livelihood and are prone to health and food in security on top of that if the community fails to provide for them. Because of the continuous exposure to risks in combination with the absence of well-functioning financial markets, rural poor households have difficulties to secure their livelihoods and often resort to assets as a means to consumption smoothening. It therefore makes sense to consider potential dominant patterns in poor people's physical asset base, if we are interested in changes in welfare. In this chapter we focus on asset ownership and food consumption only. Welfare attributes is an umbrella concept defined as the resources that people use to secure and advance their livelihoods. These resources may comprise assets, natural resources, access to facilities and services and capabilities. The livelihood situation determines the type of production and consumption activities the members of the household are engaged in. The research methodology developed accordingly is aimed at quantitative measurement. The key premise is that poor people tend to accumulate welfare attributes in a particular dominant order because of relatively stable consumer preference functions.1 The choice of focus on quantitative measurement does not preclude more qualitative inquiries into the accumulation of welfare attributes, such as access to and use of facilities and services, social and human capital and capabilities, but this lies out-side the scope of the present study. If certain dominant patterns can be discerned, this tells us something about the nature and direction of livelihood strategies adopted. Actual consumers’ choices are influenced by prices, availability, tastes, and cultural practices and beliefs, which thus influence orderings of acquisition. By considering sequencing patterns in welfare attributes acquisition in this way, we will try to see if they suggest useful ways of welfare ranking, and the extent to which alternative rankings are consistent. A final note should be made with regard to the interrelatedness of consumption and production activities by farming households. Chayanov, as discussed by Thorner et al. (1986), pointed out the inseparability of production and consumption decisions in his theory of the peasant economy. Given that in a subsistence economy not everything that is produced is sold on the market, intrahousehold decision making about production has an immediate impact on consumption. The latter is a feature of subsistence (peasant) economies and extensively discussed in the work by De Janvry and Sadoulet and others (e.g., De Janvry et al. 1991; Sadoulet and De Janvry 1995). Given that labor is the most important asset of the poor, this builds in an additional risk in a sense that when people fall ill there will be no food on the table. Poor people's preferences will therefore be first and foremost for those attributes that enhance their consumption and production possibilities.
What follows from the discussion above is that living standards cannot be separated from livelihoods. People who share the same livelihood are likely to face comparable circumstances (opportunities and constraints) in constructing their livelihoods and, as a result, we would expect them to make close to similar decisions with regard to the accumulation of welfare attributes. If a process of accumulation can be embarked upon, this can be a sign of an individual or household growing out of poverty. The outcome of expenditure decisions is reflected in people's living standards, and codetermined by people's individual capabilities, assets, access and terms of trade. Sequencing patterns, underlying present ownership (and consumption) of certain welfare attributes, thus reflect people's expenditure decisions in the recent past. What we are interested in is what people acquire next when they climb up the welfare ladder. As such, the suggested approach focuses on accumulation, and not on what people may replace or dispose of in the process of improving their livelihood.
In order to identify sequencing patterns in welfare attributes acquisition, we will make use of the concept of corner solutions. Corner solutions may arise because of poverty being widespread in a context of imperfect capital markets and the notion of indivisible goods. Consumer budgets of poor households are heavily constrained by lack of income so that many goods are simply unaffordable to the poor. This is one reason why corner solutions arise. The second reason is the indivisibility of consumer durables (e.g., Deaton and Muellbauer 1980). As a result, the solution of the preference model is not necessarily an interior solution, but mixed. Instead of people consuming a bit of goods, there are thus instances in which only one of two goods is consumed. If people are destitute, this might apply to the most basic commodities, including food. Moreover, provided no goods are inferior within a given set, the number of goods bought will increase as total expenditure increases for a household of given size. The less frequent goods are thus owned by the wealthier households (e.g., a television set, car, etc.). This is a realistic assumption, given that poor people typically wish to buy more of most basic goods, rather than less, at increasing income levels. For a given household size and a given set of attributes, one would then expect to find a monotonic relationship between the number of goods owned (or consumed) and per capita expenditure (including imputed values). This monotonic relationship is expected to be relatively stronger between indivisible (durable) goods and expenditure than between, for example, food and expenditure because of the latter being more divisible.2
Table 4.1 Kapchorwa: Pearson Rank Correlation between Welfare Attributes
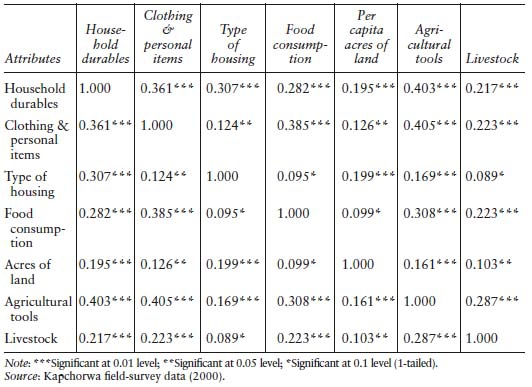
Table 4.2 Kabarole: Pearson Rank Correlation between Welfare Attributes
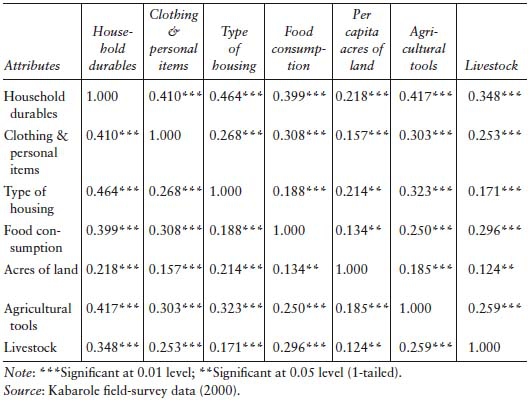
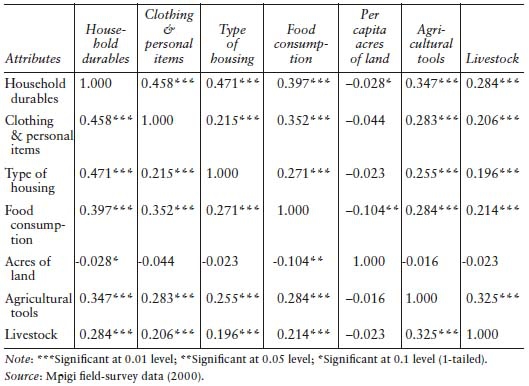
Table 4.3 Mpigi: Pearson Rank Correlation between Welfare Attributes
4.3 CORRELATIONS BETWEEN POVERTY DIMENSIONS
Some recent poverty mapping methods have come to rely on composite poverty indexes. Underlying these methods are typically census data, which are directly aggregated for a particular geographic area. The HDI and other basic need indexes have been applied for this purpose. Their components are usually assigned equal weights, often without supporting evidence. This is not a route we want to venture into now. Moreover, it will be difficult to interpret average scores of indicators when they imply an underlying ranking and the number of items included in the different rankings are not the same. Alternatively, people proceed by multivariate analysis such as principal components or factor analysis. Different forms of principal component analysis have been applied by others to similar qualitative variables (e.g., housing, durable possession, basic needs, etc.) in order to provide weightings for each variable (e.g., see Filmer and Pritchett 2001). It is nowadays very popular in the construction of poverty maps in parts of Latin America—e.g., in Bolivia, Costa Rica and Ecuador (see Henninger and Snel 2002; Ledo Garcia 2002)—and has been applied in vulnerability mapping exercises in other countries as well—e.g., in Malawi (Devereux et al. 2006). We make use of exploratory factor analysis to find out what the degree of coincidence or variance is across the different poverty dimensions, and to find out which welfare attributes best explain the differences in living conditions between households. Given that the underlying scales of the seven attribute rankings in each district are quite different from each other (e.g., the housing indicators stack households in Kapchorwa district into the poor end of the distribution, whereas clothing stacks them at the other end), it does not lie within the scope of this chapter to develop another composite index. The statistical procedure followed is principal component analysis. The ultimate purpose is to extract the principal components from the larger set of seven. The first step involves the assessment of correlation between the different types of welfare attributes. The findings are presented in Tables 4.1–4.3.
Table 4.4 Economic Activities of Rural Households in Three Districts
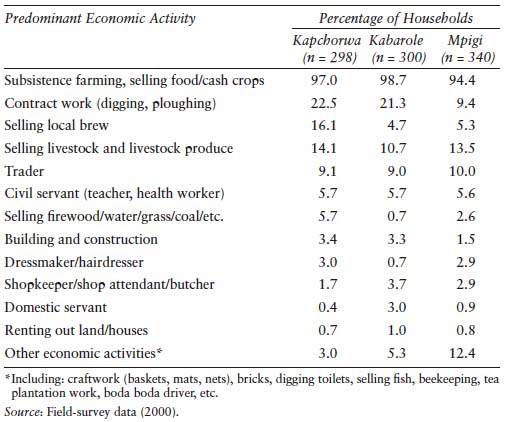
The results for Kapchorwa show positive and significant levels of association between all welfare attributes. The housing indicator correlates positively and significantly with some indicators (e.g., durables, clothing), but less so with others (e.g., food, livestock). In Kabarole, the results show positive and significant correlation between all seven welfare attributes. Land is the relatively weaker correlate. In Mpigi, land correlates even negatively with all welfare attributes, and significantly in some cases. The rural economy of Mpigi is more monetized than the other two districts, partly because of its location in the Central Region and its proximity to the capital Kampala. Smallholder farmers have slightly more diversified into other economic activities other than subsistence farming or going for contract work on other people's land (see Table 4.4). Land cultivation is thus a difficult indicator to use, and we may have to think of complementing this indicator with other data, for example, on ‘land-ownership’ or household members’ economic activities.
Table 4.5 Kapchorwa: Communalities

Table 4.6 Kapchorwa: Total Variance Explained by Welfare Attributes
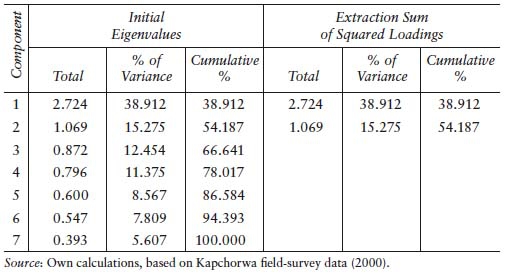
Table 4.7 Kapchorwa: Component Matrix

Table 4.8 Kabarole: Communalities
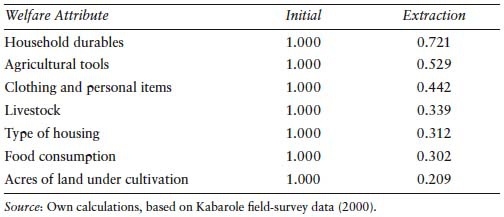
Table 4.9 Kabarole: Total Variance Explained by Welfare Attributes
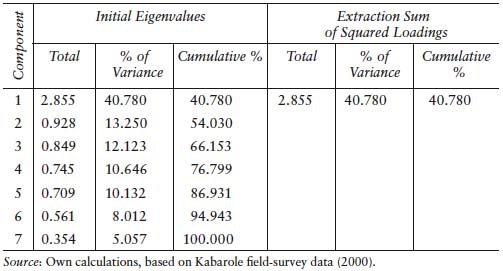
Table 4.10 Kabarole: Component Matrix
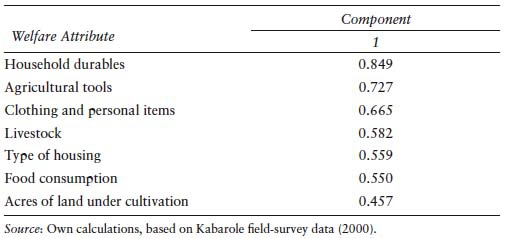
Table 4.11 Mpigi: Communalities
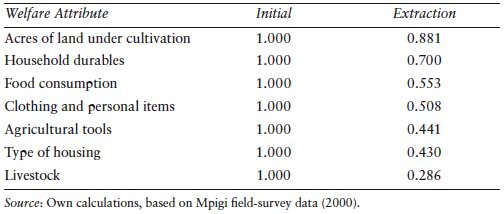
Table 4.12 Mpigi: Total Variance Explained by Welfare Attributes

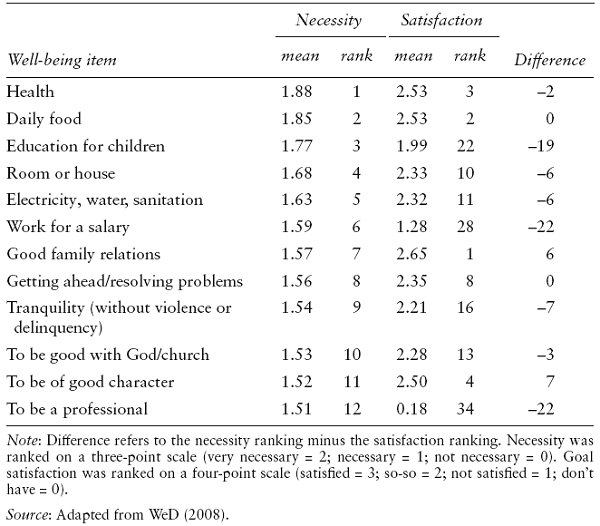
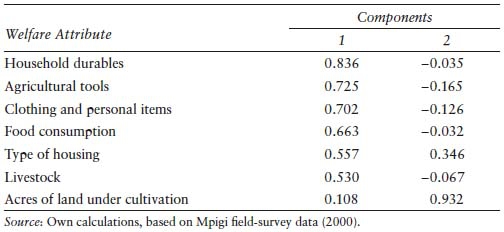
Table 4.13 Mpigi: Component Matrix
The main conclusion that can be drawn so far is that if households are poor in one dimension, they are likely to be poor in another dimension, but not necessarily so. The multiple dimensions of poverty have long been recognized in the literature and are increasingly reflected in present-day development policies (e.g., Millennium Development Goals, and post-2000 development policies as promoted by UNDP, DfID, ODI). It is acknowledged that rural households adopt multiple strategies to secure or advance their livelihoods and that action against poverty should be taken in multiple, interrelated dimensions (e.g., Norton and Foster 2001; Narayan et al. 2009). In that sense, the research is in line with the idea of ‘stages of progress’—a methodology for examining household movements in and out of poverty as positioned by Krishna (2007). Although this research has solely addressed physical resources of rural households and has not taken into account other nonmaterial aspects of poverty (e.g., social capital, access to services), the interrelatedness between nonproductive and productive assets is something that has been clearly pointed out.
The second step of the factor analysis is to extract the principal components. In the case of principal component analysis it is the total variance in the data that is considered, as opposed to principal axis factoring whereby the common variance is looked at—see, for a basic explanation of both methods, Harman (1976) and Kim and Mueller (1979). Given that our goal is to reduce the seven types of welfare attributes data to a smaller subset, we carry out principal component analysis. Tables 4.5–4.7 present the principal component analysis results for Kapchorwa, Tables 4.8–4.10 for Kabarole and Tables 4.11–4.13 for Mpigi district. The extraction values show the average variance of each of the seven variables that is explained by the selected components. The eigenvalues represent the variance accounted for by a certain linear component. The components with eigenvalues greater than 1 are extracted, which after twenty-five iterations leaves us with two components in the cases of Kapchorwa and Mpigi, and only one in Kabarole district. The component matrices show the loadings of the seven variables on the extracted component(s).
In the cases of Kapchorwa and Mpigi district, the variance in six out of seven variables (except livestock) is well explained by the selected components (taking a value of 0.4 as good). In Kabarole district this applies to only three variables (durables, clothing and tools). Despite the differences across locations, it is remarkable that in all three districts the variables household durables, agricultural tools and clothing rank first, second and third in the principal component matrix—meaning that they have the highest loadings on the extracted component(s). After the first three, the picture is varied across location. It should be noted that the type of housing seems to increase in significance in those locations where housing conditions are more diversified. A final observation is that the factor loading of land cultivation drops to a very low level in Mpigi district, which confirms out earlier finding of insignificant correlation with other welfare attributes in section 4.3. The variables with the highest factor loadings can be taken as the guiding indicators in monitoring poverty and change within each (regional) district.3
Table 4.14 Subjective Welfare Categories by District

4.4 SUBJECTIVE VIEWS ON POVERTY
A final evaluation of the established hierarchies will be made in relation to individual household members’ views on their living conditions. Although research on subjective poverty and well-being in richer countries is more common than in developing countries, where data are scarce (Biswas-Diener and Diener 2001; Kingdon and Knight 2004), most studies done in this field point out a positive correlation between people's subjective assessment and the money-metric (see Pradhan and Ravallion 2000; Lokshin et al. 2006). In subjective poverty assessment people seem to relate to others when asked about their perceptions of individual happiness, satisfaction and well-being. The society people live in or originate from is an important point of reference to assess their own well-being and (in)adequacy of income (see also Fafchamps and Shilpi 2007). This was also the approach taken in collecting people's views on their own living conditions in the field survey underlying this study. First of all, people were asked to identify different welfare groups in their community during the pilot study. Secondly, people were asked to categorize themselves in one of these (five) welfare groups during the actual field survey. In that sense, the present study is somewhat more crude than, for example, the work done by Van Praag and Ferrer-i-Carbonell (2004), who developed a methodology to assess personal ‘satisfaction’ in different life domains on the basis of scale measures. By asking people to assess their level of satisfaction in different life domains on a predefined scale, they are able to assess ‘life domain satisfactions’. In our case, we use the method of self-categorization into five predefined welfare categories (see Pouw 2008, on how these categories were identified). The distribution of respondents over the five categories identified is as follows—see Table 4.14.
Table 4.15 Kapchorwa: Binary Logistic Regression Results

Table 4.16 Kabarole: Binary Logistic Regression Results
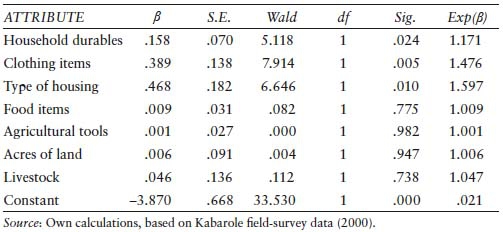
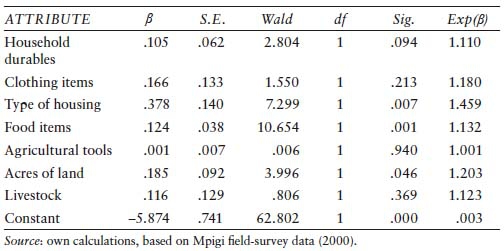
Table 4.17 Mpigi: Binary Logistic Regression Results
Because of the small number of observations in higher-up categories, the number was brought down to four welfare categories by grouping the ‘slightly better off’ and ‘comfortable’ together. We then looked at the explanations people gave for their poverty or relative well-being (Pouw 2008: Appendix 2). We have used this information to further reduce the categories to two only, i.e., ‘poor’ and ‘nonpoor’, and to model this dichotomy against the number of different welfare attributes possessed (or consumed). The two groups are formed as follows. The people who identified themselves as ‘extremely poor/destitute’ and ‘poor’ are categorized as poor. The people who identified themselves as ‘somewhere in the middle’, ‘slightly better off’ and ‘comfortable’ are categorized as nonpoor. Although, one might argue that people who define themselves as ‘somewhere in the middle’ are poor, from looking at the reasons why people categorize themselves as such they mostly state this in positive terms—e.g., because they have land, livestock or a regular source of income.
Table 4.18 Kapchorwa: Classification into ‘Poor’ and ‘Nonpoor’
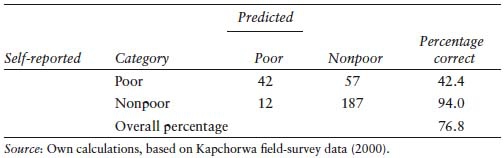
Table 4.19 Kabarole: Classification into ‘Poor’ and ‘Nonpoor’
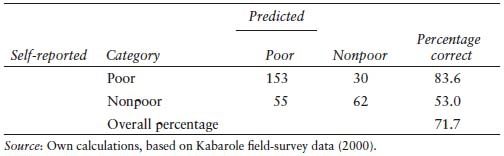
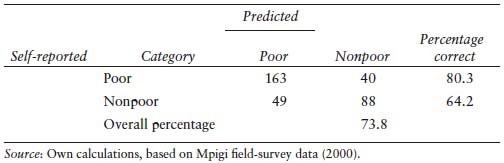
Table 4.20 Mpigi: Classification into ‘Poor’ and ‘Nonpoor’
A binary logistic regression model is estimated to explain whether a household is poor or nonpoor. We have data on N households (i = 1,… ,N) with observations on the number of attributes owned or consumed in seven dimensions (xi1,… xi7) and whether they are poor or nonpoor. This latter characteristic is described by the binary variable yi, defined as
yi = 0 if household i is “poor”
yi = 1 if household i is “nonpoor”
We use a regression model to explain yi . from x1,… xi1and a constant term x0 at district level. The regression results are presented for each of the three districts in Tables 4.15–4.17.
From the regression results above we observe that all variables are positively correlated to household perceived well-being, except for the type of housing and livestock variety in Kapchorwa district. This could have to do with the small variety in housing type in Kapchorwa, where almost all rural households in the sample reside in grass-thatched huts. In Kapchorwa district households, durables and clothing stand out as the variables explaining most of household welfare and with significant results. The use of agricultural tools does not appear as a significant variable in explaining subjective poverty in either one of the three districts. This may be explained by the fact that mostly simple hand tools are used, whereby the variety that is there is less visible. In Kabarole, clothing and type of housing stand out as significant variables. In Mpigi these are type of housing, land and food. Overall, the patterns of interrelationship are less clear than from the more objective analysis in section 4.3. The successful classification rate on the basis of this model varies between 71.7 and 76.8 percent—see Tables 4.18–4.20.
In conclusion of this section we can say that people's subjective perceptions of their personal poverty correspond to a certain extent to their actual ownership, use and consumption of the selected welfare attributes. The binary logistic regression model allows us to differentiate between the ‘poor’ and ‘nonpoor’ for over 70 percent of the households. The subjective poverty findings are partly in line with our earlier findings when more objective measures were used, and partly not. In particular, the subjective poverty analysis points to the relative importance of household durables, housing conditions, land and food consumption in explaining people's subjective views on living conditions.
4.5 LOCAL GOVERNANCE IMPLICATIONS
The findings coming out of the analysis n this chapter suggest that techniques previously developed in the context of attribute ownership and consumption pattern analysis could be usefully applied to data collected in a subsistence context for the purpose of poverty analysis. Hence the living standard of a household can be monitored over time in terms of improved diet and/or housing, better clothing, the upgrading of farm implements, etc. It allows us to assess through a limited set of simple yes/no questions, for example, about which food items were consumed in the last twenty-four hours, or the domestic durable goods owned (a bed, a radio, etc.), a household's level of poverty in relation to its environment. What are the implications of this for mapping and monitoring poverty? The fact that most welfare attributes are significantly correlated is helpful to policymakers once it comes to poverty monitoring and analysis; a policymaker could then find out if there is poverty in one dimension—e.g., at the village or parish level, what the nature of the poverty is in other dimensions. The welfare attributes approach facilitates poverty comparisons across location and time, and at different levels of aggregation, given the assumption that the hierarchy of preferences in consumption and attribute accumulation follows a criterion of efficiency (first things first), and that people climb up the welfare scale by accumulating more attributes (no matter if the nature of these attributes differs between locations). By looking at what welfare attributes are there (or not), policymakers have a rather straightforward statistical tool to identify who is lagging behind and in which dimensions. This type of information can be of immediate relevance and use to, e.g., district development planners and policymakers; it points out the relative constraining factors among an important group of the rural population in each district.
For example, in Kapchorwa district it was found that smallholder farmers are particularly poor in terms of household durable ownership and housing conditions, and cultivate relatively small plots of land. District development policies could be directed at improving the housing conditions of the poor and improve access to arable land. Because it is known that land shortage is a particular problem in Kapchorwa district—because of its dense population and mountain terrain—rural development policies should aim at increasing the efficiency of land use, on the one hand, and develop alternative economic activities in order for farmers to be able to better market their produce and/or diversify into other income earning activities. In this way, households will have more resources available to better provide for their households in terms of shelter, food and household necessities—all which will contribute to the health and generate well-being of the households members. Women's access to land is suspected to be particularly low in Kapchorwa district (as compared to Kabarole and Mpigi), which accommodates some of the more traditional cultures of Uganda, but it seems that the land issue needs to be settled at the national policy level first.
In Kabarole district, smallholder farmers were found to be relatively poor in terms of agricultural tools and livestock ownership. One possible response to this problem could be to support farmers at the village or community level to purchase and maintain a stock of agricultural tools and farm inputs, which can be shared among the community members. The same can be done with livestock—e.g., keeping milk cows to provide for milk and meat. However, causes of the present deprivations need to be analyzed in order for policymakers to formulate a proper response.
In Mpigi district, it was found that part of the population cannot even afford to consume some of the staple foods on a regular basis. These people are most likely to become prone to food hunger in the dry seasons, and they need to be monitored carefully in order for timely response in the form of food aid, for example. At the same time, one could think of more structural policy responses in the form of agricultural extension programmes and/or other welfare programmes, depending upon the cause(s) behind the food-deficiency problem.
Likewise, we can make poverty comparisons at lower levels of aggregation, going down from the district level to the county, subcounty, parish and down to the village level as was shown throughout the preceding chapters. Such comparisons can be particularly useful for targeting development policies and setting up within district projects for assisting the destitute among the poor. The changes in welfare as a result of district policies and programmes can also be more easily monitored. The principal components, as identified in section 4.3, could be leading indicators for monitoring poverty over time. At present there is no commonly accepted method available to inform policymakers as to the direct implications of their poverty-reduction strategies.
The poverty data collected by the field survey underlying this study are: (i) multidimensional, (ii) multilayered (individual, household, village, etc.) and (iii) can be referenced by location. Because of the third feature, it would be possible to make a connection with other survey or population census data. Poverty maps can be made on the basis of one or more poverty dimensions. A similar approach is followed by the ‘unsatisfied-basic-needs approach’ in constructing geographical poverty maps. Such information is of immediate relevance to targeting district level (or lower level) development policies and programmes. If incorporated into a Living Standards Measurement Survey-type household survey, microlevel information on ‘lack of attributes’ could also be combined with census data to construct geographic poverty maps, in line with the work of Hentschel et al. (2000), Alderman et al. (2002) for South Africa and Elbers et al. (2003) for Ecuador. What these studies have shown is that through combining the two data sources it is possible to generate poverty estimates at much lower levels of aggregation than when survey-based estimates are used. In this way, area-specific information on poverty and what are the needs of the poor can be provided and directly used by policymakers for geographic targeting. Rural district-level poverty maps may thus provide a useful basis for poverty assessment and monitoring over time. Further research would be required to determine to what extent the principal components apply to this population subgroup of smallholder farmers as a whole, or are sensitive to geographic location, gender and other household level or individual characteristics. Likewise, we can think of formulating hierarchies of preferences for other socioeconomic subgroups in the population, or look at rural-urban distinctions. In order to monitor changes in poverty and well-being over time, a time series of welfare attributes data is necessary to trace trends. Finally, the subjective element in our poverty data can used to compare and contrast the more objective findings on sequencing patterns and welfare ranking based on this.
4.6 CONCLUSION
In this chapter I have presented a conceptual model and theoretical under-pinning to an approach to poverty research that focuses on welfare attributes accumulation as being crucial to the emergence from subsistence. The approach was further explored methodologically in two different ways. First, on the basis of factor analysis the level of correlation between the different welfare attributes is shown to be moderately strong and significant in multiple dimensions. If people are poor in one dimension, they are likely to be poor in another dimension as well. However, correlation is not perfect, nor significant in all cases. Household durables, agricultural tools and clothing come out as the relatively stronger correlates in all three districts. These are also the variables that rank highest on the list of factor loadings on the principal component(s) identified in each of the three districts. Second, we have used our data on subjective poverty to validate household welfare ranking in terms of the attribute data. We ran a binary logistic regression on the attribute data. It was found that in between 71 and 77 percent of the households are successfully ranked into ‘poor’ and ‘nonpoor’ categories. The subjective poverty analysis gives relatively more weight to housing (in Kabarole and Mpigi), land and food consumption than was observed from the more objective analysis of welfare attributes—although household durables and clothing remain important variables as well. In terms of practical implications, welfare attribute data can be used by policymakers to find out what people are lacking mostly. Furthermore, if repeated over time and/or incorporated into household surveys, a time series can be built, which facilitates the changes in poverty over time within the different dimensions. By looking at what investments and disinvestments people make in their wealth, we can learn how people move in and out of poverty. Moreover, certain population subgroups can be targeted more effectively, especially when welfare attributes data are combined with other data information systems, including geographic information systems.
NOTES
1. The idea of a dominant sequencing pattern characterizing individual household needs links back to Maslov's psychological theory on the hierarchy of needs (1943). Maslov's hierarchy is predominantly aimed at explaining how needs motivate human actions by distinguishing between different categories of needs, and ranking them in a hierarchical order. In economics, the notion of sequencing patterns has been applied mostly to describe (and model) priorities over household durable goods and financial products.
2. These formed the building blocks of a research methodology that was developed in two subsequent steps in Pouw (2008): first, a heuristic step-wise ranking and testing procedure to assess dominance of ranking over pairs of attributes. Second, an econometric model was estimated to predict sequencing patterns in a cross-section of (a selected set of) welfare attributes (Elbers and Pouw 2011).
3. In Elbers and Pouw (2011) the three variables that rank highest in the component matrix, i.e., household durables, agricultural tools and clothing, were used as an input into the estimation of an econometric model.
REFERENCES
Alderman, Harold, Miriam Babita, Gabriel Demombynes, Nthabiseng Makhatha and Berk Özler. 2002. “How Low Can You Go? Combining Census and Survey Data for Mapping Poverty in South Africa.” Journal of African Economies 11(2): 169–200.
Appleton, Simon. 2001. “Education, Income and Poverty in Uganda in the 1990s.” CREDIT Working Paper 01/22. Nottingham, UK: University of Nottingham, Economics Department.
Biswas-Diener, Robert, and Ed Diener. 2001. “Making the Best of a Bad Situation. Satisfaction in the Slums of Calcutta.” Social Indicators Research 55: 329–359.
Chambers, Robert. 1989. “Vulnerability, Coping and Policy.” IDS Bulletin 20. Brighton, Sussex, UK: Institute of Development Studies.
Deaton, Angus. 1997. The Analysis of Household Surveys: A microeconometric approach to development policy. Baltimore and London: Johns Hopkins University Press for The World Bank.
Deaton, Angus, and John Muellbauer. 1980. Economics and Consumer Behaviour. Cambridge: University of Cambridge Press.
Dercon, Stefan. 2005. “Vulnerability: A Micro Perspective.” InSecuring Development in an Unstable World, edited by François Bourguignon, Boris Pleskovic and Jacques van der Gaag, 117–146. Washington, DC: The World Bank.
Devereux, Stephen, Bob Baulch, Ian Macauslan, Alexander Phiri and Rachel Sabates-Wheeler. 2006. “Vulnerability and Social Protection in Malawi.” IDS Discussion Paper 387. Brighton, Sussex, UK: Institute of Development Studies.
Elbers, Chris, and Jan Willem Gunning. 2006. “Poverty, Risk, and Accumulation: Pro-Poor Policies When Dynamics Matter.” Unpublished Manuscript, Amsterdam: Free University Amsterdam.
Elbers, Chris, Jean Olson-Lanjouw and Peter Lanjouw. 2003. “Micro-Level Estimation of Poverty and Inequality.” Econometrica 71 (1): 355–364.
Elbers, Chris, and Nicky Pouw. 2011. “Modelling Sequencing Patterns in Asset Acquisition: The Case of Smallholder Farmers in Three Rural Districts in Uganda.” SSRN Working Paper. Available at SSRN: http://ssrn.com/abstract=1831323.
Fafchamps, Marcel, and Forhad Shilpi. 2007. “Isolation and Subjective Welfare.” CEPR Discussion Paper 6001. London: Centre for Economic Policy Research.
Filmer, Deon, and Kinnon Scott. 2008. “Assessing Asset Indices.” World Bank Policy Research Working Paper 4605. Washington, DC: The World Bank.
Filmer, Deon, and Lant Pritchett. 2001. “Estimating Wealth Effects without Expenditure Data—Or Tears: An Application to Educational Enrolments in States of India.” Demography 38(1): 115–132.
Government of Uganda. 2001. “Uganda Poverty Status Report, 2001.” Kampala, Uganda: Ministry of Finance, Planning and Economic Development.
Harman, Harry. 1976. Modern Factor Analysis (3rd edition.). Chicago: University of Chicago Press.
Henninger, Norbert, and Mathilde Snel. 2002. “Where Are the Poor? Experiences with the Development and Use of Poverty Maps.” Washington, DC: World Resources Institute.
Hentschel, Jesko, Jean Olson-Lanjouw, Peter Lanjouw and Javier Poggi. 2000. “Combining Census and Survey Data to Trace the Spatial Dimensions of Poverty: A Case Study of Ecuador.” The World Bank Economic Review 14(1): 147–165.
Janvry, Alain de, Marcel Fafchamps and Elizabeth Sadoulet. 1991. “Peasant Household Behaviour with Missing Markets: Some Paradoxes Explained.” Economic Journal 101: 1400–1417.
Kim, Jae-On, and Charles Mueller. 1979. Statistical Methods and Practical Issues. Beverly Hills, CA: Sage Publications.
Kingdon, Geeta, and John Knight. 2004. “Well-Being Poverty Versus Income Poverty and Capabilities Poverty?” CSAE Working Paper 2003–16. Oxford, UK: Oxford University, Centre for the Study of African Economies.
Krishna, Anirudh. 2004. “Escaping Poverty and Becoming Poor: Who Gains, Who Loses, and Why?” World Development 32(1): 121–136.
Krishna, Anirudh. 2007. “Subjective Assessments, Participatory Methods and Poverty Dynamics: The Stages-of-Progress Method.” CPRC Working Paper 93. Manchester, UK: University of Manchester, Chronic Poverty Research Centre.
Ledo Garcia, Maria del Carmen Ariet. 2002. Urbanisation & Poverty in the Cit ies of the National Economic Corridor in Bolivia: Case Study: Cochabamba. Delft, Netherlands: Transformations No. 5.
Lokshin, Michael, Nithin Umapathi and Stefano Paternostra. 2006. “Robustness of a Subjective Welfare Analysis in a Poor Developing Country: Madagascar 2001.” The Journal of Development Studies 42(4): 559–591.
Maslow, Abraham. 1943. “A Theory of Human Motivation.” Psychological Review 50: 370–396.
Narayan, Deepa, Lant Pritchett, and Soumya Kapoor, eds. 2009. Moving out of Poverty: Success from the Bottom-Up. Washington, DC: Palgrave and The World Bank.
Norton, Andy, and Mick Foster. 2001. “The Potential of Using Sustainable Livelihoods Approaches in Poverty Reduction Strategy Papers.” Centre for Aid and Public Expenditure Working Paper 148. London: Overseas Development Institute.
Pouw, Nicky. 2008. The Characterization and Monitoring of Poverty. Thela Thesis. Amsterdam: Rozenberg Publishers.
Praag, Bernard van, and Ada Ferrer-i-Carbonell. 2004. Happiness Quantified. A Satisfaction Calculus Approach. Oxford: Oxford University Press.
Pradhan, Menno, and Martin Ravallion. 2000. “Measuring Poverty Using Qualitative Perceptions of Welfare.” The Review of Economics and Statistics 82(3): 462–471.
Sadoulet, Elizabeth, and Alain de Janvry. 1995. Quantitative Development Policy Analysis. Baltimore and London: Johns Hopkins University Press.
Thorner, Daniel, Basile Kerblay and R. E. F. Smith, eds. 1986. A.V. Chayanov on the Theory of Peasant Economy. Manchester, UK: Manchester University Press.