8 Mapping Urban Poverty for
Local Governance in Delhi
8.1 INTRODUCTION
As was stated in the introductory chapter to this volume, recent discussions of poverty have recognized its multidimensional character. Whereas classic approaches to poverty have focused solely on issues of income and consumption, the newer alternative approaches focus on the multiple sources of deprivation that poor households experience, and which hinder their efforts to obtain higher levels of well-being. These deprivations are linked to ways in which households live and work, the access they do or do not have to collective and/or state-provided resources, and the extent to which poor households can make their needs heard politically or can organize collectively to build up assets (Satterthwaite 1997; Moser 1998; Narayan et al. 2000; McGee and Brock 2001; Rakodi and Lloyd-Jones 2002). A recent characterization of urban poverty lists eight types of deprivations. They include: inadequate and unstable incomes, inadequate, unstable or risky asset bases (such as lack of education and housing), inadequate provision of public infrastructure (piped water, sanitation, drainage, roads and footpaths), inadequate provision of basic services, limited safety nets for those unable to pay for services, inadequate protection of poorer groups through laws and rights and powerlessness of poorer groups within political and bureaucratic systems (Mitlin and Satterthwaite 2004).
These deprivations indicate very clearly that poverty consists not only of lack of work and income, but also is produced by the collective ‘structures of constraint’, which make it difficult for poor households to meet their own needs and gain access to collective provisions of services from which they are excluded. These aspects interact with each other and deepen poverty for individual households, with deprivations in one area preventing them from meeting their needs in other areas (Baulch 1996; Sen 1999). For example, poor housing, lack of drinking water and sanitation can lead to poor health, preventing people from working effectively and reducing their ability to earn an income. This can have a knock-on effect on their food intake and that of other household members.
Such approaches are also characterized by their views of households and their members as active actors in their own right, not as passive victims. This is best illustrated by the ‘assets/vulnerability’ approach which recognizes that individuals and their households have differing sets of ‘capitals’ which they can use to improve their well-being, even when they have low incomes (Moser 1998; Rakodi and Lloyd-Jones 2002)1. In urban areas, such capitals consist of:
- Human capital (health, education and training, employment),
- financial capital (savings and income, household assets (jewelry, other capital goods),
- physical capital (housing and basic services),
- social capital (extent of collective organization and social networks).
The last capital—natural capital (i.e., ownership of land, physical resources or water rights)—is usually not included in the urban context (Moser 1998). Ownership of land is subsumed under ownership of housing. Access to open spaces has not been discussed under this heading by authors working on urban poverty.2 Case studies of urban livelihood strategies and poverty suggest that households find it important to build up the different capitals in conjunction with each other, and that one type of deprivation also affects other types of household assets (Rakodi and Lloyd-Jones 2002; Beall 2002).
Although the new approaches to poverty are substantively great improvements over earlier approaches to poverty, they still have two limitations. The first concerns the limits of the case studies on which our current information is built. Although local case studies provide much-needed insights into ways households build up different capitals and the constraints they face, they provide no information on the extent to which such deprivations hold true across large sections of urban populations (Moser 1998). This leads to an underestimation of urban poverty, and too little knowledge about the interaction between different deprivations contributing to poverty in urban areas (Satterthwaite 2004). Secondly, urban planners and local governments often lack sufficiently disaggregated data within their urban areas of jurisdiction to implement antipoverty policies effectively. It is very difficult for them to indicate spatial patterns of poverty within cities in developing countries. This makes it difficult to support urban governance—i.e., the interventions by government and its partners—in strategically counteracting patterns of deprivation within cities. Therefore, spatial information disaggregated to the lowest level at which decisions on interventions are made within cities could contribute to improving local governance (Henninger and Snel 2002).
This chapter contributes to reducing existing limitations in our understanding of urban poverty, by utilizing the concept of multiple deprivations for defining poverty and constructing a multiple deprivations index. It is based on the analytical framework of capitals used within the livelihoods approach, generally adopted by researchers working on poverty issues in both rural and urban areas. The choice of indicators follows this model; it is based on a combination of social, economic and habitat/infra-structural factors which strongly influence a household's livelihood strategies. We process a large-scale database (extracted from the Census of India 2001) within geographic information systems (GIS) to analyze the composition and prevalence of urban poverty in one Indian megacity— Delhi. The choice for Delhi (and Mumbai and Chennai in later analysis) is based on the rationale that the differences in level of poverty/deprivations are very wide within the metropolitan cities of India (Sivaramakrishnan et al. 2005); this implies that knowledge is needed on the extent, location and concentration of such deprivations in order to be able to make urban governance more effective by targeting interventions where they are needed.3
Processing the census through GIS within the livelihoods framework allows us to examine the question what factors contribute to poverty and how widespread it is within cities, i.e., the extent to which households in different sections (electoral wards) of the city have been (un)able to build up their assets in Indian cities. This level of poverty analysis is strategic for urban governance, because after the implementation of the 74th Amendment Act to the constitution, the electoral ward level is the lowest level of political representation for citizens of local government. Analysis at this level allows us to raise the question of what deprivations occur within specific wards, and indicate what areas of deprivation can be addressed by local governance mechanisms (councilors and administrative offices).
More specifically, the chapter deals with the following four questions: (1) to what extent the different aspects of poverty are spatially concentrated in the concerned cities such that hotspots of poverty emerge, (2) the extent to which different aspects of poverty contribute to the overall level of poverty at the ward level, (3) whether the highest levels of poverty (at electoral ward level) are correlated with other measures of poverty (slums, number of households below the poverty line) and (4) whether there are differences in the extent to which poor and non-poor households are collectively organized and make their voice known through local elections. In each section we indicate the connections to urban governance issues, and in the final section, the relation between poverty analysis and urban governance mechanisms is analyzed specifically.
The first question examines to what extent deprivations are spatially concentrated in cities, such that ‘hot spots’ of poverty at ward level can be seen. If deprivations are randomly distributed in cities, tackling them requires broader interventions than if they are spatially concentrated.4 Concentration can take two forms: multiple deprivations in one area and several areas which show similar levels of multiple deprivations (clustering). Concentrations of multiple deprivations indicate geographic areas where governments could concentrate interventions across the board, in order to increase access to collective infrastructure and services.
The second question fits into the discussion on the extent to which different deprivations occur together and influence each other, such that their effects are cumulative (Narayan et al. 2000; Krishna 2003; Devas 2004). The data allow us to examine statistically to what extent various deprivations occur together, and what their relative strength is. This is important to know as poor households struggle to get out of poverty and build up their capitals. For instance, if lack of good housing has a stronger effect on poverty than lack of transportation, municipal authorities could provide scarce funding for good housing by and for poor households as an effective support (Kundu 1993; Kundu and Mahadevia 2002).
The third question examines the degree to which poverty corresponds with the presence of slum areas and areas where city governments currently take antipoverty measures. The assumption that poverty is concentrated in slums is often made in both studies and policy, but it may not necessarily hold true, especially where large parts of urban areas are characterized by substandard housing. Studies of Dharavi in Mumbai have shown that a vibrant economy exists in the slum, and a substantial number of households cannot be characterized as very poor (Sharma 2000). It also provides us with insights into the extent to which poverty corresponds with interventions directed to the poor, such as the ration card on the basis of BPL designation (Department of Food and Civil Supplies). In this way it provides a check on whether targeted interventions are actually reaching the households for which they are designed.
The fourth question concerns the extent to which citizens can make their voices heard. This issue has been discussed widely in the context of participatory urban or local governance by increasing the feedback from citizens about their priorities and improving the accountability of local governments to their citizens (e.g., special issue of Environment & Urbanization on Participatory Governance, 2004; Cavill and Sohail 2004). Because local councilors are elected within Indian cities since 1992, this is a recent indicator which indicates the importance households give to this opportunity.
8.2 MAPPING POVERTY: COMPARING APPROACHES
There is interest in analyzing spatial patterns and concentrations of different forms of poverty in both developing and developed countries. This is reflected in the variety of case studies mapping poverty in Europe and in the South (e.g., Bigman and Fofack 2000; Henninger and Snel 2002; Labbate et al. 2004; Orford 2004; Harriss and Longley 2004; Boyle and Alvanides 2004). According to these authors, poverty mapping consists of the following steps:
- Defining the purpose and expected use of mapping
- selecting the measures of poverty and well-being
- selecting input data
- selecting method of estimating or calculating the poverty indicator
- selecting a method to calculate, estimate or display poverty indicator for geographical area
- deciding on number of units for final maps to display data
- producing and distributing maps
- monitoring usage and feedback
In this article we carry out several steps in poverty mapping; namely, 2, 3, 4, 5, 6 and 7.5
Poverty mapping is not yet standardized, but until now has consisted of mainly two approaches, which are used respectively by the World Bank and UNDP. The former uses an expenditure-based econometric approach, based on small area estimation (Henninger and Snel 2002). The latter uses a value-focused approach, based on its composite human development index. Such indexes are also referred to as the ‘unsatisfied basic needs’ indexes, and are mainly used in South America (ibid.), as well as in several European countries (DETR 2000; Noble et al. 2006).
The small-area-estimation approach is based on a combination of households survey and the use of national household-level data, such as the census. Both datasets should have some matching variables. Within the household survey, correlations are established between the expenditures (y) and other explanatory variables, such as education and household characteristics (x). The correlations found in the survey are then used to predict household expenditure levels from the national dataset, such as the census, for small areas in the country. Usually this technique is linked to a poverty line in analyzing its outcomes. However, this is not a necessary precondition (Henninger and Snel 2002).
The composite indexes can be based on nonexpenditure-related data, reflecting a range of ‘unsatisfied needs’. Such composite indexes can reflect the full range of deprivations households face (Baulch 1996; McGee and Brock 2001; Noble et al. 2006). This can include deprivations in terms of physical habitat, lack of access to education and health services as well as insecure employment. All components are usually weighted equally. The approach developed by UNDP recognizes the multidimensional character of well-being by including health, education and life expectancy at birth in its human development index (HDI)6.
We are using the second type of index for several reasons. To begin with, the livelihoods approach is based on the combination of ‘capitals’ that households are able to build up, and not on consumption patterns alone. It also allows us to also determine the degree of access households have to collective state-provided resources as part of their livelihood strategies in addition to their individually built-up assets (Baulch 1996; McGee and Brock 2001). Patterns of wealth (assets ownership) are also recognizable not only from consumption, but also from patterns of physical capital ownership (housing, movable assets). Similarly, the British have developed the Index of Multiple Deprivation, which also includes a similar full range of indicators from the British Census (DETR 2000; Noble et al. 2006).
Secondly, the small-area-estimation approach is usually based on a combination of household survey and census data, in which the heterogeneity in the total population is calculated indirectly through a much smaller sample survey among households. Correlations established from the households survey between expenditure and other household characteristics are used to calculate heterogeneity in other small areas; the first step in the process actually limits the extent of heterogeneity to be found elsewhere (Henninger and Snel 2002). This makes it difficult to reflect strong regional heterogeneity in patterns of expenditure. Expenditure data are also notoriously vulnerable to under- and overestimation by respondents, because of shame of poverty or fear of taxation. However, a sampled household survey across income groups could be useful to establish which indicators distinguish best between ‘income’ groups; such a survey should be matched as far as possible to the wider population dataset to be used for the poverty mapping exercise. We have done this by carrying out household surveys in the three cities covered in the total research project, across the groups in the different types of neighborhoods (see Annex 8.1).
Thirdly, mapping of the resulting data was found to be quite varied in the set of studies examined by Henninger and Snel (2002). Researchers differed in their choice of mapping approach, level of disaggregation, and their choice of geographic boundaries and indicators. Such choices matter, as they can lead to a reranking of regions, communities or households, or lead to quite different policy conclusions (Davis 2000). Especially if such differences are linked to targeted financing programs by governments or are used by companies to prioritize their investments, such rankings take on political meanings (Henninger and Snel 2002).
Apart from census data and different types of surveys with some kind of geographical referencing, valuable information on spatial differences can be derived from geographic information technology (GIT). High-resolution remote-sensing images, such as IKONOS, Quickbird or IRS (www.landinfo.com), which favor mapping at a scale of 1:10000–1:25000, or conventional aerial photographs, which are regarded as a primary source of remotely sensed information at the land parcel level (Masser 2001), are powerful tools for detecting physical structures. A study in Addis Ababa used remote-sensing image showing the pattern, size and irregularity of groups of small buildings lacking open spaces to indicate areas of high density and poor living conditions in the built environment. Even though visual image interpretation provides important data on physical elements, it needs to be combined with other spatial data, field visits and secondary data to generate useful information on poverty, which is usually not feasible for the spatial scale of megacities.
Mapping spatial distribution of poverty within a country using census data and different kind of surveys can be done at different geographic scales. In Britain, the Index of Multiple Deprivation 2004 (IMD 2004) is commonly applied to measure multiple deprivations at the small-area level (Noble et al. 2004) or to identify spatial concentrations of poverty within cities at ward level (Orford 2004; Harriss and Longley 2004).7 In countries in the global South, little attention has been paid to identifying spatial concentrations of deprivation in urban areas, partly caused by the lack of appropriate data at a sufficiently disaggregated level (Petrucci et al. 2003).
India does have a regular, well-validated census carried out every ten years as well as national sample surveys on households at more regular intervals (every four years).8 The census data can be disaggregated to the lowest level of administration and electoral representation in cities (i.e., to the electoral ward level) because of its complete coverage.9 This makes it possible to match spatial differences in poverty levels (and the variety of factors loading onto the multiple deprivation index) with the level of administration and electoral representation closest to local citizens). This has the potential to link local governance more effectively with needed data for tackling poverty issues. A caveat of course is that the long intervals between censuses make this data gradually less reliable in actual policy implementation (Deichmann 1999; Noble et al. 2006).
The census also presents data on a variety of indicators of well-being, which makes it possible to construct a composite index reflecting the deprivations households experience as poverty or a lack of well-being. The authors have used data generated from the 2001 census database, disaggregated to the electoral ward level for three Indian megacities (Delhi, Bombay and Chennai) in constructing a composite poverty index, as explained in the following section. In this article only the results for Delhi are discussed.
8.3 POVERTY STUDIES IN INDIA
In this section, we briefly look at the types of poverty studies done on India. There is no pretension at being comprehensive in this section; we want to bring out some salient points in the various discussions, which inform our own work. A first issue in poverty studies is whether poverty is defined in absolute or relative terms (Beteille 2003). Beteille and many sociologists with him argue that poverty is relative in time and space and therefore takes on different forms and content. The differences in form and contents are reflected in the two main approaches to poverty found in India; the first being the set of approaches which recognizes various factors as contributing to poverty (livelihoods approach), and the second set of approaches limiting poverty to deprivations in the area of consumption and income (however measured).
The livelihoods approach recognizes a variety of capitals which make a household capable of producing well-being for its members, or the lack of which prevent them from doing so (e.g., Krishna 2003). Similarly, Sen's capabilities approach indicates that human beings need a variety of endowments to realize their full set of ‘freedoms’ as human beings (Sen 1999; Drèze and Sen 2002). The human development index as used in the India Development Report (and the state reports which follow from it) recognizes longevity, education and employment/income as contributing factors (GOI 2001). All these approaches have in common that they analyze poverty or deprivations as the result of a number of individual as well as institutional factors, not only the lack of income and/or consumption.
The dominant approach to poverty uses levels of consumption as an absolute measure of poverty, using a poverty line as basis for classifying people (or households) as being poor or non-poor (head-count measure). Again, there are a variety of methods to assess poverty in this way—a biological minimum of consumption necessary to survive, or a socially accepted minimum standard of living (Saith 2005). In India, official poverty lines are based on expenditures for a minimum food basket, differentiated by rural and urban areas.10 This type of approach has been used in India since independence by government planners and organizations.11
Saith (2005) critiques the latter approach because it does not capture adequately what poverty means in the lives of actual households. His main points of disagreement, which also inform our stance on poverty issues, are that it does not capture a number of issues influencing poverty in essential ways. First, expenditure lines do not capture the (lack of) assets which households may have (or sell) which reduce their vulnerability in the longer term. These include land, homes, larger capital goods which may serve as forms of saving/assets to be sold off only in extreme circumstances. Their loss needs to be counted as part of poverty. Secondly, the health situation of family members can be an asset or liability (when labor is directed to the care economy and ill family members cannot work). Third, spatial segregation and social exclusion among poor households is not covered in such approaches, despite the fact that it reduces households' access to state- or community-provided resources (Kuffer et al. 2006).12
Poverty manifests itself in different ways across space and time. In Europe, early studies of poverty focused mainly on urban poverty as a result of industrial capitalism, as its concentration made it very visible (Beteille 2003). In India, poverty was widespread before the rise of capitalism, and was strongly linked to differences in caste and regional economies (Beteille 2003). Whereas in Europe, poverty was seen as a social problem, in India, since independence, poverty has been usually linked to economic stagnation and lack of growth (Beteille 2003).
Studies on urban poverty in India from the last forty years are relatively few and are usually focused on employment issues or discussions on deprivations in slum areas in terms of infrastructure and services, without conceptualizing poverty directly (Streefkerk 1983; Harriss 1982, 2005; Holmstrom 1984; Sivaramakrishnan 1991; Kundu 1993; Schenk 2001; Kundu and Mahadevia 2002; Breman 2004). Earlier studies were concerned with employment and labor-relations issues, focusing on the strength or weakness of trade unions and other social ties in protecting workers’ basic rights. Studies in the 1990s mainly by planners and architects focused more explicitly on the access of the poor to services and housing infrastructure, and concluded that discrimination was still prevalent on the basis of caste, class and regional identities. The strength of these studies in connecting poverty to employment and living conditions is that they illustrate the ways in which lack of infrastructure and services, political structures and hierarchical labor relations influence people's social and economic mobility. The weakness is that these studies utilize data at national or state level, and do not disaggregate to the city or within-city level, and are currently ignored by most economists.
In India, studies and policies concerning urban poverty have often focused specifically on slum areas (e.g., de Wit 1996). This is a logical perspective for framework and methodology to poverty studies, based on the assumption that slums form concentrations of poverty. However, in this chapter, we will show that in fact this assumption is not correct for Delhi. This may mean that studies which are based on this assumption may be missing large pockets of poverty in other areas of the cities concerned.
8.4 MAPPING HOTSPOTS OF MULTIPLE DEPRIVATIONS
We now come back to the questions raised earlier concerning poverty mapping in Delhi. To provide a context, a short description of Delhi is given. This is followed by the conceptualization of poverty and research methodology used. Subsequently, the results of the analysis are given.
Delhi
The Municipal Corporation of Delhi (MCD), the capital of India, lies within the National Capital Territory of Delhi, and had an estimated population of 13.78 million people in 2001. Within its jurisdiction are some of the most densely populated areas in the world, reaching 150,000 inhabitants per km2. with an average population density of 9,523 persons/km2.. The population dynamics in the city have been characterized by large-scale migration for employment into the city, mainly from the neighboring states (Dupont et al. 2000).
The MCD covers approximately 1,450 km2. and consists of twelve zones with 134 electoral wards of different geographical size (from 0.4 up to 116 km2.) as well as in number of inhabitants (from 8,700 up to 260,085).13 The areas covered by the MCD do not include those belonging to the Delhi Cantonment Board and the New Delhi Municipal Council area, which come directly under the central government (the census data used do not include the Delhi Cantonment and New Delhi area, reflected by the white areas in the maps).14 The Delhi agglomeration is wider, of course, but the analysis here is confined to the MCD.15 The MCD was established in 1958 by an act of parliament. The 74th Constitutional Amendment brought about fundamental changes in the composition, governance and administration of the corporation. The number of electoral wards increased from 100 to 134, and wards committees were set up.16 This means that representatives at the electoral ward level could prioritize interventions, if they would have the information concerning existing deprivations in their areas.
Defining Deprivations/Capitals
Mapping multiple deprivations to improve urban governance involved several processes. First, different deprivations of households or people were defined, based on the assets/vulnerability approach (Moser 1998), and for each deprivation indicators reflecting the lack of a particular capital in India were identified and hierarchically structured into a multicriteria model. The conceptual model was operationalized using the results of fieldwork-based household surveys in three metropolitan cities carried out under our responsibility.17 Its results were then matched to selected datasets of the Indian census, disaggregated to the spatial level of an electoral ward. The India Census is generally considered by scholars to be very reliable in including the majority of marginalized people—including those in nonauthorized slums. The main group it leaves out is the people living on the street, without an address. These tables were processed within a geographical information system, which supported the calculation and overlay of indicator maps and the representation of spatial modeling results. In the third phase the results of the geographical analysis were linked to principles of urban governance.
In this study the four different types of capital/deprivations in capitals generally used in urban livelihood approaches were utilized: social capital, human capital, financial and physical capital.18 The indicators chosen were validated on the basis of smaller household surveys carried out by fieldwork conducted within our own research programme in Delhi, Mumbai and Chennai, which established the most striking differences between high-income (HIG), middle-income (MIG), authorized slum and unauthorized slum neighborhoods (for a full discussion on the household survey methodology, see Annex 8.1).
Social capital has been defined by Moser (1998) as ‘reciprocity within communities and between households based on trust related to social ties’ and by Rakodi (2002:11) as ‘social resources (networks, membership of groups, relations of trust and reciprocity, access to wider institutions of society)'. Harriss has discussed the distinctions in social capital made between ‘bonding social capital’ reflected within homogeneous communities, bridging social capital between different communities, and linking social capital, between communities of different social status and power (Harriss 2001). In India, caste still strongly structures social networks, and discrimination of scheduled castes remains high—a form of negative linking social capital, which prevents low-caste households from utilizing opportunities to increase their well-being and reduce deprivations (Beteille 1983; Deolalikar 2005). The level of exclusionary practices toward scheduled castes is confirmed in a recent report on reaching the millennium goals in India; it indicates that scheduled castes show systematic differences in child mortality, school enrolment and malnutrition rates among children (Deolalikar 2005). The census data of 2001 also show significant differences in the access of scheduled caste households to employment and basic services. Data on exclusionary practices towards other social groups (such as Muslims) are not available at disaggregated levels within cities.19 Therefore, the indicator of ‘scheduled caste’ provided by the census was chosen as a proxy for the deprivations linked to exclusionary processes based on caste—such as discrimination in access to employment, housing and basic services.20
Human capital is defined by Moser (1998) as the ‘health situation, which determines people's capacity to work, and skills and education determining the returns to their work’, and by Rakodi (2002) as ‘labour resources available to households’. The census does not provide data on the health situation within households, which limits our possibilities of including it. One can make the argument that it is reflected indirectly in the extent to which members of the household are able to work, both in terms of number of earners and in the amount of time spent in work (Krishna 2003). Therefore, we have mainly focused on the household's education and labor capital, reflected by the number of literate people within the ward and the number of employed people (main workers in the Indian Census).21 Deprivations in the area of education are reflected in the percentage of people excluded from education at any level (illiteracy).
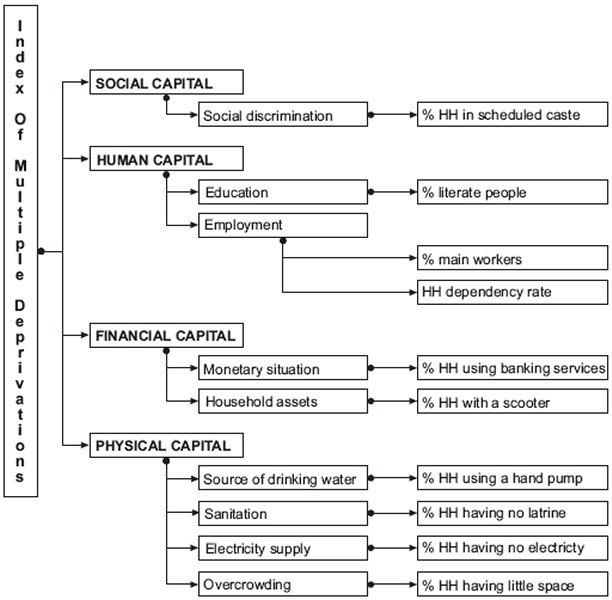
Figure 8.1 Criteria model to map multiple deprivations.
The vast majority of India's working people work in the nonregistered sector, i.e., in occupations not protected by labor legislation, firm legislation or trade-union agreements (around 83 percent of the total workforce—Chen et al. 2005). This implies that the majority of people in the category of ‘main worker’ work in nonprotected occupations (e.g., hawkers and other service-sector workers, self-employed producers and employees in small-scale enterprises).22 The ‘main worker’ reflects the importance given by the households themselves to the concerned person's work in terms of the time spent and income earned within the total of household income. What the earned income means for the household depends on the number of ‘consumers’ within the household it has to maintain. For this reason we have included the ratio of people dependent on the working people within the household, quantified by the average number of dependents per household at ward level (Krishna 2003).23
Moser defines financial capital as ‘productive capital’, and she indicates that housing is often poor people's most productive asset (Moser 1998). Rakodi (2002) defines it as ‘financial resources (savings, credit, remittances and pensions)’, which reflects a wider range of ways in which households build up financial reserves (or experience vulnerability). Ownership of houses was not chosen as an indicator because this turned out to be similarly high across all groups in our household survey, and would not distinguish well poor households from others (see Annex 8.1).
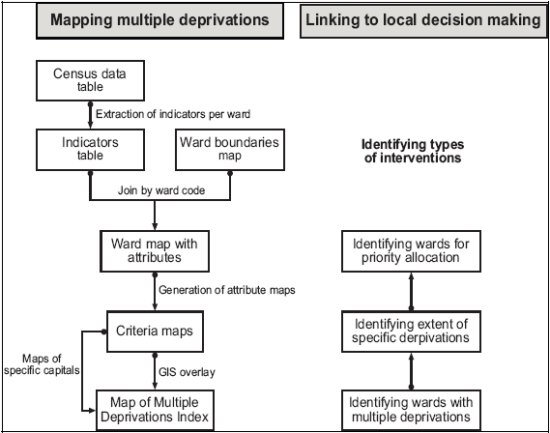
Figure 8.2 Flowchart of mapping methodology.
Savings and credit in India are often obtained through capital in kind. Women buy jewelry or large household items (e.g., ‘steel’ pans, cooking stoves, watches) and pawn them to obtain credit. Access to formal banking services is limited to those working in formal, registered employment. In consequence, in addition to access to banking services on which the census provides information, large-scale capital goods owned by the households were used as a proxy for the level of financial capital reflected in their purchases. Although six such capital goods are indicated in the census, our own household surveys indicated that one of them most clearly discriminated between household categories in Delhi (and the other cities), so that only ‘motorized scooters’ were included as an item. We assume that more access to banking services and ownership of capital goods implies fewer deprivations for households.
Rakodi (2002) defines physical capital as ‘the basic infrastructure (transport, shelter, water, energy, communications) and the production equipment which people need to pursue their livelihoods’. Moser calls this ‘productive assets’, although she includes housing as a possible form of productive asset (Moser 1998). In this study, we have included the physical capital indicators pertaining to the housing/habitat, as this applies to all households.
The conceptualization led to the criteria model illustrated in Figure 8.1, which defines the indicators constructed from the 2001 census. Although it is clear that the census limits to some extent the multidimensionality which is inherent in the livelihoods approach, it is an improvement over simple money-metric measures, which do not recognize the cumulative negative impact of other factors included here.
8.5 PROCESSING THE CRITERIA MODEL WITHIN GIS
To apply the conceptual multicriteria model at the level of electoral wards using the GIS Ilwis Academic 3.3 (ITC 2005), indicator values characterizing the four capitals (the right-hand columns of the model in Figure 8.1) were derived from several census tables at the ward level, and matched to the digitized boundaries of the electoral ward zones. Within the GIS, an attribute map was created for each indicator showing its spatial distribution across the electoral wards. In order to aggregate the indicator maps to the intermediate level of a capital and to the final index of multiple deprivation, the attribute maps were standardized to values between 0 and 1 indicating no poverty (0) and extreme poverty (1). To compare the wards according to the index of multiple deprivations and the lack of individual capitals, the standardized attribute maps were combined by means of weighted sums, in which each capital (and within one capital each indicator) was considered to have equal weight. In this way the variety of aspects involved in constructing the index of multiple deprivations was synthesized. The various steps of the operationalization are illustrated in Figure 8.2.
The resulting index of multiple deprivations indicates average levels of deprivation in the various ‘capitals’ that households need at the ward level and was used to compare differences in deprivations across wards in Delhi. Combining attribute maps into a composite index map leads to bad performance on one criterion being compensated by good performance on another, resulting in average poverty levels across wards. In order to prevent undifferentiated conclusions, the final outcome of the multicriteria overlay (i.e., the map showing the spatial differences of multiple deprivations) is overlaid with the input maps and the maps showing the spatial patterns of specific capitals. By means of a look-up table, the loading of each input map (Table 8.1) and intermediate map (‘capital’ level) to the final poverty index of the ward can be traced back for a more specific analysis. This option is particularly important when the link between poverty analysis and governance is made, in which interventions need to be matched to specific deprivations.
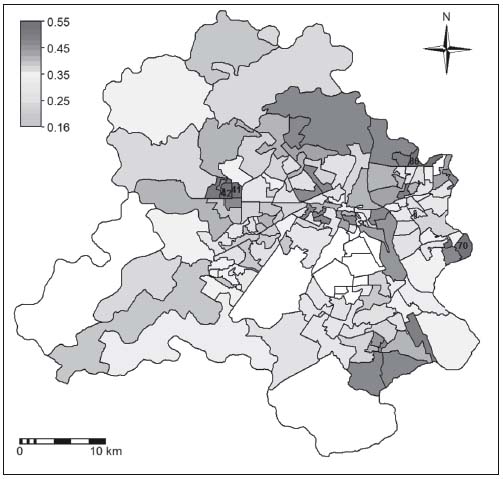
Figure 8.3 Hotspots of poverty in Delhi Corporation area: spatial concentration of multiple deprivations.
Note: High values (red) indicate a high multiple poverty index per ward. Areas for which no data were processed are kept white.
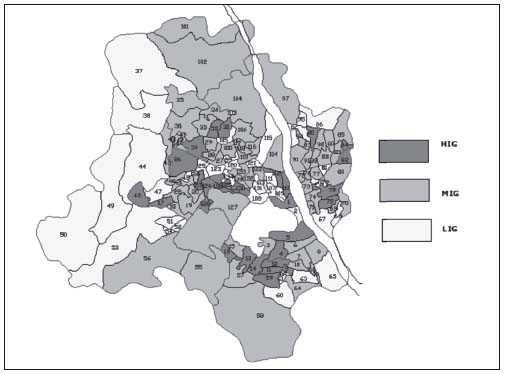
Figure 8.4 Income levels by electoral ward in Delhi Corporation area.
Source: Calculated from ‘Consumer Market Demographics in Urban India’, by NCAER, New Delhi (2002).

Figure 8.5 Single deprivations and multiple deprivation index in the hotspots (wards 41 and 42) and their surrounding wards in Delhi.
Source: Calculated from ‘Consumer Market Demographics in Urban India’, by NCAER, New Delhi (2002).
8.6 MAPPING RESULTS
Poverty Hotspots?
The first question raised for analysis concerned the extent to which different aspects of poverty are spatially concentrated in Delhi, such that hotspots of poverty emerge. Such concentration of multiple deprivations concentrated in one area makes it difficult for households to find a way out of poverty because they have to deal with several deprivations at the same time. It also means that intervention programs would have to do the same to have a meaningful impact.
The method used to answer this question was to make a multicriteria overlay on the map of Delhi. The resulting map shows the spatial variation in the index of multiple deprivations (IMD) (Figure 8.3).24 Figure 8.3 clearly illustrates that in Delhi deprivations are spatially concentrated in electoral wards 41, 42, 70 and 87. In those wards the IMD is significantly higher (= higher than the mean + 2Std.) than the mean IMD for the whole corporation area. This result indicates that deprivations are cumulative at the electoral ward level, and that hotspots of poverty can be clearly identified. The electoral wards showing the highest levels of deprivation also are generally in areas where incomes are low, as indicated by a separate map of Delhi indicating income categories (see Figure 8.4).
A second part of this question is whether poverty hotspots themselves are clustered together, so that a whole ‘poor area’ exists (Orford 2004). We found little clustering of wards with a similar degree of poverty.
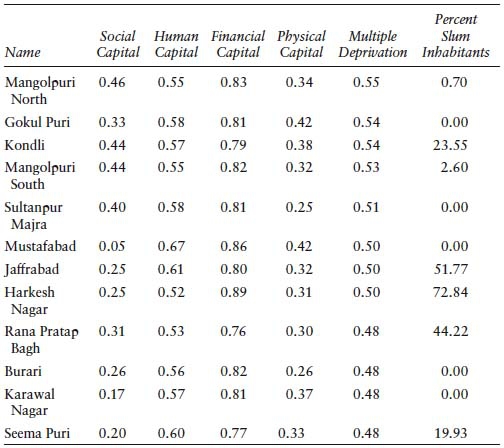
Table 8.1 Hotspot of Poverty Wards in Delhi: Lack of Capitals Contributing to the Index of Multiple Deprivations

Table 8.2 Ranges, Mean and Skewedness in Capital Deprivations for All Wards in Delhi
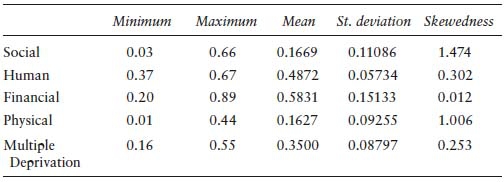
Figure 8.5 indicates that the wards which surround the ‘hotspots of poverty’ (wards 41, 42) are wards with much lower levels of deprivation on the IMD, as well as on each type of deprivation individually. Our conclusion is that wards with a high IMD are thus fairly isolated, and can be found adjacent to wards with lower levels of deprivations. In the case of Mangolpuri, it is even next to ward 43 with the lowest IMD in the Delhi Corporation area (0.16). This suggests that it is feasible to target intervention strategies through the ward offices, the lowest political and administrative levels within municipal government.
Poverty—Diversity in Deprivations?
The second issue pertains to the question to what extent each type of capital deprivation contributes to the overall level of poverty for households, and whether this differs by ‘hotspot of poverty’ or not. This is important for the activities intervention programs need to take in order to support households in their efforts to reduce poverty. If, for instance, the highest levels of deprivation are found to be in education (i.e., high levels of illiteracy), intervention programs could focus on improving access/provision of schooling. If poverty is based on lack of access to clean drinking water, sanitation or housing, interventions in those areas would be needed. This question was addressed by ‘looking up’ the table of capital deprivations, which contributed to the outcome in the concerned wards.
Table 8.1 shows that in each ward the loading of the various capitals on the final index is different. For example, in Mangolpuri South, the lack of physical capital is less important than in the other wards; the score on financial capital deprivation is one of the highest. Deprivation in social capital is lowest in Gokul Puri, which has distinct deprivations in the area of physical capital compared to the other wards. The average loading of deprivations in physical capital in these wards is much lower than that of deprivations in the area of financial and human capital. The lack of social capital lies between the two extremes (see next section for details). The results indicate that even when the overall outcomes of the IMD seem very similar across wards, they hide a diversity in combinations of deprivations. This is an important result both for the analysis of livelihood strategies by households themselves, which will therefore differ according to type of deprivation they have to deal with, and for policy-makers/NGOs developing intervention programs, as they also need to choose the most strategic deprivation to tackle.
Table 8.2 shows the ranges for each capital and the index of multiple deprivations for all wards in Delhi. Financial capital shows a larger range and more variation than the other capitals, followed by social capital. Social capital and physical capital are also pretty much skewed because just few wards experience a distinct lack of those capitals. The table shows clearly the strong skewedness of the various deprivations, indicating that an analysis based on city averages is inadequate for understanding, and inefficient in targeting intervention programs.
Table 8.3 Summary of Deprivations and Percent Slum Inhabitants in Quintile of Delhi Wards with Highest Levels of IMD
Detailed Hotspot Analysis
Mangolpuri North (ward 41) and Mangolpuri South (ward 42) have an index of multiple deprivations of 0.55 and 0.53, respectively. Despite the fact that the percentage of inhabitants living in slums is very small in these areas (Table 8.3), households living in these wards face deprivations across the board. For example, the percentage of households having no sanitation is very high (93 percent and 90 percent), about 45 percent of the population are from scheduled castes facing discrimination, approximately 36 percent of the people are illiterate, just a quarter of all households have access to banking services and only 10 percent of households have large domestic capital goods in the form of a scooter.25 In these two wards, population density is very high, almost 40,000 persons/km2., in contrast to the average population density in the Delhi wards of some 7,372 persons/km2..
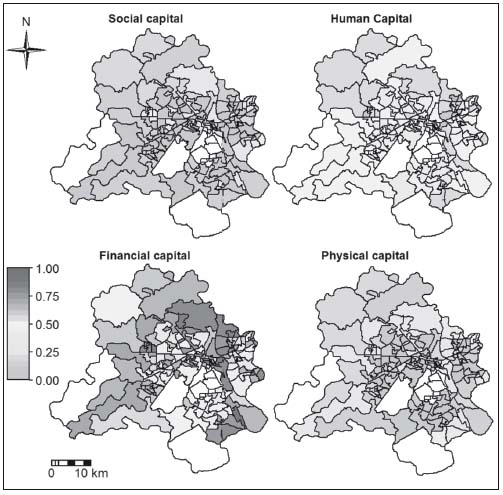
Figure 8.6 Capital deprivations of households contributing to poverty
Note: A higher index indicates higher levels of deprivation; Areas for which no data were processed are kept white.
Source: Calculated from ‘Consumer Market Demographics in Urban India’, by NCAER, New Delhi (2002).
Kondli, a ward at the edge of the city, has a high percentage of people living in slums (25 percent), with a population density of 13,571 persons/km2.. Despite the slums, this is significantly less densely populated than the
Mongolpuri wards. This ward has a large percentage of the households without latrines (80 percent), limited access to water services, and almost half the households experience overcrowding in their home. In terms of social capital, it is comparable with Mangolpuri. It has a slightly higher score in human capital than the Mangolpuri area because the percentage of illiterate people is lower (60 percent). Kondli has slightly less deprivation in the access to financial services.
Gokulpuri is also located at the edge of the city with a population density of 9,946 persons/km2.. This ward has no slums according to the census. However, its index of multiple deprivations is fairly high, mainly caused by the deprivations in physical capital; i.e., the high percentage of households using hand pumps (65 percent), having no electricity and undergoing overcrowding. In this ward, having no latrine is a minor problem. In addition, about 40 percent of the inhabitants are illiterate and the number of main workers is low. Regarding financial capital, only 29 percent access banking services and only 10 percent of the households have large domestic capital goods.
A final question concerning diversity was whether there were significant differences between these four wards with the highest levels of deprivations and the other wards in the quintile with the highest IMD. Table 8.3 shows that the other wards in this quintile have similar levels of deprivation in physical, financial and human capital, but that they show a clear difference in the level of deprivation in social capital (i.e., in the other wards the percent of SC people is much lower). This suggests that higher levels of deprivation are still closely linked to discrimination on the basis of caste. The extent of slum population in these wards does not correlate with the level of other deprivations, suggesting that poverty is not concentrated in slums.26
Table 8.4 Correlations of Capitals, IMD, Percent Inhabitants in Slums, Percent Voters in 1997 and 2002, and Households below the Poverty Line (BPL) in Delhi
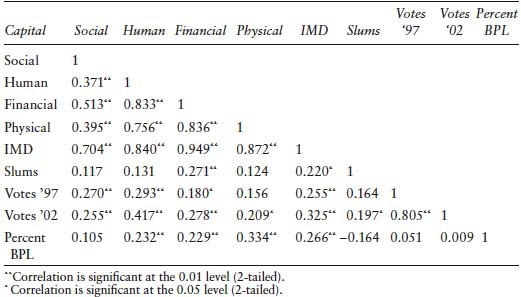
Figure 8.6 disaggregates the poverty index into its component capitals. This spatial perspective shows the areas where policy initiatives are required at ward level to deal with existing high levels of deprivations. It indicates graphically that different wards have different types and level of deprivations. This kind of mapping can be an important tool for local councilors and ward officers to set priorities in their areas of jurisdiction, as the type of deprivation can be clearly demarcated, and its ranking indicated. It does assume that financing for such policy is set at the same spatial level, so that there is a match between decision-making power, financing and information concerning deprivations.27

Figure 8.7 Wards with highest percent of inhabitants living in slums compared with wards with highest poverty levels according to index of multiple deprivations (IMD).
Note: The right picture shows for each ward the percentage of inhabitants living in slums (0–100 percent), while the left image illustrates the index of multiple deprivation (0–1). The white areas in the center are New Delhi and Delhi Cantonment, while for the white areas in the west of Delhi no data were available.
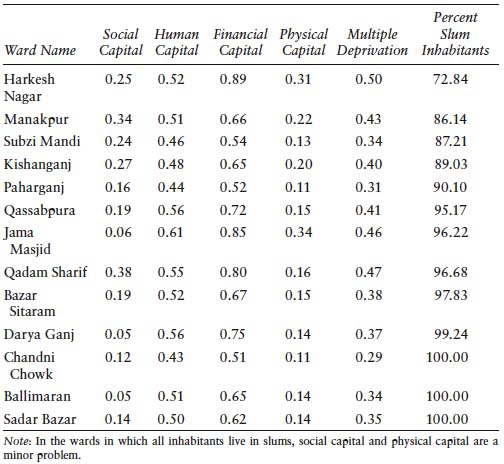
Table 8.5 Summary for Wards in Which More Than 60 Percent of the Inhabitants
Poverty in Slums?
The third question raised was whether the electoral wards with the highest levels of poverty correspond with the other indicators of poverty, often used as a proxy for determining areas where research is to be done (methodological aspects) as well as proxies for prioritizing interventions and to target ‘poor households’ (policy orientation). Important factors used in India for both research methodology and policymaking include the presence of slums and other measures for poverty, such as the number of households below the poverty line (BPL).28
The results from our analysis (Table 8.4) indicate that all the capitals are significantly correlated with the overall IMD.29 This in itself is an indication that the different capitals are factors independent of each other, and significant in their own right in contributing to the level of deprivations. The strongest correlation of the index is found in deprivations in financial access, followed in order of strength by physical deprivations, deprivations in human capital and finally social capital. This suggests that priority areas for households and their representatives include better access to financial services and better housing and basic facilities, followed by education and counteracting discrimination patterns.
The presence of slums had a much weaker correlation with the poverty index; the correlation was significant only at the 0.05 level (2-tailed).30 This result was confirmed by the comparison of the map of Delhi poverty hotspots (based on the IMD) and the map of Delhi wards with the highest percentage of inhabitants in slums (Figure 8.7). It is clear from the two maps that the highest levels of poverty are not concentrated in wards with the highest levels of slum areas in Delhi.31 In order to cross-check these results in a third way, the electoral wards in which more than 60 percent of the inhabitants live in slums were examined for their levels of poverty (Table 8.5). In these wards the index of multiple deprivation is in the range of 0.29–0.5 (highest IMD level is 0.55). These results suggest that slums incorporate a mix of households with different levels of deprivations, rather than being an area of concentration of deprivations. This is interesting, because it implies that focusing on upgrading of slums is realistic as a means of supporting households in climbing out of poverty, rather than demolishing existing assets of households there.
A strong correlation was found between index of deprivation and the number of BPL households in the electoral ward. This shows a significant correlation at 0.266, on which physical and human deprivations form the most important components. There is no significant correlation between the number of households below the poverty line and the number of households living in slums. This tends to confirm our results, based on an income measure of poverty.
We have shown that we tested the correlation between slums and the index of multiple deprivations in three different ways to ensure its robustness. Having found it confirmed, it has a number of implications for poverty studies and policymaking. For policymakers, it means that targeting slum areas is not a sufficient measure to address deprivations within the Delhi Corporation area. It is rather the different deprivations and their multiple effects that needs to be recognized and addressed at the electoral ward level. This means that different interventions can be matched to the type and level of deprivation found in each ward. It also means that the data needed for addressing deprivations need to come from databases, such as the census (in the first five years after it has been carried out), and that other smaller datasets may need to be collected to do effective targeting (see Figure 8.2). For studies on urban poverty, it implies that research methodologies will have to be adjusted. The practice of targeting slum areas for such studies will have to be reconsidered, as it clearly misses a number of strategic areas where poverty is higher than in slums (in Delhi particularly rehabilitation areas).
Can the Poor Make Their Voices Heard?
The final question raised was whether there are clear differences between the extent to which households experience deprivations and the extent to which they are able to organize themselves collectively and make their voices known through electoral representation. This has been put forward as an important channel for improving accountability in local governance by many authors (e.g., Goetz and Gaventa 2001; Harriss 2005). Since 1992, when the Nagarpalika Act was introduced, citizens have the possibility of electing councilors at their electoral ward level. Therefore the voting patterns for the local councilors in 1997 and 2002 were analyzed. The results given in Table 8.4 show that voting for local councilors was strongly correlated with wards with high levels of deprivations in 1997 (0.255, significant at the 0.01 level 2-tailed).32 In 2002, the correlation became even stronger (0.325, significant at the same level as before). The correlation with deprivations in human (lack of education and employment) (0.417) and financial capital (0.278) were much stronger in 2002, whereas the correlation with social capital became somewhat weaker.
The wards with high levels of voting in 1997 continued this pattern in 2002, as indicated by the high correlation between the voting levels in 1997 and 2002. These results suggest that voting for councilors is taken seriously by the inhabitants of wards experiencing multiple deprivations, and is increasingly seen as a channel for making their voices heard among the politicians. This does not imply that this channel is successful, as the mandate for local councilors is very limited.
8.7 CONCLUSION
In this final section, we would like to link the process of poverty mapping to that of decision making (Figure 8.2). Such decision making includes primarily citizens, their representatives (councilors) and local government. However, professional planners and academic researchers have an essential role to play in providing the insight and databases which can be utilized for more informed and transparent decision making. To begin with, the index of multiple deprivations developed here makes it possible to indicate the level of deprivation concentration at the electoral ward level, the lowest level of public administration (to which funding is allocated).33
The patterns of poverty found in Delhi show that hotspots of poverty are found at the electoral ward level, but do not cluster together in larger areas of deprivation. There is also diversity in the deprivations experienced, with deprivations in human, financial and physical capital existing in several wards at different levels, but high deprivation in social capital being generally spatially concentrated in a few areas (Figure 8.3).
This diversity makes it important for the corporation to have information which identifies precisely the nature and concentration of deprivations at electoral ward level before deciding on intervention programs and implementing them.
It is also clear that an assumption generally made about the nature of urban poverty in Indian cities does not hold true for Delhi; namely, that poverty is concentrated in slums.34 The results show that multiple deprivations are found in outlying areas of the corporation. There seems to be a connection between rehabilitation areas and high levels of poverty, which needs to be tested further. This means that neither researchers nor policymakers and staff implementing urban programmes can suffice by targeting slum areas. Researchers need to rework their methodologies for doing poverty studies based on this result, expanding their focus to include other areas (rehabilitation areas). Policymakers can fruitfully apply GIS mapping methods, using existing databases such as the census to target wards which need priority, because they experience the highest cumulative levels of poverty. For each ward, the criteria maps indicate which specific area of deprivation occurs in that ward, allowing the ward officer and councilors to identify specific areas of activities which could reduce existing deprivations. It also allows the corporation to identify the wards which should have priority in finance allocation to address specific deprivations. The instrument we have developed can be used as a planning and management instrument for this purpose, including prioritization of resource allocation.
Finally, voting patterns for local elections of councilors indicate that residents see this as an important channel for making their voices heard, as the level of voting correlates strongly with the level of deprivations experienced. Making the results of GIS mapping of poverty available to citizens would make it possible for residents to see whether the officers and political representatives are setting targets which match the situation in their areas. They can monitor the activities and priorities set by the corporation and the city council, and have information which can help minimize political redirection of priorities in financing to ward level activities. An essential ingredient in this process is that information is available to all stakeholders, and that professional planners and researchers support all groups in utilizing the information according to the right methodological standards, guaranteeing transparency in the process.
ACKNOWLEDGMENTS
We thank the IDPAD-5th phase programme for the funding received which underpins the analysis for this chapter. An earlier version of this research was published in a special issue of Urban Studies, 2008. We also thank the publisher of Urban Studies for allowing the reprint of the article in this volume.
ANNEX 8.1
The census data which comprises the basic dataset used in this study covers all income categories, and is therefore uniquely suited to compare differences across income categories. As such, it is not limited by the sole focus on low-income or slum areas. However, it was not designed with the qualitative approach to poverty which we have used in mind. In order to design the poverty index for this study, the census was scanned for indicators which would contribute to an understanding of each of the capitals forming part of livelihood strategies. In order to validate the indicators used, fieldwork-based household surveys that we carried out in each of the cities concerned (Delhi, Mumbai and Chennai) were analyzed to select those indicators from the census which distinguish best between the income groups. This follows the pattern of poverty mapping which is followed by the international agencies, such as World Bank and UNDP (Henninger and Snel 2002). It follows the qualitative UNDP approach, based on an index composed of different types of capitals/deprivations, which are aggregated into a multiple deprivation index (DETR 2004). This approach was preferred to the WB approach, which is based on ‘expenditures and small area estimation’ (Henninger and Snel 2002:10). In Britain, a similar approach has been used for identifying small areas of poverty within Britain (DETR 2004; Noble et al. 2006).
The following section describes the way the household surveys were carried out and the selection process of indicators from the results of the surveys.
The household surveys were carried out in electoral wards selected through a stratified sampling system, in which the aim was to select wards with a mixed-income population. A basic differentiation was made between areas with high-income groups (HIG), middle-income groups (MIG), and low-income groups (LIG) from authorized and unauthorized slums. Unauthorized slums were specifically selected for the survey in order to incorporate households which access services, infrastructure and employment through nonformal means.
In each city, two major areas were selected, from within which electoral wards were further selected. In Chennai, the survey was conducted in zones 1 and 9 (in four wards: 3, 13, 133 and 141). Of the total ten zones, these two zones were selected on the basis of their characteristics—zone 1 in the north of Chennai is characterized by industrial activities and lower-income areas and zone 9 in the south of Chennai is characterized by increasing middle-class development. The criteria for selecting the wards were their mixed character, with wards being included with more or less equal distribution of all income categories. Basic information about the wards was gathered through discussions with the zonal officers about ward characteristics; the areas for survey were selected on the advice of ward officers and councilors and knowledgeable experts. A total of 640 households were interviewed, equally distributed across categories in each city.
In Delhi, two zones were selected—one more in the central zone of Delhi and the other in the east part of Delhi. In each of the four wards, 160 households (7, 8, 28 and 33 or Okhla and Srinivaspuri, Keshavpuram, Rohini) were selected, with equal numbers across income categories, based on a random selection of households through the electoral list. A total of 640 households were interviewed.
In Mumbai, two administrative zones were chosen with a diversified population: M-east and F-south. Within those two zones, specific electoral wards were chosen for the household survey, with a total of 600 households. The selection of the electoral wards was based on prior knowledge and studies by TISS and IDPAD project staff, in conjunction with knowledgeable local administrative officials.
The second step was to select criteria for our index from each of the capitals or areas of deprivations, which discriminated across all household groups found in the city surveys, and on which information could be found in the 2001 census.
In terms of human capital, the census provided information on education and employment, but not on health issues. In order to indicate health indirectly, we calculated the dependency ratio—i.e., between the number of working members and those who do not work (too young, too old, too ill, unable to find work). For education, we used the indicator of illiteracy. For employment, the indicator could be directly derived from the census data. The criteria of dependency and education were measured by use of a constructed scale, in line with the results of the household surveys across the three cities.
In terms of physical capital, ownership of the house was not used, because ownership was found both among slum households and in high-income areas. The type of house owned, of course, was very different, but the categories of housing found were rather varied across cities, which made it difficult to derive a clear indicator from this factor. In Chennai, the use of apartments was much higher among middle-and high-income groups (MIGs, HIGs), whereas in Delhi, apartments were much less commonly found. Therefore, an indicator indicating the extent of overcrowding was chosen as alternative. For the precise construction of this indicator, see the footnote with the criteria model (Figure 8.1). The indicators related to basic services (water, sanitation and electricity) were the next set of criteria for physical capital. The household surveys showed that the majority of households across categories have electricity, with the exception of poor households in unauthorized slums. Therefore, this indicator was included in our index. The criteria of no indoor sanitation and households using community hand pumps were the items which discriminated best between slum household groups and other neighborhood groups.
Finally, financial capital contains two types of items. The census provides only access to banking services as criterion, so this was used. However, it concerns formal services, which does not reflect properly the use made by many households for obtaining credit. The extent of financial capital is also reflected by the ownership of capital goods, either through full ownership or sufficiently established credit for hire-purchase. The household surveys included five types of capital goods; the results were analyzed, and the item which discriminated most between all groups was selected. The five types included two types of telephones, cars, bicycles, and motorized scooters. The last one was selected; information on household assets was available from the census 2001 for the first time.
Several criteria from our index are not the ‘classic’ criteria of income, or consumption patterns. The difficulties of analyzing with any degree of reliability income and consumption patterns (or converting those to money-metric terms) led us to choose these criteria which are less susceptible to over-or underestimation by respondents, and discriminate across all households in different types of neighborhoods (Saith 2005).
NOTES
1. Moser coined the phrase ‘assets-vulnerability’ framework in her study on poor households in Latin America; the more commonly used terminology is the ‘livelihoods’ approach, which has generally been used to study poverty in rural areas (Ellis 1998; Carney 1998; Bebbington 1999; de Haan 2000). Exception to this rule is the work by Rakodi and Lloyd-Jones on urban livelihoods (2002).
2. See Annex 8.1 for a further discussion on the choices of indicators used in the index. Access to open spaces is ambiguous, because it would require, e.g., that households indicate their distance to the nearest ‘public space’. This type of information is not available from the 2001 Indian Census.
3. This means that cities with contrasting situations are more useful to our type of analysis than cities with high levels of poverty across the whole population. If the majority of the urban population is poor, intervention programs should be targeted at the city as a whole.
4. If poverty is widespread throughout cities, interventions also need to be implemented across the board.
5. We do not include steps 1 and 8, as this project was not set up from the beginning with local government organizations. However, the results of the mapping exercise are being discussed with local government officials in the follow-up to this study.
6. UNDP has also included a human and poverty index in the Human Devel opment Report of 2005, and has used the HDI in a new way by looking at the extent to which improvements in the various indicators of the index have improved at country level, as well as the inequalities seen in countries (UNDP 2005: Technical Notes).
7. The IMD 2004 is a weighted area level aggregation of the specific domains income deprivation, employment deprivation, health deprivation and disability, education, skills and training deprivation, barriers to housing and services, living environment deprivation and crime, which resembles the assets/vulnerability approach that forms the basis of the research presented in this paper.
8. The national sample surveys (NSS) are based on fairly ‘thin’ samples, so that disaggregation to within city levels is not feasible (Thamarajakshi 2003).
9. The Census instructions indicate to enumerators that they should include slum areas; they do so, including slum areas which are not recognized. They also include people living on the street, as indicated by the instructions to the enumerators.
10. The caloric norms are 2,400 calories and 2,100 calories per capita per day resp. for rural and urban areas. Distinctions are also made between prices at the state level (Thamarajakshi 2003).
11. This type of approach has been discussed extensively in terms of its methodological difficulties. We will refer here only to the recent discussion in the EPW (Kulshrestra and Kar 2002; Sundaram and Tendulkar 2003).
12. See also recent discussions on poverty monitoring (de Haan and Padhi 2003).
13. It has also the unique distinction of providing civic services to rural and urban villages, resettlement colonies, regularized unauthorized colonies, JJ squatter settlements, slum ‘basties’, and private ‘katras’.
14. Few people live in these areas, so that they do not make a difference to totals. Each of the two areas excluded covers only 3 percent of the total physical area of the National Capital District.
15. If the wider agglomeration was to be taken into account, it would require collecting data from each municipality separately, disaggregated to the electoral ward level.
16. In 1995, an act for Delhi prohibited setting up a Metropolitan Planning Committee for Delhi, mandated for all cities.
17. The indicators selected were matched to the results of our household surveys in three metropolitan cities: Delhi, Mumbai and Chennai.
18. Natural capital as a separate capital was not included, because it concerns either access to basic natural resources such as water (included in basic services), land (included in housing), and clean air (not included in the Census, as well as needing measurement at neighborhood level), or access to collective natural capital in the form of green spaces like parks etc. Again these indicators would need to be measured either at neighborhood level (to establish provision) or the individual household's access to them, which is not available from the Census. In future studies, this should be an area which is included.
19. The registrar general (and the local government departments providing disaggregated tables) refuse this information, because they are afraid that it will be misused to target areas with high concentrations of such populations, by groups intent on increasing religious conflicts.
20. This is not to suggest that SC households do not have social capital—obviously, they have social networks within their own caste (jati) groups (bonding capital). It is to suggest that they find it hard to access linking social capital, which would provide them with access to networks of people with higher levels of entitlement. The category of scheduled castes is the largest group discriminated against—about 30 to 40 percent of the population in many localities. Therefore, we have captured the largest group in our analysis.
21. We have not combined it with the number of marginal workers, as together they would add up to 100 percent of the workforce for each household. Using only the main worker together with the number of dependents indicates how far the income of the earners has to stretch within the household.
22. The census counts workers not at the ‘firm level’ but at the household level. So respondents working in informal economic activities are counted when they indicate which job they carry out (including illegal work, street-based work, and domestically subcontracted work).
23. Earlier work in gender studies has made clear the importance of each person's contributions to household income, the pooling systems and expenditure systems (Baud 1992; Epstein et al. 1998).
24. The legend shows the level of deprivations represented by each color.
25. The Delhi Development Authority constructs resettlement colonies with no internal toilets, because the total built-up space per household is limited to 18 square meters per household (pers. com).
26. This correlation was also found in Chennai and Mumbai in our comparative poverty mapping in those cities (Baud et al. 2009).
27. Earlier research in Mumbai shows that this is only very partially the case, with only 6 percent of the municipal budget going to the ward level.
28. Slums are defined in the census as ‘all specified areas notified as slums by State or local government under ‘Slum Acts’, all areas recognized by state and local government but not designated as such, and a compact area of at least 300 population or about 60–70 households of poorly built congested tenements, in unhygienic environment, usually with inadequate infrastructure and lacking in proper sanitary and drinking-water facilities (Census of India 2001).
29. Pearson rho correlations ranged from 0.704–0.949, significant at the .001 level two-tailed.
30. This correlation is for all wards in Delhi.
31. In only one electoral ward is there a correlation between high poverty levels and slums, Harkeshnagar, which is electoral ward 66.
32. It was correlated more specifically with deprivations in human and social capital.
33. The financial support of the Indo-Dutch Programme on Social Sciences is gratefully acknowledged. Such long-term financing of collaborative programs is an essential ingredient of building up international research networks between North and South (Baud 2002).
34. Our paper comparing Delhi with two other metropolitan cities finds that it holds true for them as well.
REFERENCES
Baud, Isa. 1992. Forms of Production and Women's Labour: Gender Aspects of Industrialisation in India and Mexico. New Delhi: Sage Publications.
Baud, Isa. 2002 “North-South Research Partnerships: An Institutions Approach.” In North-South Research Co-operation: Comprehensives Approaches to Development and Innovation, edited by Johan Bouma and Hans Opschoor. Amsterdam: KNAW.
Baud, Isa, Karin Pfiffer, N. Sriciharan and N. Nainan. 2009. “Matching Deprivation Mapping to Urban Governance in three Indian mega-cities.” Habitat International 33(4): 365–377.
Baulch, Bob. 1996 “Neglected Trade-Offs in Poverty Measurement.” IDS Bulletin 27: 36–43.
Beall, Jo. 2002. “Living in the Present, Investing in the Future—Household Security among the Poor.” In Urban Livelihoods: A People-Centred Approach to Reducing Poverty, edited by Carole Rakodi and Tony Lloyd-Jones. London: Earthscan Publications.
Bebbington, Anthony. 1999. “Capitals and Capabilities: A Framework for Analyzing Peasant Viability, Rural Livelihoods and Poverty.” World Development 27(12): 2021–2044.
Beteille, Andre. 1983. Equality and Inequality. New Delhi: Oxford University Press.
Beteille, Andre. 2003. “Poverty and Inequality.” Economic and Political Weekly 38 (42): 4455–4464.
Bigman, David, and Hyppolyte Fofack. 2000. “Geographical Targeting for Poverty Alleviation: An Introduction to the Special Issue.” The World Bank Economic Review 14 (1): 129–145.
Boyle, Paul, and Seraphim Alvanides. 2004. “Assessing Deprivation in English Inner City Areas: Making the Case for EC Funding for Leeds City.” InApplied GIS and Spatial Analysis, edited by John Stillwell and Graham Clarke, 111–136. London: Wiley.
Breman, Jan. 1986. Of Peasants, Migrants and Paupers: Rural Labour Circulation and Capitalist Production in West India. New Delhi: Oxford University Press.
Breman, Jan. 2004. The Making and Unmaking of an Industrial Working Class: Sliding Down to the Bottom of the Labour Hierarchy in Ahmedabad, India. Amsterdam: Amsterdam University Press.
Carney, Diana. 1998. “Implementing the Sustainable Rural Livelihoods Approach.” In Sustainable Rural Livelihoods: What Contributions Can We Make?, edited by Diana Carney, 3–23. London: Department for International Development.
Cavill, Sue, and M. Sohail. 2004. “Strengthening Accountability for Urban Services.” Environment and Urbanization 16 (1): 155–170.
Census of India. 2001. Metadata and Brief Highlights on Slum Population, www.censusindia.net/census2001/history/censusoperation.html.
Chen, Martha Alter, Joann Vanek and Marilyn Carr. 2005. Mainstreaming Informal Employment and Gender in Poverty Reduction: A Handbook for Policymakers and Other Stakeholders. Commonwealth Secretariat, IDRC, WIEGO.
Climaco, Jojo. 1997. Multicriteria Analysis. Berlin: Springer Verlag.
Davis, Benjamin. 2000. Choosing a Method for Poverty Mapping. Rome: Food and Agriculture Organization.
Deichmann, Uwe. 1999. “Geographic Aspects of Inequality and Poverty.” Text prepared for the World Bank Web site on Inequality, Poverty and Social Socio-Economic Performance: www.worldbank.org/poverty/inequal/index.htm.
DETR. 1998. “Index of Local Deprivation: A Summary of Results.” London: Department of Environment, Transport and Regions.
DETR. 2000. “Measuring Multiple Deprivation at the Small Area Level: The Indices of Deprivation 2000.” Regeneration Research Summary 37. London: Department of Environment, Transport and the Regions.
DETR. 2004. “Index of Multiple Deprivation 2004.” London: Department of Environment, Transport and the Regions.
Drèze, Jean, and Amartya Sen. 2002. India: Development and Participation. Oxford: Oxford University Press.
Dupont, Véronique, Emma Tarlo and Dennis Vital, eds. 2000. Delhi, Urban Space and Human Destinies. New Delhi: Manohar.
Ellis, Frank. 1998. “Household Strategies and Rural Livelihood Diversification.” Journal of Development Studies 35 (1): 1–38.
Ellis, Frank. 2000. Rural Livelihoods and Diversity in Developing Countries. Oxford: Oxford University Press.
Epstein, T. Scarlett, A. P. Suryanarayana and T. Thimmegowda. 1998. Village Voices: Forty Years of Rural Transformation in South India?: Sage Publications.
Goetz, Marie, and John Gaventa. 2001. “Bringing Citizen Voice and Client Focus into Service Delivery.” IDS Working Paper 138. Brighton, Sussex: Institute of Development Studies.
Haan, Leo de. 2000. “Globalization, Localization and Sustainable Livelihood.” Sociologia Ruralis 40 (3): 339–365.
Haan, Arjan de, and Sakthi Padhi. 2003. “Monitoring Poverty in Orissa.” Economic and Political Weekly December 13: 5243–5246.
Harriss, Richard, and Paul Longley. 2004. “Targeting Clusters of Deprivation within Cities.” In Applied GIS and Spatial Analysis, edited by John Stillwell and Graham Clarke, 89–110. London: Wiley.
Harriss, John. 1982. “Character of an Urban Economy, ‘Small-Scale’ Production and Labour Markets in Coimbatore.” Economic and Political Weekly June 5 and 12: 945–954 and 993–1002.
Harriss, John. 2001 Depoliticizing Development, the World Bank and Social Capital. New Delhi: Left Word.
Harriss, John. 2005. “Political Participation, Representation and the Urban Poor: Findings from Research in Delhi.” Economic and Political Weekly March 12: 1041–1054.
Henninger, Norbert, and Mathilde Snel. 2002. Where Are the Poor? Experiences with the Development and Use of Poverty Maps. Washington, DC: World Resources Institute; Norway: UNEP and GRID ARENDAL.
Holstrom, Mark. 1984. Industry and Inequality: The Social Anthropology of Indian Labour. Cambridge: Cambridge University Press.
Janssen, Ron. 1992. Multi-Objective Decision Support for Environmental Management. Dordrecht, Netherlands: Kluwer Academic Publishers.
Krishna, Anirudh. 2003. “Falling into Poverty: The Other Side of Poverty Reduction.” Economic and Political Weekly 38 (6): 533–542.
Kuffer, Monika, Richard Sliuzas and Tsion Lemma. 2006. “A Participatory Approach to Monitoring Slum Conditions.” PLA 18 (54): 58–66.
Kulshrestra, Kar. 2002. “Recent Debates on Data Base for Poverty Measurement in India.” Paper for Planning Commission—World Bank Workshop, January 11–12, 2002.
Kundu, Amitabh. 1993. In the Name of the Urban Poor: Access to Basic Amenities. New Delhi: Sage.
Kundu, Amitabh, and Darshini Mahadevia. 2002. Poverty and Vulnerability in a Globalising Metropolois Ahmedabad. New Delhi: Manak Publishers.
Labbate, Gabriel, Levan Jamburia and Guram Mirzashvili. 2004. “Improving Targeting of Poor and Extremely Poor Families in Georgia: The Construction of Poverty Maps at the District Level.” Georgia: UNDP.
Malczewski, Jacek. 1999. GIS and Multi-Criteria Decision Analysis. New York: John Wiley and Sons Inc.
Masser, Ian. 2001. “Managing Our Urban Future: The Role of Remote Sensing and Geographic Information Systems.” Habitat International 25 (4): 503–512.
McGee, Rosemary, and Karen Brock. 2001. “From Poverty Assessment to Policy Change: Processes, Actors and Data.” Working Paper IDS 133. Brighton, Sussex: Institute of Development Studies.
Mitlin, Diana, and David Satterthwaite. 2004. Empowering Squatter Citizen: Local Government, Civil Society and Urban Poverty Reduction. London: Earthscan Publications.
Moser, Caroline. 1998. “The Asset Vulnerability Framework: Reassessing Urban Poverty Reduction Strategies.” World Development 26 (1): 1–19.
Narayan, Deepa, Raj Patel, Kai Schafft, Anne Rademacher and Sara Koch-Schulte. 2000. Voices of the poor. Can anyone hear us? New York: Oxford University Press.
Noble, Michael, Gemma Wright, Chris Dibben, George Smith, David McLennan, Chelsie Anttila, et al. 2004. “The English Indices of Deprivation 2004” (rev. ed.). Report to the Office of the Deputy Prime Minister, London: Neighbourhood Renewal Unit.
Noble, Michael, Gemma Wright, George Smith and Chris Dibben. 2006. “Measuring Multiple Deprivation at the Small-Area Level.” Environment and Planning A 38 (1): 169–185.
Orford, Scott. 2004. “Identifying and Comparing Changes in the Spatial Concentrations of Urban Poverty and Affluence: A Case Study of Inner London.” Computers, Environment and Urban Systems 28 (6): 701–717.
Petrucci, Alessandra, Nicola Salvati and Chiara Seghieri. 2003. “The Application of a Spatial Regression Model to the Analysis and Mapping of Poverty.” Environmental and Natural Resources Series 7. Rome: Food and Agriculture Organization.
Planning Commission of India. 2001. India Human Development Report 2001. New Delhi: Planning Commission.
Rakodi, Carole, and Tony Lloyd-Jones, eds. 2002. Urban Livelihoods: A People Centred Approach to Reducing Poverty. London: Earthscan Publications.
Saith, Ashwani. 2005. “Poverty Lines Versus the Poor; Method Versus Meaning.” Economic and Political Weekly 55 (43): 4601–4610.
Satterthwaite, David. 1997. “Urban Poverty: Reconsidering Its Scale and Nature.” IDS Bulletin 28 (2): 9–23. Brighton, Sussex: Institute of Development Studies.
Satterthwaite, David. 2004. “The Under-Estimation of Urban Poverty in Low and Middle-Income Nations.” IIED Working Paper 14 Poverty Reduction in Urban Areas. London: International Institute for Environment and Development.
Sen, Amartya. 1999. Development as Freedom. New York: Anchor Books.
Schenk, Hans, ed. 2001. Living in India's Slums: A Case Study of Bangalore. New Delhi: Manohar.
Sharifi, Mozafar, Marjan van Herwijnen and Willem van den Toorn. 2004. ”Introduction to Multiple Criteria Decision Analysis.” Reader. Enschede, Nether-lands: ITC.
Sharma, Kalpana. 2000. Rediscovering Dharavi, Stories from Asia's Largest Slum. Australia: Penguin Books.
Sivaramakrishnan, K. C., Amitabk Kundu and B. N. Singh. 2005. A Handbook of Urbanization in India. New Delhi: Oxford University Press.
Streefkerk, Hein. 1981. “Too Little to Live On, Too Much to Die On: Employment in Small-Scale Industries in Rural South Gujarat.” Economic and Political Weekly 16 (15): 659–668.
Sundaram, K., and Suresh D. Tendulkar. 2003. “Poverty in India in the 1990s: An Analysis of Change in 15 Major States.” Economic and Political Weekly 38 (14): 1385–1393.
Thamarajakshi, R. 2003. “Growth and Poverty in India in the 1990s.” Economic and Political Weekly 38 (17): 1721–1725. UNDP. 2005. Human Development Report 2005. New York: Oxford University Press.
Wit, Joop de. 1996. Poverty, Policy and Politics in Madras Slums: Dynamics of Survival, Gender and Leadership. New Delhi: Sage Publications.