Introduction
Abstract
More than one billion people do not have access to safe drinking water sources (Lantagne et al., 2010). Many of these people reside in developing countries with very few resources available to them. Simple and low-cost technologies have been developed to provide ways to treat water, ranging from point-of-use (POU) treatment to small-scale (SS) community treatment. During natural disasters, POU and SS technologies offer ways to provide clean and safe drinking water. This guide to emergency water treatment has been developed based on current research, products, and field studies to create an expeditious and easy process for choosing which technology is most appropriate in each emergency situation.
More than one billion people do not have access to safe drinking water sources (Lantagne et al., 2010). Many of them reside in developing countries with very few resources available to them. Simple and low-cost technologies have been developed to provide ways to treat water, ranging from point-of-use (POU) treatment to small-scale (SS) community treatment. During natural disasters, POU and SS technologies offer ways to provide clean and safe drinking water. This guide to emergency water treatment has been developed based on current research, products, and field studies to create an expeditious and easy process for choosing which technology is most appropriate in each emergency situation.
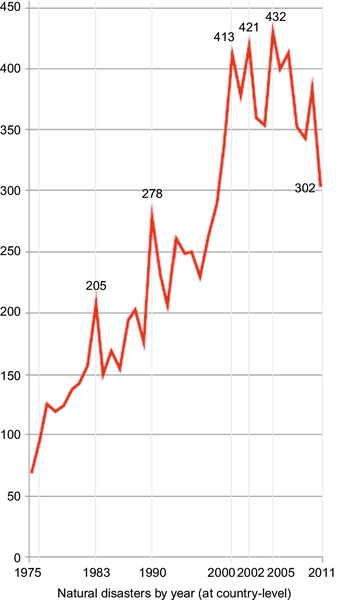
Natural disasters, such as floods, tsunamis, hurricanes, and earthquakes, affect more than 226 million people every year (UNISDR, 2011). The occurrence of these natural disasters has been increasing each year (see Figure 1.1) due to the synergistic effect of climate change is causing more extremes in weather and growing populations are living in areas vulnerable to natural hazards (Lantagne and Clasen, 2009). Developing a guideline for emergency water treatment will become even more important as the number of natural disasters continues to increase.
During disasters, water sources become contaminated with industrial, human, and animal waste from overwhelmed sewage infrastructures or because of poor hygiene practices. Diseases caused by waterborne pathogens can easily be spread by this contamination (Colindres et al., 2007; McLennan et al., 2009), affecting a large number of people, primarily in the developing world. Several billion people use water that is likely contaminated, resulting in approximately 2.5 billion cases of illness per year and about 5 million deaths per year (Burch and Thomas, 1998; Pejack et al., 1996). In the developing world, high rates of morbidity and mortality are caused by common illnesses spread by water contamination, including cholera, typhoid fever, shigellosis, dysentery, and hepatitis A and E (Lantagne and Clasen, 2009). In fact, 40% of deaths in internally displaced person (IDP) camps were due to diarrhea caused by drinking microbiologically unsafe water (Doocy and Burnham, 2006). The communicable diseases present in IDP camps were transmitted through unsafe drinking water. Because of this contamination, water treatment approaches may be valuable in helping to stem a “second wave” of illness and death after a disaster (Colindres et al., 2007).
The poor in developing countries are the most vulnerable to disasters because they do not have the resources to rebuild and fix infrastructures (UNISDR, 2011). After natural disasters, survivors either leave their country and become refugees or stay in the country and migrate to someplace safer, becoming IDPs. Close living quarters, lack of hygiene, and insufficient clean water supplies in IDP camps can exacerbate already poor conditions (Steel et al., 2008). Even if members of an affected community remain at home rather than moving to an IDP camp, there is still a chance that their water will become contaminated.
1.1 Standards for Water Quality and Quantity
During a disaster, clean water is necessary for survival. The main health problems associated with drinking water contamination are caused by insufficient water for hygiene purposes and consumption of that contaminated water. There are two standards defined by the Sphere Project (2011) for water supply standards. The first standard involves the quantity of and access to water, while the second standard regulates water quality. The minimum amount of water for safe and healthy consumption is summarized in Table 1.1. Water for hygiene use is considered a basic water need because it is important maintaining proper hygiene during disasters to reduce the risk of disease.
Table 1.1
Basic Survival Water Needs (Sphere Project, 2011)
| Water Use | Minimum Requirement (L/day) | Notes |
| Survival needs: water intake for food and drinking | 2.5-3 | Depends on the climate and individual physiology |
| Basic hygiene practices | 2-6 | Depends on social and cultural norms |
| Basic cooking needs | 3-6 | Depends on food type and social and cultural norms |
| Total | 7.5-15 L/day |
Along with the 7.5- to 15-L of water per person per day, other water quantity indicators that can be used to measure the amount of water accessibility include:
• Distance from a household to a water point (~ 500 m);
• Waiting time at a water source (no longer than 30 min)
These standards should not be followed blindly, as they do not guarantee that water is equally available to all.
Water quality is a secondary standard, according to the Sphere Project (2011). Once water quantity has been assured, water quality should be improved to reduce the risk of dysentery and other diseases. The quality parameters identified in Table 1.2 are specified by the Sphere Project (2011) as the minimum standards that must be met by water treatment technologies.
Table 1.2
Water Quality Parameters for Disaster Relief (Sphere Project, 2011)
| Water Quality Parameter | Minimum Requirement | Notes |
| Coliforms | 0/100 mL of water | Measured at the point of delivery |
| Turbidity | < 5 NTU | For proper disinfection |
| Chlorine Residual | 0.5 mg/L | To reduce risk of posttreatment contamination |
1.2 Technology Requirements
Because the majority of people affected by natural disasters are not knowledgeable about the technologies available for emergency water purification, criteria for technology use should reflect this. There are two types of responses in natural disasters. The first response is a rapid (and potentially short) response to a disaster, designed to keep people alive. During disasters, this response tends to include the transportation of bottled water to the affected population. However, the weight and expense of transporting bottled water has resulted in a lack of sustainability, so alternatives are continually being explored. The second response is a more sustainable and long-term response. This second response needs to last until the IDP camps or community living conditions return to normal. These technologies can even be appropriate for future water treatment during stable times if water treatment was unavailable before the emergency.
Initial, rapid response for water treatment should have the following characteristics (Ray et al., 2012):
• Provides needed quantity of water, and the water is of drinkable quality
• Portable
• Low cost
• Light weight
• Ease of use or requires minimal training
• Requires minimal or no external power
A solution for a long-term response should have the following characteristics (Ray et al., 2012):
• Ability to support a community or large population by purifying a large volume of water
• Parts require infrequent replacements and minimal supply chains
• Does not require complex training to operate
• Uses easily available power sources
Water treatment technologies available in an emergency must provide the minimum amount of water needed for basic survival; thus, the required capacity of these technologies depends on the amount of people the device serves. Using the minimum amount of water needed for survival from Table 1.1 (7.5 L/day) and assuming that water can be collected for 8 h a day (Sphere Project, 2011), the required capacity of water treatment technologies can be estimated; see Table 1.3.
1.3 Challenges in Providing Water Treatment for Disaster Relief
Water treatment technologies are typically provided to those in need through nongovernment organizations (NGOs), the government, or companies that manufacture water treatment devices. The effectiveness of these organizations in responding with water treatment technologies to these disasters has not been extensively studied in peer-reviewed journals. However, a study by Colindres et al. (2007) did find that NGOs were less efficient then they could be. When delivering water treatment products, NGO representatives were not familiar with the treatment process they were distributing, nor did they have the training or experience needed to promote the water treatment device (Colindres et al., 2007). In order to provide the most help possible, the organization that is offering relief technologies needs to be familiar with the product they are distributing and be trained in using the technology. Emergency responders should include local community leaders in the training, educational, and distribution process to gain community support for the technology. This will also help the local population to understand that licensed technologies provide a way to help them stay healthy and can offer alternatives to drinking dirty water (Colindres et al., 2007).
A difficulty in measuring the effectiveness of emergency water treatment technologies is that metrics are difficult to develop and compare in different emergency situations. For example, the majority of studies that evaluated disaster relief programs were all conducted during a stable time after the emergency, not during the initial, acute response. Thus, the technologies that were found to be effective through field tests and applications may not be as easily implemented in the more chaotic situation of an acute emergency response (Colindres et al., 2007). Another difficulty in assessing the effectiveness of water treatment technologies in an emergency situation is the difference in local conditions. One study found that using chlorinated tablets reduced dysentery in a community while another study found that the same chlorinated tablets did not reduce dysentery in a different population (Clasen et al., 2007; Jain et al., 2010). The numerous factors related to water quality, including the amount of microbiological activity in the water, water storage practices, hygiene, and water treatment technology education, decrease researchers’ ability to evaluate and compare results.
Studies that have researched emergency water treatment found that the greatest challenges during implementation were user acceptance and user training (Lantagne and Clasen, 2009). Due to the chaos of acute emergency situations, user training can be difficult to implement. Lantagne and Clasen (2009) found that initial stages of emergency situations had less than a 20% uptake of POU water treatment devices. More stable emergency situations resulted in a higher rate of POU uptake due to the implementation of training. Training is important because effective treatment of water depends on correct use of the device. If the device is not used correctly, users will continue to get sick and assume that the device does not actually work, discontinuing its use. This fosters a lack of trust in water treatment in general. User acceptability is also dependent not only on correct use of the device, but ease of use, proper maintenance, and taste of the treated water.
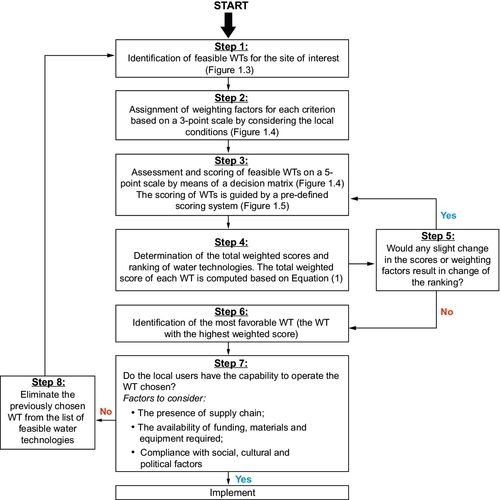
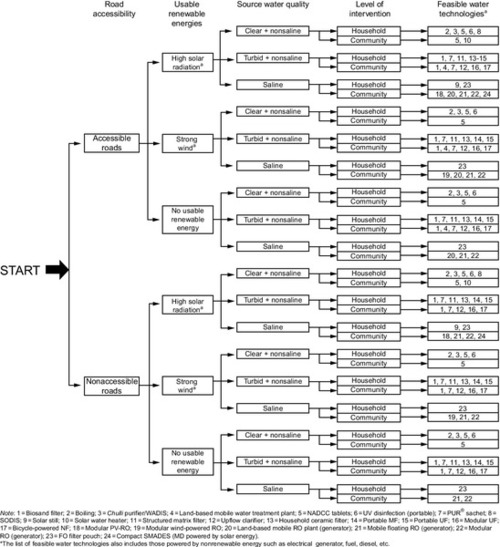
Implementing emergency devices in a manner that reduces illnesses and is sustainable is difficult because each disaster affects different communities in different ways. Some emergency devices that may work well in some areas may not be accepted in other regions. For example, some regions of developing countries already use a certain type of water treatment during stable times, so implementing the same type of treatment might be more effective than implementing a new technology. Loo et al. (2012) developed a procedure that can be followed during an emergency situation. While this procedure is new and has not yet been tested in an emergency, it provides a guideline to follow that would help implement the most effective technology depending on the scenario. The list of parameters to consider when following the procedure is provided in Figure 1.2. After determining the important parameters, the decision tree in Figure 1.3 can help determine the technologies that are the most appropriate. After selecting several possible technologies, the matrix designed by Loo et al. (2012) in Figure 1.4 can be used to compare the technologies and see which technology is the most appropriate. The matrix in Figure 1.4 can also be tailored to fit the site-specific needs. Equation 1 can be used to determine the nominal and weighted score of each potential water treatment technology listed in Figure 1.4. Than that score can be applied in Step 4 of Figure 1.2.
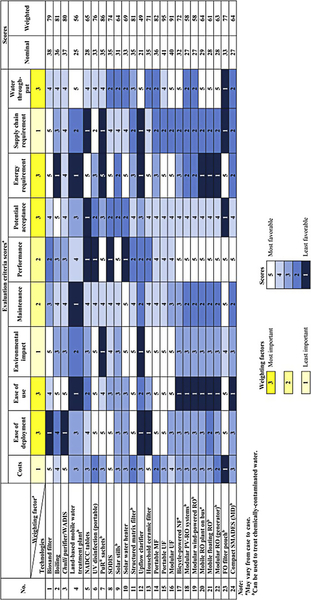
![]() (Equation 1, Loo et al., 2012)
(Equation 1, Loo et al., 2012)
Where wj = weighting factor arbitrarily applied to criteria (See top row in Figure 1.4)
Xij = score for each criterion (See columns in Figure 1.4)
When implementing a new water treatment technology, factors to consider include:
• Surface water, types of wells, spring water, pipe network
– If not piped, how water is collected
• Turbidity, microbiological activity, arsenic
• Potential contamination: proximity of nearby industry/agricultural areas and locations of community sewage to water source
• Initial, acute response or long-term application
– Recipient’s familiarity with similar technology and/or previous technology use
– Recipient’s hygiene practices
– Previous training and adaptability
– How and what water was used for and how it will be used now
– How water is stored and how recontamination of treated water can be prevented
• Cost: Initial investment and maintenance costs
– Lifecycle costs; see Section 1.4
• Operation and maintenance
– Labor required to operate and clean device on daily basis
– Availability of replacement parts
• Power sources available
• Renewable energies: solar radiation, wind energy
• Car batteries
• Electricity
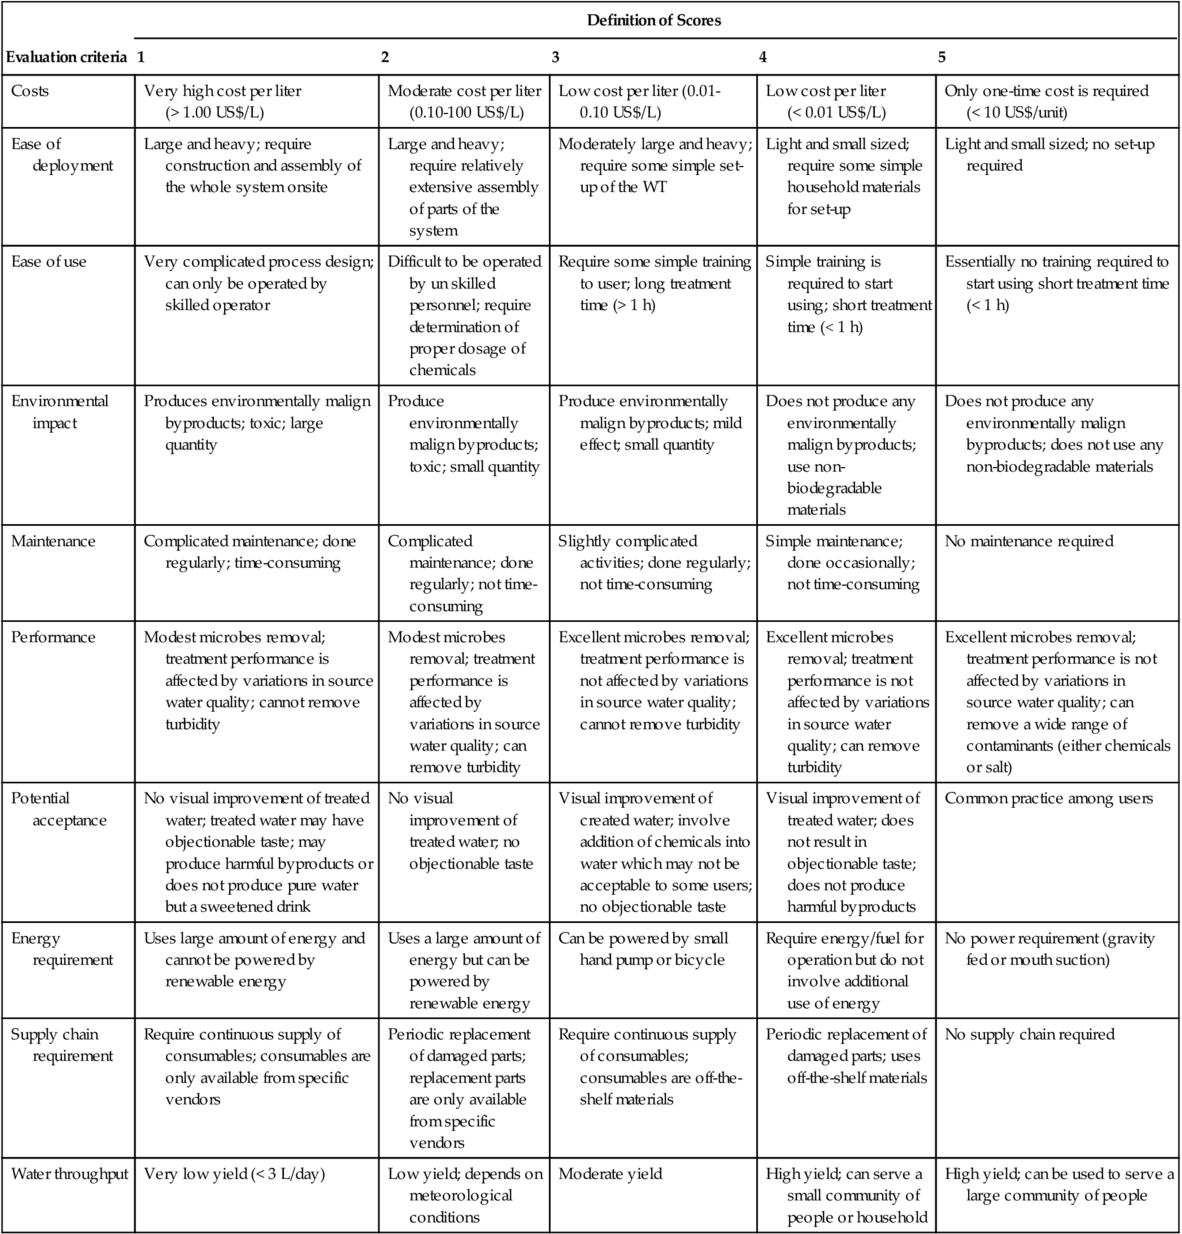
Using the above selection strategy requires detailed information about the disaster area. This information may not be known prior to selecting a treatment technology. Steele et al., (2008) recognize that there will be a lack of sufficient knowledge when it comes to the decision-making process and recommend addressing this issue by thoroughly documenting the advantages and disadvantages of each water treatment technology. When the time comes to evaluate the needs of the disaster site, the treatment technology can be chosen based on available knowledge (Table 1.4).
Table 1.4
Criteria Used to Evaluate Water Treatment Technologies and Descriptions of Scores (Loo et al., 2012)
| Evaluation criteria | Definition of Scores | ||||||
| 1 | 2 | 3 | 4 | 5 | |||
| Costs | Very high cost per liter (> 1.00 US$/L) | Moderate cost per liter (0.10-100 US$/L) | Low cost per liter (0.01-0.10 US$/L) | Low cost per liter (< 0.01 US$/L) | Only one-time cost is required (< 10 US$/unit) | ||
| Ease of deployment | Large and heavy; require construction and assembly of the whole system onsite | Large and heavy; require relatively extensive assembly of parts of the system | Moderately large and heavy; require some simple set-up of the WT | Light and small sized; require some simple household materials for set-up | Light and small sized; no set-up required | ||
| Ease of use | Very complicated process design; can only be operated by skilled operator | Difficult to be operated by un skilled personnel; require determination of proper dosage of chemicals | Require some simple training to user; long treatment time (> 1 h) | Simple training is required to start using; short treatment time (< 1 h) | Essentially no training required to start using short treatment time (< 1 h) | ||
| Environmental impact | Produces environmentally malign byproducts; toxic; large quantity | Produce environmentally malign byproducts; toxic; small quantity | Produce environmentally malign byproducts; mild effect; small quantity | Does not produce any environmentally malign byproducts; use non-biodegradable materials | Does not produce any environmentally malign byproducts; does not use any non-biodegradable materials | ||
| Maintenance | Complicated maintenance; done regularly; time-consuming | Complicated maintenance; done regularly; not time-consuming | Slightly complicated activities; done regularly; not time-consuming | Simple maintenance; done occasionally; not time-consuming | No maintenance required | ||
| Performance | Modest microbes removal; treatment performance is affected by variations in source water quality; cannot remove turbidity | Modest microbes removal; treatment performance is affected by variations in source water quality; can remove turbidity | Excellent microbes removal; treatment performance is not affected by variations in source water quality; cannot remove turbidity | Excellent microbes removal; treatment performance is not affected by variations in source water quality; can remove turbidity | Excellent microbes removal; treatment performance is not affected by variations in source water quality; can remove a wide range of contaminants (either chemicals or salt) | ||
| Potential acceptance | No visual improvement of treated water; treated water may have objectionable taste; may produce harmful byproducts or does not produce pure water but a sweetened drink | No visual improvement of treated water; no objectionable taste | Visual improvement of created water; involve addition of chemicals into water which may not be acceptable to some users; no objectionable taste | Visual improvement of treated water; does not result in objectionable taste; does not produce harmful byproducts | Common practice among users | ||
| Energy requirement | Uses large amount of energy and cannot be powered by renewable energy | Uses a large amount of energy but can be powered by renewable energy | Can be powered by small hand pump or bicycle | Require energy/fuel for operation but do not involve additional use of energy | No power requirement (gravity fed or mouth suction) | ||
| Supply chain requirement | Require continuous supply of consumables; consumables are only available from specific vendors | Periodic replacement of damaged parts; replacement parts are only available from specific vendors | Require continuous supply of consumables; consumables are off-the-shelf materials | Periodic replacement of damaged parts; uses off-the-shelf materials | No supply chain required | ||
| Water throughput | Very low yield (< 3 L/day) | Low yield; depends on meteorological conditions | Moderate yield | High yield; can serve a small community of people or household | High yield; can be used to serve a large community of people | ||
1.4 Costs
When calculating costs for emergency relief water treatment technologies, all costs that will be incurred throughout the lifetime of the device must be taken into account to assess the device’s appropriateness. Cost considerations include upfront, recurring, and program costs. Upfront costs must include the initial cost of the hardware as manufactured, transportation, and installation costs. Installation costs can depend on who is doing the installation, locals or volunteers from a humanitarian program. Some devices may not even have installation costs or may have training costs instead. Recurring costs must include the daily labor needed for operation and maintenance and the costs of repairing and replacing any broken or old parts over the device’s lifetime (Burch and Thomas, 1998). Accurate estimates of maintenance and labor costs may be difficult to calculate. Total costs should also include program costs that make the implementation of the device successful, such as education and training.
Costs can be normalized in several ways. The typical way to define cost is the life cycle cost per unit volume of water produced; however, cost can also be defined as the capacity cost, which is the initial cost per unit of daily capacity or the amount of water treated per month for a household. As long as the same indicator of normalization is used, costs can be compared for many different devices. For example, a treatment system that uses membranes may have higher upfront cost than a candle filter system, but, because the membrane system has a longer lifespan and a greater flow than a candle filter, the normalized costs may be comparable.
Programs that provide humanitarian relief during disasters, such as AmeriCares, PSI, UNICEF, World Vision, International Rescue Committee, International Federation of Red Cross, GWI, USAID, and Samaritan’s Purse, all operate differently (Lantagne et al., 2007). This means their costs for products will all be different. Expenses vary by location and distribution strategy, that is, how the device is transported and installed and whether training/demonstrations are made available. Studies have shown that programs that incorporate training methods into treatment device distribution have a higher rate of social acceptance of the device, and, thus, the device is more effective. Working closely with local governments, providing technical assistance, and training locals to become technical experts are program additions that increase the effectiveness of the program but also increase the cost of the program.
Because programs affect the variability of cost so much, it might be appropriate to examine costs of water treatment technologies without considering program costs such as training. However, some devices can be implemented with less training than others and thus might be more cost-effective in certain situations. In fact, the training associated with devices is what prompts effective water treatment. Program costs associated with each device need to be considered. In order to accurately assess and compare costs, a template could be created with cost estimates for:
• Manufactured cost of hardware and lifetime of device
• Transportation: how far and by what method the device will be transported from manufacturer to consumer
• What installation is needed, how long it takes to install, and who is required to install
• Daily labor costs involved could include:
• The cost of paying someone to operate the system, or
• Opportunities lost elsewhere by operating the device
• How often parts need to be replaced and repaired, taking into account supply chain availability
• Education: training locals, training local safety officials, educating local governments, performing demonstrations
Several studies have mentioned that the cost of the initial response to provide drinking water during an emergency is somewhat disregarded (Lantagne and Clasen, 2009). Only when the first, rapid response transitions to a more long-term treatment approach does cost become more of a consideration. Making the change from the high-cost treatment used in a rapid response to low-cost, sustainable treatment options helps save money. Programs that strive to implement sustainable practices face financial challenges as well because longer programs require more staffing and a supply chain for replacement parts. However, implementation of these sustainable programs is possible. As an example, Potters for Peace, a program that teaches pottery to locals, was initially funded by private donations but is now a self-financed micro-enterprise (Lantagne et al., 2007).
1.4.1 How Much Should Recipients Pay?
Several groups of researchers conducting studies distributed a water treatment product for free in developing countries (Clasen and Boisson, 2006; Colindres et al., 2007; Doocy and Burnham, 2006; Lantagne and Clasen, 2009) and evaluated the willingness of locals to pay for the product after the study was over (Colindres et al., 2007; Lantagne and Clasen, 2009). These studies found that the willingness to pay for the products was always less than what the products would be sold for at average product cost (not including transportation, distribution, and marketing). Even in cases where the products were not distributed for free, people’s willingness to pay for the technology was almost always lower than the selling price mainly because of their very low incomes. This simply means that clean and safe drinking water needs to be heavily subsidized. For water treatment devices to be used and maintained effectively, the recipients must have a desire to use the device as well as pay for at least a small part of the true cost of the device (Burch and Thomas, 1998). This generates ownership of the device and ensures someone will be responsible for the upkeep of the device. Studies have shown that people who owned a water treatment device were more likely to use their device if they sought out the device, rather than being offered the device by nongovernmental organizations (Gupta et al., 2008).
Different NGOs and programs offer different ways of providing subsidized water treatment to communities in the aftermath of emergencies. Some programs sponsor the hardware needed for safe water storage and sell a chemical disinfectant at a low cost. Some programs provide a filtration device and require that the users transport and construct the device and become trained in how to use it. Another program installs the filters, provides training, and additionally trains local officials to promote correct use of the device. These different relief efforts all have different costs associated with their programs and treatment devices but cannot charge the true cost of the device to the consumers as they are unable to pay. Donations from faith-based organizations, corporations/agencies, and private donations to various relief funds bridge the gap between what the recipients can afford and what the devices actually cost (Lantagne et al., 2007).
1.4.2 Relative Costs
When implementing water treatment systems, it is important to consider that POU water treatment is more effective in preventing disease and costs less than installing protected wells and springs (Clasen and Boisson, 2006). The costs of implementing POU alternative emergency water treatment need to be compared to costs of either prior treatments used (such as the aforementioned wells or boiling water) or the costs of not using any treatment (medicine, opportunities lost due to illness, etc.). Alternative water treatment devices may seem expensive initially, but, comparatively, the cost of using these devices ends up being much less. Discrepancies exist between the different definitions of “inexpensive” in these studies, however. Some devices are described as inexpensive when, in reality, they are expensive for recipients (Gupta et al., 2008; Islam and Johnston, 2006). These discrepancies could be caused by the studies’ authors’ ignorance of the percentage of income recipients can afford to spend on water treatment devices.