
6
The Tokamak Fusion Test Reactor
Abstract
This chapter describes the design, operational regimes and results of the Tokamak Fusion Test Reactor (TFTR) which operated at the Princeton Plasma Physics Laboratory from 1982 to 1997. TFTR was a large tokamak (plasma current up to 3 MA) equipped with high power auxiliary heating by neutral beam injection (up to 40MW) and RF waves (up to 11 MW) and excellent plasma diagnostics. After developing and characterizing regimes of operation in deuterium plasmas with temperatures and density approaching those required for a fusion reactor, TFTR conducted an extensive research program with deuterium-tritium plasmas between 1993 and 1997. In addition to investigating the confinement of fusion alpha particles and the effects of isotopic mass on confinement, many issues of relevance to the development of magnetic fusion reactors were studied, such as RF heating and current drive in mixed-species plasmas, tritium handling and tritium retention in plasma-facing components.
Keywords
52.55.Fa Tokamaks; 52.55.-s Magnetic confinement and equilibrium; 28.52.Cx Fueling, Heating and ignition; 52.55.Pi Fusion products and fast particle effects; 52.55.Tn Ideal and resistive MHD modes; 52.35.Ra Plasma turbulence; Alpha particle; Charge exchange; NBI; Supershot; Tokomak fusion test reactor (TFTR); Toroidal field; Tritium6.1. Introduction
The Tokamak Fusion Test Reactor (TFTR) was approved by the US Atomic Energy Commission in 1974 for development at Princeton Plasma Physics Laboratory. The primary objective for the TFTR described in 1976 was “to demonstrate fusion energy production from the burning, on a pulsed basis, of deuterium and tritium in a magnetically confined toroidal plasma system.” This objective was to be satisfied “by the production of 1–10 MJ of thermonuclear energy (per pulse) in a deuterium–tritium tokamak with neutral beam injection (NBI) under plasma conditions approximating those of an experimental fusion power reactor.” TFTR was expected to exploit the “two-component torus” approach (Dawson et al., 1971) to achieve high fusion reactivity. This would involve creating in a mainly tritium plasma, a population of energetic deuterium ions by injecting powerful beams of high-energy neutral deuterium. A plasma temperature of 5–10 keV, a density approaching 1020 m−3, and an energy confinement time of about 0.1 s would be required.
TFTR began operation in December 1982. Experiments with plasmas containing tritium began in December 1993 and continued until April 1997. Hawryluk (1998a) has published an extensive review of the results from the 14 years of TFTR operation culminating in the 4 years of deuterium–tritium experiments.
6.2. TFTR design and capabilities
The baseline parameters of the TFTR and the values achieved in operation are shown in Table 6.1.
The plasma current capability of 2.5 MA was chosen to ensure confinement of most of the energetic alpha particles that would be produced. The decision to adopt a circular minor cross section of the plasma reflected a desire not to introduce additional technical complexity and, at that time, unproven elements to what was then foreseen as being a relatively short-term project. TFTR already involved considerable extrapolation from existing experiments in its scale, plasma parameters, its high-energy NBI system, and, particularly, in the planned use of tritium.
Fig. 6.1 shows a view of the TFTR Test Cell in 1989 with the neutral beam heating installed and most of its ancillary and diagnostic systems in place.
Table 6.1
Basic design parameters of TFTR and achieved values, where different
| Design value | Achieved value (where different) | |
| Vacuum vessel major radius (m) | 2.65 | |
| Vacuum vessel minor radius (m) | 1.1 | |
| Toroidal field (T) at radius 2.52 m | 5.1 | 5.9a |
| Duration (s) of maximum toroidal field | 3 | |
| Plasma current (MA) | 2.5 | 3.0b |
| Duration (s) of maximum plasma current | 2 | |
| NBI heating power (MW) | 20 | 40 |
| NBI pulse duration at maximum power (s) | 0.5 | 0.8c |
| NBI accelerating voltage (kV) | 120 |

Figure 6.1 View of the TFTR Test Cell with the tokamak structure in the center, one of the neutral beam injectors on the right, the pumping ducts (foreground and left), and various ancillary and diagnostic systems.
6.2.1. Magnets
All the magnets for TFTR were conventionally wound, pulsed, and water-cooled coils. The toroidal field (TF) was generated by 20 coils, each with 44 circular turns in stainless steel cases. It was routinely operated at its original design specification. When results obtained in the first D-T experiments suggested that operating at higher toroidal field could increase the D-T fusion power and extend the investigation of the physics of fusion alpha particles, an extensive analysis of the coil was conducted. It was concluded that higher field operation was possible and prudent, albeit with some increase in the risk of a coil failure. The coil was eventually operated to produce a toroidal field of 6.0 T at a major radius of 2.48 m, for a limited number of pulses, and many more at 5.6 T. During its D-T phase, the TF coil cooling water was replaced by a fluorocarbon fluid because of concerns over water leaks that had occasionally degraded the insulation of the coil.
There were four independent coil systems generating the external poloidal magnetic field (PF) in TFTR: the ohmic heating (OH) transformer coil (without a ferromagnetic core) to generate and sustain the toroidal plasma current; the equilibrium field (EF) coil, which provided most of the (major axial) field needed for major radial equilibrium of the plasma; the horizontal field (HF) coil, which provided a small major radial field; and the variable curvature (VC) coil, which provided a degree of control for the shape of the plasma cross section.
Most of the energy needed to produce the magnetic fields in TFTR was drawn from two flywheel motor-generator sets. The AC power from the generators was transformed in voltage and converted to pulsed DC for the coils and auxiliary heating systems by phased-controlled thyristor rectifiers.
6.2.2. Vacuum vessel, plasma-facing components, bakeout system, and other “conditioning” techniques
The vacuum vessel of TFTR consisted of 20 stainless steel (304-LN) sectors. Fourteen Inconel bellows sections were incorporated to increase the toroidal resistance of the vessel and thereby reduce the penetration time for the poloidal fields for planned adiabatic compression experiments.
In the early operation of TFTR, the plasma boundary was defined by a moveable “jaws limiter” consisting of three hinged blades covered with synthetic graphite tiles. This limiter was designed to provide suitable initial plasma cross sections for adiabatic plasma compression experiments, and it also allowed investigation of the size scaling of plasmas. The moveable limiter was not capable of handling the full power of the neutral beam system, and it was removed in 1986.
A toroidally symmetric “inner bumper limiter” (IBL) was installed on the inboard side in 1985. This consisted of tiles made of synthetic graphite mounted on water-cooled, Inconel backing plates. Its plasma-facing surface was a section of a torus with a major radius of 2.65 m, a minor radius of 1.00 m extending ±60 degree poloidally from the midplane on the inboard side. Although this limiter was designed to handle much higher power, at high NBI power, discharges sometimes suffered from massive influxes of carbon, known as “carbon blooms,” as a result of localized heating of the surface. In 1989 the graphite tiles near the midplane were replaced with carbon-fiber-composite (CFC) tiles, and the limiter surface was realigned to the center of the TF coil (Ulrickson et al., 1990). In 1991 the bumper limiter was again realigned to an accuracy of ±0.5 mm to the actual toroidal magnetic field by using NMR probes to establish a reference. This final realignment substantially reduced the incidence of large carbon influxes during high-power operation. On the outboard side, partial poloidal rings of CFC elements were installed to protect the ion cyclotron range of frequencies (ICRF) launchers. Fig. 6.2 shows the interior of the TFTR vacuum vessel in 1993 during its last opening prior to the start of operation with tritium.
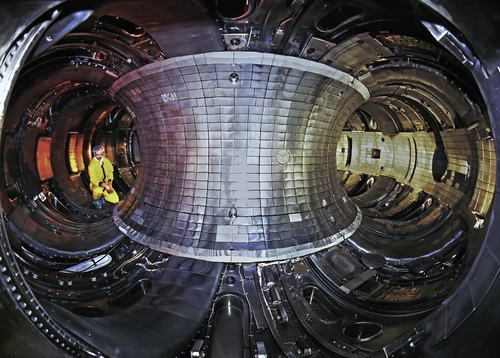
Figure 6.2 View of the TFTR vacuum vessel interior showing the inner belt limiter, the outer ring limiters protecting the ICRF launchers, and the armor plates protecting the outer midplane of the vacuum vessel from unabsorbed neutral beam power.
The vacuum vessel of TFTR was bakeable only to 150°C. This was an impediment to achieving a rapid return to high-performance plasma operation after any opening of the vacuum vessel to air because it was not high enough to effectively remove water from the near-surface layers of the carbon plasma-facing components (PFCs). After several days of bakeout, continuous DC glow discharge cleaning in both deuterium and helium, Taylor discharge cleaning in deuterium and pulse discharge cleaning (PDC) were performed with the vessel hot. The PDC raised the temperature of the carbon PFCs on the bumper limiter to about 250°C, which hastened the removal of water from the carbon. A procedure known as “disruptive discharge cleaning” was then applied. This involved provoking disruptions in ohmically heated discharges at successively increasing levels of plasma current up to about 2 MA in order to produce flash-heating of the bumper limiter surface.
In 1989 the technique of “boronization” was adopted for TFTR (Dylla et al., 1990). This was accomplished by running a glow discharge in a mixture of deuterated diborane (B2D6) (10%), deuterated methane (10% originally but later omitted), and helium for several hours. This deposited a layer of boron-containing compounds, of order 100 nm thick, on the PFC surfaces, which effectively combined with water, reducing the level of oxygen impurities in subsequent plasmas. The beneficial effects persisted, and eventually it was only necessary to apply boronization every few weeks of operation, involving many hundreds of tokamak discharges to maintain good discharge conditions.
6.2.3. Heating systems
6.2.3.1. Neutral beam injection
TFTR was equipped with four neutral beam injectors, each with three positive-ion sources, developed and built by Lawrence Livermore National Laboratory. The original “short-pulse” sources installed in 1984 were replaced in 1986 by a second generation of “long-pulse” sources capable of 2 s pulses at higher accelerating voltage.
The four tangentially injecting beamlines were initially installed with three of them injecting in the co-parallel direction and only one in the counter-parallel direction relative to the plasma current. It was observed during the early experiments with TFTR “supershots” in 1986 that both the global confinement time and the D-D fusion rate were maximized when roughly equal amounts of NBI power were injected from the co- and counter- parallel sources. As a result, the decision was made to reorient one of the beamlines from co- to counter- parallel in 1987. Thereafter, there were six individual beam sources available for both co- and counter- parallel NBI.
The long-pulse neutral beam sources injected power on at least 21,000 TFTR shots, including more than 300 shots where the total NBI power exceeded 30 MW and 732 shots with tritium injected on at least one source. The peak accelerating voltage was 110 kV for deuterium and 120 kV for tritium injection, and the maximum injection pulse length was 3 s (by injecting groups of the sources sequentially) although, more typically, injection pulses were about 1 s in duration. In typical operation, the fractions of the power in the full-energy, half-energy (from  or
or  ion acceleration), and third-energy (from
  or
or  ) components in the injected neutrals were 0.64, 0.28, and 0.08, respectively. During tritium experiments, it was possible to switch between deuterium and tritium injection on a shot-by-shot basis. This greatly enhanced the capability of TFTR to compare deuterium and tritium plasmas and to study the physics of fusion alpha particles.
6.2.3.2. Ion cyclotron heating
The encouraging results obtained in the 1970s and early 1980s with plasma heating by high-power RF waves in the ICRF prompted the installation of wave-launching structures and RF power generators in TFTR. In 1988 the first two launchers were installed on the outboard midplane, each containing a pair of toroidally separated, poloidally aligned conductor elements. In 1991–92 four additional RF power generators and two new dual-strap antennas were installed. Four of the generators were tunable over the range 40–80 MHz while two remained at a fixed frequency of 47 MHz. With this system, RF power up to 11 MW was launched into TFTR.
To investigate using ion Bernstein waves (IBW) for plasma heating and profile control, two of the fast-wave antennas were modified to a four-strap configuration, and an additional outer midplane launcher with four poloidally separated straps aligned in the toroidal direction was installed.
In total, almost 7000 TFTR discharges had ICRF power injected, of which more than 3000 had combined ICRF and NBI heating. The combined ICRF and NBI power reached 37 MW.
6.2.4. Fueling and impurity injection systems
TFTR was equipped with piezoelectrically controlled gas injection valves that could supply various gases to initiate the discharge and then to fuel it. However, gas fueling was almost discontinued once it became apparent that fueling with NBI alone produced substantially higher plasma temperatures, of both ions and electrons, overall energy confinement, and fusion reactivity. When the carbon limiter had been “conditioned” to reduce the influx of hydrogenic species, the NBI penetrated to the core, creating a rapid density buildup there. In the discharges producing the highest D-T fusion power in TFTR, the central electron density increased from <2 × 10¹⁹ m−3 to as high as 1 × 10²⁰ m−3 in 0.7 s through NBI fueling.
Between March 1985 and 1992, TFTR was equipped with successive injectors for frozen deuterium pellets. The multibarrel, gas-propelled injector could inject a single large pellet (4-mm diameter containing ∼2 × 10²¹ deuterons) and up to five smaller pellets (2.7-mm diameter, ∼7 × 10²⁰ deuterons each) per discharge at speeds up to 1.5 km/s.
In 1989 an injector for pellets consisting of a few milligrams of lithium or carbon was installed on TFTR, originally for diagnostic purposes. Eventually the injection of lithium, and to a lesser extent carbon, pellets was developed in TFTR as a method for suppressing the influx of hydrogen isotopes bound on the limiter surface. The injector was modified to provide up to four pellets per shot. The lithium injected on one shot formed a coating on the carbon surface, which suppressed the release of hydrogen during a subsequent plasma pulse, thereby increasing its confinement significantly (Mansfield et al., 1996). Other methods were also developed to apply lithium coatings to the limiter including a lithium evaporator and a generator that created a cloud of lithium droplets at the plasma edge by laser ablation (Mansfield et al., 2001).
6.2.5. Tritium handling, delivery, and exhaust systems
Tritium gas was supplied to TFTR in a nuclear-qualified shipping container holding up to 2 g of tritium. The tritium was absorbed onto a uranium bed from which it could be released by thermal desorption as needed and transferred through double-wall pipework into the TFTR Test Cell to the tokamak gas injectors and neutral beam systems. The tritium gas handling system of TFTR is illustrated in Fig. 6.3.
The exhaust gas from the tokamak vacuum vessel and the neutral beam systems accumulated in a gas holding tank, where it was assayed. For most of the D-T operation of TFTR, the exhaust gas was then oxidized to produce tritiated water (predominantly HTO, DTO) that was adsorbed on molecular-sieve beds for disposal at a nuclear waste repository.

Figure 6.3 The tritium gas delivery and exhaust system for TFTR. The cryogenic distillation system to extract and purify tritium from the exhaust gas was operated during the final year of TFTR operation. Prior to that, the exhaust gas was oxidized to produced water containing mixed hydrogen isotopes, which was absorbed onto molecular-sieve beds for eventual disposal.
In the final months of TFTR operation, a small-scale tritium purification system was commissioned. This cryogenic distillation system provided a closed cycle for tritium operation, reducing both the tritium supply needed and amount of tritium contaminated waste.
The tritium system was subject to a regulatory limit of 5 g of tritium (approximately 1800 TBq of radioactivity) in process (ie, anywhere between the delivery container and the disposal container) at any time. Furthermore, the vacuum vessel was subject to an additional regulatory limit of 2 g of tritium that might be releasable in the event of a worst-case failure of the vacuum system that overwhelmed the capacity of the tritium cleanup system.
Tritium release remained well below regulatory guidelines throughout the D-T phase of TFTR operation and subsequently during its decommissioning and the dismantling. Operations involving the movement of tritium were rigorously controlled by approved procedures, and all operator actions were documented and verified. Extensive training and qualification of the staff was an important element in the program.
6.2.6. Tritium retention and removal
The amounts of tritium introduced into the vacuum vessel by gas puffing and through NBI were well known. Since the amount of tritium leaving the vacuum vessel was also measured through its radioactivity, it was possible to determine the tritium retention in the vacuum vessel.
During each of the three periods of D-T operation of TFTR, about 50% of the tritium injected into the vacuum vessel during plasma operation was retained there (Skinner et al., 2001). Each was followed by a cleanup campaign to remove tritium. Three main techniques were employed: glow discharge cleaning (GDC) using deuterium as the working gas, GDC with a mixture of 10% oxygen in helium, and simply purging the vessel with atmospheric air (Mueller et al., 1997; Nagy et al., 1997). All techniques were more effective with the vessel heated to 150°C.
In total, over the three active cleanup campaigns, about 1.6 g of tritium were removed. Following the last campaign of active tritium removal at the end of TFTR operation, it was estimated that about 0.64 g of tritium remained in the vacuum vessel of the approximately 5 g injected over the entire period of D-T operation. There was quite good agreement between this estimate of tritium inventory in the vessel and the 0.56 g obtained by extrapolating ex situ measurements of the tritium concentration on representative limiter tiles and wall coupons (Skinner et al., 2001).
6.2.7. Shielding
The walls and roof of the “Test Cell” housing TFTR contained borated concrete neutron shielding. Extensive measurements of its effectiveness for 2.45 MeV neutrons showed that it would be possible to conduct a comprehensive program of D-T experiments without the need to install an additional close-fitting “igloo” shield around the tokamak, which would have severely restricted access to the tokamak and diagnostics. The radiation dose from neutrons and gammas at the site boundary remained well below the conservative regulatory limits throughout the D-T experiments.
6.2.8. Conduct of maintenance, installation, and final decommissioning
During the D-T experiments, the dose rates near the tokamak itself remained sufficiently low such that hands-on access was permitted within conservative exposure guidelines for many of the areas containing critical systems. Work near the tokamak structure was staged to allow decay of the most active but short-lived isotopes, and each task was performed according to a procedure designed to minimize worker exposure.
In late 1996, prior to the final period of experimental operation in TFTR, new launching antennas for ICRF heating were installed. This necessitated breaking vacuum in the vessel after more than 3.5 years of D-T operation. Negative pressure was continuously maintained inside the vessel by placing temporary barriers around openings to contain the radioactive gases and minimize release into the TFTR Test Cell. Although the activation of the vacuum vessel by neutron irradiation produced a contact dose of ∼100 mrem/h at that time, the total radiation exposure during the complete installation was kept below 6.6 rem; this total was distributed amongst several workers who individually received doses less than stringent regulatory limits (Hosea et al., 1997).
The final decommissioning of TFTR was carried out over 3 years between October 1999 and September 2002 (Perry et al., 2003). The objective was to remove all significantly activated or contaminated components from the TFTR Test Cell and related areas for disposal at an appropriate radiological waste site. Some separable systems and components were decontaminated and saved for eventual reuse in successor experiments at PPPL, among these the four neutral beamlines and some of the RF system components.
At the beginning of the decommissioning, the vacuum vessel was estimated to contain about 0.6 g of tritium, and the neutron-induced induced radioactivity produced a contact dose rate of 0.5 mGy/h at the vacuum vessel outer surface, although rates on surrounding structures were much less. The vacuum vessel was separated into 10 sectors by a diamond wire-cutting method (Raftopoulos et al., 2002) after the interior had been filled with a low-density concrete “foam” to reduce the potential outgassing of tritium into the air. At the conclusion of the decommissioning, about 50 mg of tritium had been released through a vent stack into the atmosphere.
6.2.9. Diagnostics
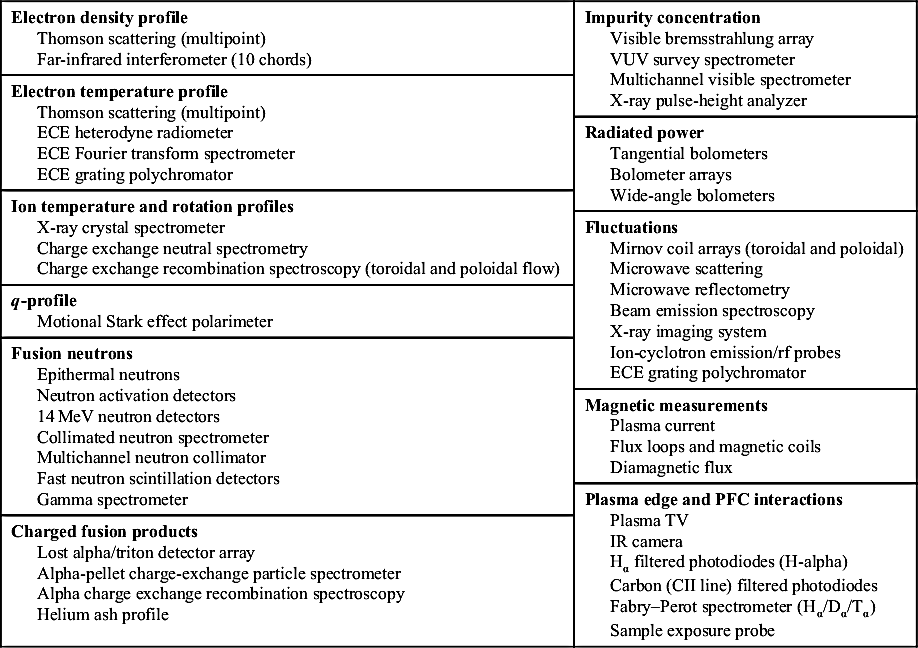
Providing comprehensive and, where possible, competing, diagnostic instrumentation for studying the plasma underpinned the plan for TFTR diagnostics. Many new diagnostics were designed, built, and operated during the TFTR research program, including several by collaborators from institutions in the United States and from overseas. The principal diagnostic systems for TFTR are listed in Table 6.2.
For studying alpha particle physics, an array of four detectors for lost energetic alphas, and also energetic tritons from D-D reactions, was installed at different poloidal angles in the “shadow” of the outer limiter rings in the lower-outer quadrant of the vacuum vessel. Escaping ions could enter each of these detectors through a slit and, through their gyro motion, impinge on the surface of a scintillator. An image of the scintillator emission gave information about the energy and pitch angle of the particles.
Confined fusion alpha particles could undergo charge exchange with beam-injected neutral hydrogen and then, in decaying from an initially excited state, emit Doppler-broadened line radiation, which was analyzed with the alpha charge-exchange recombination spectrometer (Alpha-CHERS). From these data it was possible to determine the energy distribution of the alpha particles during their thermalization.
In the dense cloud of lithium neutrals surrounding an injected lithium pellet, the energetic alpha particles could undergo double charge exchange, escape from the plasma, and enter a mass and energy resolving particle detector. This pellet charge exchange (PCX) measurement was highly perturbative to the discharge. However, by moving the injection time progressively later into the NBI pulse in a sequence of discharges, it was possible to measure the evolution in time of the alpha particle distribution.
6.3. TFTR operational regimes: requirements, characteristics and limitations
6.3.1. Ohmically heated plasmas
Prior to the start of NBI heating studies in 1984, TFTR carried out experiments to characterize the confinement of ohmically heated plasmas. These were conducted with the moveable jaws limiter, which enabled some independent variation of the major and minor radius. Gas puffing under feedback control maintained the line-average plasma density. The maximum density was limited by rising radiated power and the onset of thermal collapse at the edge to  .
.
Pellet fueling extended the investigation of confinement with ohmic heating to much higher density (Schmidt et al., 1986): the line-average density reached 1.4 × 10²⁰ m−3, exceeding the nominal Greenwald limit by a factor 1.3. The density profiles could be quite peaked with central electron density reaching 4 × 10²⁰ m−3. With multiple pellet fueling of an ohmically heated TFTR plasma, the Lawson parameter ne(0)·τE reached 1.4 × 10²⁰ m−3s, a tokamak record that still stands.
6.3.2. Neutral beam injection–heated plasmas
6.3.2.1. L-mode
The first results with dominant NBI heating in TFTR showed dependences of the energy confinement time on current and power consistent with the L-mode scaling of Goldston (1984), although the much larger plasma size and current in TFTR meant that its confinement times were higher than in its predecessors. However, early in 1986 results from experiments with the NBI heating power increased to 13.5 MW showed that although L-mode scaling matched reasonably well the confinement at high current, the results at low current were significantly above the L-mode prediction (Bell et al., 1986).
6.3.2.2. Supershots in TFTR
In June 1986 an attempt was made to reproduce in TFTR the regime that had produced exceptionally high ion temperatures in the PLT tokamak in 1978 (Eubank et al., 1978). In the TFTR experiment (Strachan et al., 1987a), a series of about 80 discharges, either ohmically heated (1.4 MA) helium plasmas or low-current (0.8 MA) deuterium plasmas with up to 5 MW NBI, was run prior to applying higher-power NBI heating. This was intended to remove as much as possible of the adsorbed hydrogen and deuterium from the surface of the carbon limiter, a process referred to as either “limiter conditioning” or “limiter degassing.” In the first NBI-heated plasma following the conditioning sequence, no gas fueling was added beyond the prefill gas needed to establish the plasma current of 0.8 MA. The line-average density at the onset of the NBI heating was 0.8 × 10¹⁹ m−3. The results were dramatic—not only was a very high central ion temperature of 10 keV measured, but the central electron temperature also increased to 7 keV and its profile became broader. The poloidal beta reached 1.8 and global energy confinement time was well above the L-mode prediction for that current and power. Furthermore, the rate of neutron emission from D-D fusion reactions was about 50% higher than what had been achieved in preceding L-mode discharges with the same NBI power but almost three times larger plasma current. Interestingly, as a consequence of fueling by the NBI itself, the central density was high, over 7 × 10¹⁹ m−3, and the density profile was very peaked with  reaching 2.6.
These initially encouraging results could soon be reproduced quite reliably, but at first only in discharges with plasma current less than about 1 MA. At higher current, the limiter conditioning was less effective in achieving the low-edge density, which appeared to be necessary to achieve localized central deposition of the NBI. Also, at higher current, more NBI power was required to suppress the repetitive sawtooth relaxations, which appeared to be a distinctive and essential feature of this operational regime. It was quickly established that in this mode of operation, the global energy confinement time did not degrade rapidly with heating power as in the L-mode, and that the D-D neutron rate increased almost as the square of the applied NBI power. These high-fusion-performance discharges came to be known as “supershots” in the control room, a sobriquet that lasted through the end of TFTR.
The maximum fusion performance of the early supershots at relatively low current was limited by disruptions resulting from pressure-driven MHD instabilities, ie, a manifestation of the tokamak β-limit (Troyon et al., 1984). Efforts began immediately to extend supershots to higher plasma current, which was expected to increase the β-limit. Considerable operational time was devoted to various “conditioning” techniques to deplete the hydrogen isotope content of the surface layers of the graphite limiter surface. Supershots were eventually achieved at plasma currents up to 2.7 MA, although this took several years of development.
6.3.2.3. H-mode
In 1988 it was observed that TFTR limiter discharges in which the plasma current was deliberately reduced immediately prior to or during the NBI heating pulse could undergo a spontaneous transition to the H-mode of confinement. Subsequently it was found that brief gas puffs of deuterium or helium or the injection of the carbon pellet into the plasma edge could also trigger an H-mode transition. The transition was marked by the characteristic initial drop in the hydrogen and deuterium Balmer-alpha line (Hα) emission from the plasma edge and the subsequent signatures of repetitive edge-localized modes (Bush et al., 1990a,b). Following the transition, there was a steepening of the radial gradient of the plasma electron density to form a “density pedestal” just inside the plasma boundary.
While there was usually a slight increase observable in the energy confinement time following the H-mode transition, the confinement times were not significantly higher than in the preceding supershot phase with the more usual “L-mode-like” edge.
6.3.2.4. High internal inductance regime
In efforts to improve the stability limit for TFTR supershots, collaborators from Columbia University, New York, investigated modifying the current profile transiently with current ramps immediately before the NBI heating. It was found that by ramping down the plasma current on a timescale less than the resistive skin time, supershots reached significantly higher values of the normalized beta than could be achieved in discharges without current ramp-down having the same final current, ie, the benefit for global stability of the initially higher current was conferred on the discharge with the reduced final current. Conversely, current ramp-up applied immediately before NBI reduced the achievable normalized beta.
The current ramp-down reduced the edge current density while leaving the central current density essentially unperturbed, thereby increasing the internal inductance parameter li. Ratios of the initial current before to the final current after ramp-down as high as 2 were employed and values of li as high as 3.4 were produced in TFTR.
Another technique to produce a high-li plasma, involved producing a high-current, low-qedge ohmically heated discharge on the IBL, which was then moved outward slightly in major radius to allow the plasma to expand freely in minor radius immediately before applying NBI heating. An increase in li from ∼1.0 before the expansion to ∼1.3 afterward was achieved at a plasma current of 2.2 MA with this technique (Bell et al., 1997; Sabbagh et al., 1996).
6.3.2.5. Reversed shear and enhanced reversed shear
Theoretical calculations performed in the early 1990s had shown the possibility that tokamak equilibria in which the central current density was reduced significantly to create a region near the magnetic axis with negative, or “reversed” magnetic shear, ∂q/∂R < 0 near the axis and q0 > 1 throughout the plasma would be attractive for a reactor. Furthermore, there was interest in modifying the q-profile to study Alfvén eigenmodes excited by fusion alpha particles. In 1995, discharges with reversed shear (RS) in the core were produced by applying a modest level (several MW) of NBI heating during the initial ramp-up of the plasma current to inhibit penetration of the current.
After creating a reversed-shear equilibrium, a period of high-power NBI heating was applied to the plasma. Below a threshold heating power, the reversed-shear plasma exhibited confinement characteristics similar to supershots. However, for higher power, the plasma could undergo a spontaneous transition, marked particularly by a sudden increase in the rate of rise in the density, to a regime of markedly improved confinement, which was denoted “enhanced reversed shear” (ERS) (Levinton et al., 1995). Although many ERS plasmas were obtained and studied in TFTR, the transition to ERS did not always occur even when external conditions were held constant.
Following the ERS transition, a localized region of very large radial gradients developed in both the temperature and density profiles, indicating a local suppression of the radial transport of both energy and particles. The location of this “transport barrier” coincided roughly with that of the minimum in the radial profile of the safety factor q(r). Similar phenomena were also observed in the “negative central shear” regime, which was discovered essentially simultaneously in the DIII-D tokamak (Strait et al., 1995). While the confinement benefits of the ERS regime were very clear, the possible benefits in terms of an increased β-limit were not achieved in TFTR because of the enormous pressure gradients that developed. Furthermore, the evolution of the current profile under the combined actions of the bootstrap current driven by the pressure gradient and the NBI-driven and inductively driven currents appeared to decrease the β-limit with time during the NBI heating (Bell et al., 1997).
6.3.2.6. Detached plasmas and radiating mantles
In addition to triggering H-mode transitions and modifying the global plasma stability, current ramp-down in conjunction with gas puffing was used to produce plasma “detachment” from the limiter in TFTR (Strachan et al., 1987b,c). In the detached state, the plasma edge shrank from the limiter contact point and remained in a stable equilibrium for several tenths of a second. Most of the power flux from the plasma was radiated from the edge, and the power flux to the limiter was substantially reduced. In ohmically heated plasmas, helium puffing sufficed to create a stable detached plasma. For plasmas with increasing NBI heating power, neon, argon, krypton, and xenon gas puffing were employed to ensure than enough power would be radiated (Hill et al., 1999).
6.3.3. ICRF heated
Several schemes were used in TFTR to couple the fast magnetosonic waves launched into plasmas containing predominantly deuterium, helium-4, or tritium. These included fundamental resonant absorption on a minority ion species, either hydrogen or 3He, or, for sufficiently high ion-β, using absorption at the second harmonic of the majority plasma ion species. By choosing the plasma composition, the ICRF frequency, and the magnetic field to eliminate, as far as possible, ion resonances from the plasma, direct absorption of the waves on the plasma electrons was also investigated. Later during the D-T phase, the coupling of IBW was studied.
6.4. Main physics results from TFTR (not D-T specific)
6.4.1. Thermal energy and particle confinement
6.4.1.1. Confinement in ohmically heated plasmas
The confinement of ohmically heated plasmas in TFTR was reported by Efthimion et al. (1984a,b) and later by Murakami et al. (1986). For the largest minor radius plasmas (a = 0.83 m), the energy confinement time was found to follow a “neo-Alcator”-type scaling  with qa the edge safety factor. By moving the blades of the jaws limiter, smaller plasmas could be produced. Comparing plasmas in TFTR with those in PLT with the same minor radius (a = 0.4 m) suggested a strong scaling, τE∝R2, with major radius. Overall, the early TFTR and the PLT results combined to produce the scaling
  . Subsequently, Grisham et al. (1994) compared plasmas in TFTR with the same minor but different major radii limited on the inboard or outboard side. These confirmed a strong major radius scaling, approximately as R2, for both the total and the electron energy confinement time.
6.4.1.2. Confinement of plasmas with dominant auxiliary heating
Confinement studies in TFTR changed dramatically with the advent of NBI heating, not only because of the wider range in plasma density and temperature accessible but because NBI heating enabled measurement of the ion temperature profile through charge-exchange recombination spectroscopy. The confinement and transport in deuterium plasmas were described in the review by Hawryluk et al. (1991).
Scott et al. (1990a) analyzed the thermal plasma confinement and the “effective” cross-field transport coefficients χi,e(eff) ≡ Qi,e/ni,e∇Ti,e, where Qi,e is the total ion or electron power flux (conduction plus convection) for scans of NBI power and plasma current in L-mode and supershot plasmas. In both regimes, thermal ion transport was the dominant loss channel. There was also a strong correlation between the ion thermal diffusivity and the momentum diffusivity χφ(eff) (Scott et al., 1990b). These observations strongly suggested that cross-field  transport produced by turbulent plasma fluctuations, rather than parallel transport produced by magnetic stochasticity, was the mechanism involved. The effective ion diffusivities exceeded the neoclassical ion diffusivity by more than an order of magnitude (Hawryluk et al., 1991).
The size scaling of confinement in L-mode plasmas with dominant NBI heating (PNBI/POH > 10) was also studied (Grisham et al., 1991; Scott et al., 1990a). Again, there was a strong scaling with major radius at constant minor radius and power for the total and the thermal stored energies. The scaling with minor radius was by contrast weak, or perhaps even negative, reflecting the fact that the calculated average thermal diffusivity, χavg ≡ (Qi + Qe)/(ni∇Ti + ne∇Te), increased with inverse aspect ratio ε = r/R0, approximately as χavg∝ε over the plasma profile.
Synakowski et al. (1990), Zarnstorff et al. (1990), and Efthimion et al. (1991b) studied the diffusion into L-mode plasmas of trace amounts of helium, concluding that the helium diffusivity DHe scaled with temperature roughly as  , which was consistent with drift-type electrostatic turbulence.
The dependence of transport on the nondimensional plasma parameters of the normalized ion gyroradius ρ∗(=ρi/a) and normalized collisionality  with νbe the electron bounce frequency) was investigated in TFTR L-mode plasmas (Perkins et al., 1993). The goal was to determine whether the dependence of transport was Bohm-like (normalized transport independent of ρ∗) or gyro-Bohm-like (normalized transport proportional to ρ∗). The experimentally controllable parameters (B, I, n, PNBI) were systematically varied to produce sequences of discharges in which ρ∗, or
  , changed while the other significant nondimensional parameters where maintained as constant as possible. The total (ion plus electron) thermal transport fluxes through the “confinement zone” of the plasma, 0.3 < r/a < 0.8, were compared with several different scalings. The surprising result was that the Bohm-like scaling provided a better fit to the data than the gyro-Bohm scaling. The implication was that the spatial scale of the instabilities responsible for the anomalous transport appeared to vary with the overall system size, rather than being set by local plasma parameters. Data from these studies were compared with later theoretical models that treated the ion and the electron transport separately (Mikkelsen et al., 1997). For the electron transport, at least, some reconciliation of the data with gyro-Bohm scaling predictions was achieved.
It soon became apparent that the scaling of confinement in supershots with externally controlled parameters was different from their L-mode counterparts. The upper boundary of the data points in a plot of the total energy confinement time versus heating power showed almost no degradation with power up to the maximum tolerable power at each plasma current (Bell et al., 1988). However, neither did the confinement time of supershots show the positive scaling with plasma current observed in both L- and H-mode plasmas in other tokamaks. The scaling of supershot confinement was difficult to characterize because the regime was so dependent on limiter and wall conditions. Although the TFTR team developed reliable heuristic measures of the state of the plasma–wall interaction to guide operation, these were not readily expressible in terms that would be meaningful for designing or operating other tokamaks. The importance of these results, however, is that they showed that factors other than the traditional external scaling variables used in the study of tokamaks had a very strong influence on confinement.
In the best supershots, the global confinement was enhanced by up to a factor of three relative to the Goldston (1984) L-mode scaling. There was a clear improvement in the enhancement factor over L-mode as the peakedness of the electron density profile, defined as  with
with  the volume-average density. This prompted analysis of the supershot data set by Park et al. (1997) in terms of the peakedness of the NBI fueling profile,
  where Se is the local electron source rate from the NBI. A scaling was deduced for the total ion stored energy (thermal plus unthermalized components) of the form
  , implying an ion energy confinement time varying with power as
  for fixed heating profile peakedness. The electron energy, however, showed more conventional dependences on heating power and plasma current,
  , with no explicit dependence on Hne. These scaling expressions described the transition from L-mode to supershot confinement as the limiter conditioning improved and explained why, for example, producing a high central density with pellet injection did not produce the confinement enhancements seen in supershots.
Analysis of the transport coefficients in supershots (Zarnstorff et al., 1988a) showed that, as a result of the strong central fueling and high ion temperature, the convective heat flux, Qi,conv = ξkTiΓi with Γi the radial ion flux, was dominant in the core of supershots. Using a convective multiplier  , which would be appropriate when ions of all energy diffuse similarly, frequently led to a negative, and therefore unphysical, conductive heat flux. A lower value
  allowed for a positive conductive flux, implying that most of the convected flux involves ions with less than the average ion energy. This result, which points to the conductive flux in supershots being extremely low, led to the practice of using the effective diffusivities, which include both the conducted and convected heat fluxes.
Scott et al. (1990a) showed that in supershots χφ(eff) ∼ χi(eff) > χe(eff), as in the L-mode, but consistent with the peaked profiles and improved global confinement, lower values in the core, particularly for the ions. Furthermore, whereas χi(eff) increased strongly with temperature in the L-mode, in the core of supershots (r < a/3), χi(eff) decreased with temperature (Meade et al., 1990). This striking difference in the transport characteristics is illustrated in Fig. 6.4.
The TFTR results on the variation of transport between and within its confinement regimes were also analyzed in terms of theoretical models for turbulent transport that were evolving at that time. The most extensively studied mechanism was the ion temperature gradient (ITG) mode for which instability is predicted when  , (
, ( and
and  being the gradient scale lengths of the ion temperature and density) exceeds a critical threshold. The ITG-driven turbulence was expected to enforce plasma profiles at marginal stability so that the profile variations would reflect the dependence of the ITG threshold on plasma parameters (Kotschenreuther et al., 1995). The early attempts to apply ITG theory to TFTR met with limited success, but by including the effects on the turbulence of the equilibrium flow shear in the plasma, a self-consistent model for the temperature profiles observed in a power scan and in response to various perturbations applied to supershots was obtained (Ernst et al., 2000). In this model, the thermal diffusivity resulting from the nonlinearly saturated state of ITG turbulence became suppressed when the shearing rate ωE×B = (RBθ/B)d(Er/RBθ)/dR, with Er the radial electric field, exceeded the linear growth rate of the most unstable mode. In supershots, the dependence of the equilibrium radial electric field, Er = ∇p/(nZe) + vϕBθ − vθBϕ on the ion pressure gradient provided a positive feedback mechanism in which an increase in the gradient tended to suppress the turbulent transport, producing a further increase in the gradient.

Figure 6.4 Variation of the effective ion thermal diffusivity (including the ion convective heat flux) with ion temperature in the confinement zone for TFTR L-mode and supershot discharges. The upper bound for the inferred diffusivity of supra-thermal NB-injected ions is also shown.
The transport characteristics of the limiter H-modes (Bush et al., 1990a,b) and the “high-li” (Sabbagh et al., 1991) plasmas in TFTR were similar to supershots in many respects. Following an H-mode transition, there was usually a slight increase observable in the global energy confinement time until the onset of ELMs. The H-mode confinement times were not substantially higher than in the preceding supershot phase with the more usual “L-mode-like” edge. The calculated thermal diffusivity profiles χe(r), χi(r) were also similar to those for supershots in the core but there was a small reduction evident in the diffusivities near the edge, reflecting the development of an edge transport barrier (Bush et al., 1990a,b).
In the high-li plasmas, the global confinement during the low-current phase following the current ramp-down was significantly higher than in a supershot run at that same final current without ramp-down. However, since the final current was generally low, the global confinement in constant-current discharges probably suffered from considerable losses of energetic beam ions on unconfined orbits. The maximum absolute confinement times in high-li plasmas were similar to those in good supershots, but because the current at which that confinement occurred was much lower, very large enhancements of the confinement relative to L-mode scaling  were achieved.
Confinement in the ERS mode in TFTR was significantly different from other modes of operation, including the reversed-shear mode from which it spontaneously developed. Following the ERS transition, the profiles changed dramatically with the development of extremely steep gradients in the density profile and, particularly, the electron temperature profile at approximately the minor radius of the magnetic surface of minimum safety factor q (Bell et al., 1999). In the region of the extreme temperature gradient, the inferred ion thermal diffusivity decreased to approximately the level of neoclassical transport, suggesting a complete suppression of fluctuation-driven transport. Efthimion et al. (1999) investigated the radial diffusion of tritium, helium, and carbon ions in RS and ERS plasmas. All the ion species exhibited very low diffusivities approaching the neoclassical level within the region of reversed shear, although the diffusivities exceeded neoclassical outside this.
6.4.1.3. Role of turbulent fluctuations
Turbulent fluctuations and their relationship to plasma transport were investigated extensively in TFTR using several diagnostics that provided complementary but somewhat overlapping data from different regions of the plasma and of the fluctuation spectrum S(kr,kθ,ω) where kr, kθ are the radial and poloidal wave numbers and ω the frequency. The frequency range of the turbulent fluctuations covered by these diagnostics was typically f = 10 kHz − 1 MHz. A considerable body of literature was published on the capabilities of these diagnostics and their results. Only a summary of the results can be given here.
The 60 GHz X-mode microwave scattering system (Bretz et al., 1988) measured the fluctuation spectrum in the range 2.0 ≤ kθ ≤ 25 cm−1, corresponding to 0.5 ≤ k⊥ρi ≤ 10 for ion sound-speed gyro-radii ρi ∼ 0.3 cm typical for TFTR plasmas. In ohmically heated and NBI-heated L-mode and supershot plasmas, the spectrum of density fluctuations in the core, r/a ≈ 0.3, showed a monotonic fall-off, roughly as  for 2.0 ≤ kθ ≤ 10 cm−1 (Bretz et al., 1990), suggesting a common mechanism. The total fluctuation level
  was typically 0.1–1%. In steady-state L-mode plasmas, the measured level of fluctuations in both the edge and the core increased (Paul et al., 1992a) as the global confinement time of the plasma decreased in response to changing the plasma current or NBI power.
The beam emission spectroscopy (BES) diagnostic provided a two-dimensional view of the density fluctuations  for frequencies f to 250 kHz on 20 channels separated by 1.5–2.0 cm in the (R, Z) plane simultaneously (Durst et al., 1992; Fonck et al., 1990; Paul et al., 1992b). The wave number spectra for 0 < k⊥ < 2 cm−1 were derived from the dependence of the two-point correlations of the fluctuations as a function of radial and vertical (ie, poloidal) separation. The fluctuations measured by BES were very large at the plasma outer edge, approaching
  , decreased by about an order of magnitude 5 cm inward from the edge then decreased more slowly to
  toward the core, as seen in Fig. 6.5 (Fonck et al., 1993). The edge fluctuations measured by BES were uncorrelated and spectrally distinct from those in the core (Durst et al., 1993).

Figure 6.5 Radial profile of the total r.m.s. density fluctuation amplitude measured by BES for a TFTR supershot with 9 MW of NBI.
In MHD-quiescent deuterium NBI-heated supershots, a robust feature of the spectra throughout the confinement zone (ie, inside the region of strong edge turbulence) was that S(kr) peaked at kr = 0 and monotonically decreased for kr ≈ 0 → 2 cm−1 but S(kθ) peaked at kθ ≈ 1 − 2 cm−1 (kθρi ≈ 0.5) and approached 0 as kθ → 0 (Fonck et al., 1993). This is shown in Fig. 6.6. In the local plasma rest frame, the core fluctuations were propagating poloidally in the ion diamagnetic drift direction. There was a remarkable quantitative agreement between the radial profiles of the ion thermal diffusivity inferred from the power balance and estimates from the fluctuation data. As the toroidal rotation of the plasma was varied by changing the co-/counter- balance of the NBI heating, the frequency and wave number spectra of the fluctuations changed reflecting the variation in the plasma confinement time. A bispectral analysis of the data revealed that the modes at the peak of the kθ-spectrum were in fact stable and that energy was flowing into that spectral region from both higher and lower kθ (Fonck et al., 1994; Kim et al., 1997).
The 110–140 GHz X-mode reflectometer measured the correlation between density fluctuations at neighboring X-mode cutoff layers to yield the amplitude and radial correlation length of the density fluctuations (Mazzucato and Nazikian, 1991, 1993). In a scan of the neutral beam power from 0 to 14 MW, the radial correlation length of density fluctuations at r/a ≈ 0.3 on the plasma midplane decreased Lr = (4 → 2) cm and the total fluctuation level there increased  . These results were inconsistent with the mixing length model that predicts
  where Ln is the scale length of the density profile, which varied very little in the scan.
A striking example of a change in the fluctuation level accompanying a change in plasma confinement was observed by the reflectometer in RS discharges, which underwent a transition to the enhanced mode (ERS) of confinement and developed a strong transport barrier (Mazzucato et al., 1996a,b). In the RS phase prior to ERS transition and if the plasma remained in RS mode, the coherent reflected signal disappeared and the signal developed a structure of large, chaotic bursts. Following the ERS transition, however, there was an almost complete suppression of these bursting fluctuations within RS region in core. The level of fluctuations dropped to  within the barrier, rising outside it to the more usual level of ∼10−2 (Fig. 6.7). When the plasma rotation was changed, by altering the co-/counter- NBI balance, to provoke a “back transition” out of the ERS mode, the large fluctuations reappeared in the reflectometer signals as the particle diffusivity returned to its pre-ERS level (Fig. 6.8). These observations were interpreted within, and indeed provided strong support for, the paradigm of transport barrier formation through suppression of turbulence by strongly sheared plasma flows (Beer et al., 1997; Synakowski et al., 1997) reinforced by a positive feedback mechanism in which the increasing central pressure increased the stabilization through the influence of the ∇p term in the momentum balance equation.
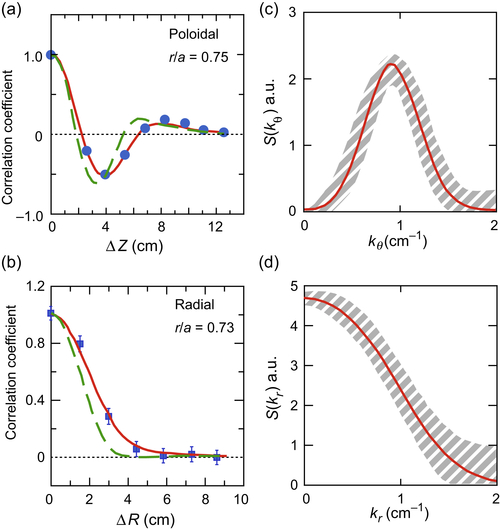
Figure 6.6 Left: Spatial correlation functions for displacements between observation points in the poloidal (a) and radial (b) directions. Points and solid lines are measurements, dashed lines are with the spatial instrument function deconvolved. Right: Corresponding poloidal (c) and radial (d) spatial wave number spectra obtained from the correlation functions. Shaded regions indicate effect of varying instrument functions within 10% confidence level. Data are for a TFTR supershot with 14 MW of NBI heating.
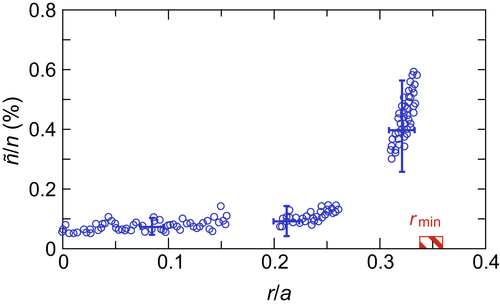
Figure 6.7 Radial profile of the density fluctuation level measured by reflectometry in the core of a TFTR plasma in the ERS mode. The radius rmin of the surface of minimum q determined by MSE measurements is shown.

Figure 6.8 Time evolution of the density fluctuation level in the core of two discharges during “forward” transitions into and “back” transitions out of the TFTR ERS mode. The reappearance of fluctuations during the back transition is accompanied by a dramatic rise in the electron diffusivity in the core inferred from the evolution of the density profile.
A high-throughput charge exchange recombination spectrometer (HF-CHERS) measured high-frequency fluctuations (up to 150 kHz) in the carbon-ion temperature (Evensen et al., 1995). The fluctuations in  had a similar radial profile to the density fluctuations with
  (Evensen, 1998), which is similar to the parameter ηi (characterizing stability to ITG modes) in the core confinement region. Thus these observations are consistent with the dominant turbulence in the confinement region being dominated by ion rather than electron modes.
6.4.1.4. Heat pulse propagation and perturbative transport studies
Using the high time-resolution Te(r,t) data, it was discovered that there was a very rapid radial propagation of the temperature pulse immediately following the sawtooth crash, which extended well beyond the sawtooth mixing radius (Fredrickson et al., 1991, 1993b, 2000). This phenomenon, which was dubbed “ballistic,” occurred on a timescale <50 μs. Outside this ballistic region, the heat pulse evolved diffusively but the corresponding diffusivity  was about six times that inferred from the power balance,
  . A complementary study of the propagation into L-mode plasmas of “cold” pulses produced at the edge by injection of small amounts of helium or iron had shown a similar result
  (Kissick et al., 1994). High time-resolution measurements of the ion temperature perturbation produced by a sawtooth showed
  , which was close to the ion thermal diffusivity obtained from the power balance
  (Evensen et al., 1999). Both the particle diffusivity and the momentum diffusivity following the sawtooth were also much smaller than the electron thermal diffusivity . These results suggest that the electron transport in the plasma core following the sawtooth relaxations is being affected by weak magnetic stochasticity engendered by the sawtooth reconnection.
Zarnstorff et al. (1990) investigated the response of L-mode plasmas to ramping the plasma current down or up during NBI heating and comparing the resulting plasma to constant current discharges at the initial or final current. The current ramp strongly modified the current profile in the outer region r > a/2, thereby decoupling some dimensionless parameters of the equilibrium, such as the q-profile and the magnetic shear, which were linked in steady state. The electron and ion temperature profiles and the inferred thermal diffusivities χe, χi were essentially unaffected for r > a/2, as was the global energy confinement time, until the current profile perturbation reached the plasma core. The fluctuations in the plasma core measured by the microwave scattering system were also unchanged until the current perturbation penetrated to the center when the core fluctuations rose (Bretz et al., 1992).
The response of supershots to perturbations of the density profile was studied using gas puffs and the injection of deuterium pellets (Efthimion et al., 1991a,b; Zarnstorff et al., 1990). Changing the ITG stability parameter ηi at r/a = 0.67 from ∼2 to >5 for 35 ms did not change the ion heat flux despite predictions of the then-prevailing linear theory that the ITG mode would be unstable. This indicated that a nonlinear treatment of such modes and the inclusion of toroidal, kinetic, and, ultimately, flow-shear effects would be needed for ITG turbulence to explain the results. Kissick et al. (1993) also used the perturbations produced by small helium puffs to demonstrate the dominance of convective transport in the ion energy balance within the core (r/a < 0.4) of supershots.
6.4.2. Neoclassical resistivity, bootstrap current, and noninductive sustainment
The evolution of the electron temperature and toroidal current profiles in TFTR during current ramps applied to equilibrated ohmically heated plasmas were found to be consistent with neoclassical resistivity (Fredrickson et al., 1987). However, in these low-beta plasmas, the contribution of the postulated (Bickerton et al., 1971) “bootstrap” current was small, and this element of neoclassical theory could not be tested.
The early TFTR supershots at relatively low current (<1 MA), which achieved both higher poloidal beta and lower collisionality than L-mode plasmas, provided an excellent opportunity for observing the bootstrap current in tokamak plasmas. Zarnstorff et al. (1988b) and Scott et al. (1988) found that it was necessary to include both the calculated bootstrap current and the current carried directly by the circulating supra-thermal beam-injected ions to reproduce with the TRANSP analysis code the evolution of the measured toroidal loop voltage. The ability to inject beams both co- and counter- parallel to the plasma current enabled the contribution of the beam-driven current to be studied separately from the bootstrap current.
6.4.3. Fast-ion confinement and thermalization
The radial transport of the energetic ions created by the NBI heating was investigated in TFTR using a variety of techniques (Scott et al., 1990 and references therein). These included charge exchange neutral spectrometry of the ion slowing-down distribution, the decay of the D-D neutron rate following a brief pulse of D-NBI, measurements of the 14 MeV neutrons produced by D-T fusion of the tritons produced by D-D reactions (Strachan et al., 1996), and measurements of the flux of energetic charged fusion products (1 MeV tritons and 3 MeV protons) escaping from the plasma. All these measurements pointed to a very low upper bound on the radial diffusivity of the supra-thermal  ions, with an upper bound Dfast < χi/6, in MHD-quiescent plasmas. This behavior was noted to be consistent with so-called “orbit averaging” reducing the ion transport caused by turbulent fluctuations with a spatial scale smaller than the characteristic ion gyroradius.
6.4.4. ICRF physics
Strong, fundamental absorption of the ICRF power in deuterium plasmas was achieved by introducing a minority ion species, usually either 1H or 3He at concentrations typically 1–10%. The resonant minority ions were accelerated to energies as high as several MeV, well above the critical energy, so the RF power was transferred by Coulomb collisions mainly to the electrons.
Minority-ion coupling was used to heat deuterium supershots produced by NBI. An increase of the central electron temperature by ∼3.5 to 12.5 keV was produced by 5.8 MW of ICRF power added to a supershot with about 23 MW of NBI and with a 3He minority present (Taylor et al., 1994). Substituting for the ICRF power, an equivalent amount of additional NBI power produced only about half of the increase in the electron temperature generated by the ICRF heating (Wilson et al., 1992).
The energetic minority ions produced by ICRF heating served to simulate in majority deuterium plasmas, the behavior of fusion alpha particles in D-T plasmas. The energetic ions affected the behavior of sawteeth (Hosea et al., 1990), significantly increasing the sawtooth period and the magnitude of the eventual temperature crash, as observed in JET with ICRF heating (Porcelli et al., 1990). Several types of instabilities in the Alfvén range of frequencies were excited by the energetic ions during minority-ion heating (Wong et al., 1994). At high ICRF power, energetic particle modes (EPMs) were observed in which the characteristics of the modes were no longer determined by the thermal plasma but were significantly affected by and, in turn, affected the energetic ion population itself (Bernabei et al., 1997).
For sufficiently high ion temperature in the plasmas, absorption of the ICRF waves was obtained at the second harmonic of the majority plasma ion species. In deuterium plasmas, the second-harmonic resonance coincided with the fundamental hydrogen resonance so it was necessary to maintain a very low hydrogen concentration in order to observe second-harmonic heating.
Observations of second-harmonic ICRF heating were made in D-T plasmas. In the first experiments (Phillips et al., 1995; Wilson et al., 1995), the second-harmonic absorption was augmented by the fact that the 3T was introduced by NBI at relatively high energy (∼100 keV), but both minority ion coupling to residual 3He and direct electron heating also played a significant role. Later experiments (Rogers et al., 1996) showed that second-harmonic 3T heating was also effective in plasmas with roughly equal D and T concentrations produced by gas puffing and without any 3He minority present.
By moving competing ion resonances from the center of the plasma, it was possible to produce direct heating of the electrons by transit-time magnetic pumping and electron Landau damping of the ICRF waves. By utilizing modulation of the RF power, localized direct heating of electrons was measured in the core of a deuterium plasma preheated by about 20 MW of NBI (Wilson et al., 1992). Analysis of the power balance showed that up to 80% of the ICRF power was absorbed on the electrons. Direct electron heating was later applied to TFTR deuterium discharges with D-NBI heating in the ERS mode (Rogers et al., 1996). With 2 MW of ICRF power, the electron temperature within the transport barrier increased by ∼1.5 keV and the “back transition” out of the ERS mode was delayed by about 0.1 s.
An efficient method for converting the fast magnetosonic waves launched by the conventional ICRF antenna system into IBW at the ion–ion hybrid resonance layer in mixed species plasmas was proposed by Majeski et al. (1994a). IBW heating was tested in TFTR initially using plasmas containing 2D-4He-3He and later in 2D-3T-3He plasmas (Majeski et al., 1994b; Wilson et al., 1998). Current drive by the mode-converted IBW, which are strongly damped on the electrons, was investigated by operating two of the fast-wave antennas with 90° phase difference between the currents in the adjacent straps to launch a spectrum of waves directed either co-parallel or counter-parallel to the plasma current (Majeski et al., 1996). With 3.4 MW of RF power, a driven current of about 80 kA was inferred from the difference in loop voltage between the two wave directions.
The ICRF antenna with four toroidally directed current straps (ERF||B) designed for “direct” launch of the IBW was only used in 1997 at the end of TFTR operation (Hosea et al., 1997; Wilson et al., 1998). The launched ICRF power reached 1.2 MW but the coupled IBW power was substantially less. Electron responses were observed for IBW absorption at the third harmonic 2D layer (B = 2.2 T, f = 50.7 MHz) (Majeski et al., 1997; Phillips et al., 2000; Rogers et al., 1997).
The absorption of the IBW was expected to generate localized flow in the plasma. Changes in the poloidal rotation of order ±2 km/s and the creation of regions of sheared poloidal flow were observed with as little as 0.4 MW of ICRF power launched by the antenna. The flow shear was produced around the locations of the fifth harmonic 3T and the third harmonic 2D resonances where IBW deposition was expected to occur (LeBlanc et al., 1999).
6.4.5. Stability and other operational limits
6.4.5.1. Density
The density limit was investigated in TFTR using both gas and pellet fueling (Bell et al., 1992). With deuterium gas fueling, it proved difficult to exceed the Greenwald density limit (Greenwald et al., 1988), but whereas in ohmically heated plasmas reaching the limit provoked disruptions, in plasmas heated by NBI, the probability of disruption remained low (<10%) at the highest densities, which were instead limited by the low-fueling efficiency, less than 10%, and the rate at which fuel could be supplied. With deuterium pellet fueling, however, the Greenwald limit was exceeded without provoking a disruption by a factor 1.5 in ohmically heated plasmas and by up to a factor 2.2 with NBI heating. With multiple pellet fueling, it proved possible to achieve a peaked density profile with a central electron density of 6 × 10²⁰ m−3. Even when the pellets did not penetrate to the center and created a mildly hollow profile immediately after injection, peaked density profiles subsequently developed on a timescale of order 0.1 s. This is seen in Fig. 6.9.
6.4.5.2. Current
The useful maximum current in TFTR was set by the available flux swing provided by the ohmic heating windings and the minimum edge safety factor qa for operating with a low risk of a major disruption. A plasma current of 3.0 MA was reached transiently in TFTR while 2.8 MA was maintained for 0.8 s. While discharges with qa as low as 2.2 were achieved, discharges with qa below 2.5 were increasingly prone to disruption and were rarely attempted.
6.4.5.3. Beta
The fusion performance in TFTR was limited by disruptions that appeared to result from pressure-driven MHD instabilities. For supershots at high magnetic field with highly peaked pressure profiles, the achievable normalized beta (Troyon et al., 1984), βN = βaBT/Ip with  , was lower, typically ∼2%.m.T/MA, than for broad pressure profiles. However, since the local D-T fusion rate varies approximately as the plasma pressure squared, a more relevant definition of β for optimizing the fusion performance of D-T plasmas is
  , where
  is the square root of the volume-averaged square of the plasma pressure. In terms of this fusion-relevant parameter, supershots achieved similar or greater values of the corresponding normalized beta
  as H-mode plasmas that have broad pressure profiles but lower central pressure.

Figure 6.9 Evolution of the density profile during a six-pellet sequence. The inset shows the evolution of the total electron content of the plasma. The plasma remained above the Greenwald density limit from 2.8 to 4.5 s. Discharge parameters: R = 2.37 m, a = 0.72 m, BT = 5.0 T, Ip = 1.8 MA (TFTR shot 44,961).
As noted in Section 6.3.2.4, much higher values of the normalized beta, up to 4.5%.m.T/MA, were achieved in the high-li regime, despite the pressure profiles in this regime being very similar to those in supershots at constant current (Kesner et al., 1993). However, in the RS and ERS regimes, the β-limit was significantly lower (Bell et al., 1997; Fredrickson et al., 1997).
Optimizing the fusion performance in TFTR required balancing the need for high confinement, which improved with peaking of the density profile, and ensuring an adequate β-limit, which was degraded by peaking the pressure profile. This became a critical issue for planning and executing the D-T experiments, which often required maintaining high-fusion performance for long enough to build up the population of alpha particles while avoiding disruptions.
Kink/ballooning mode
The first experimental identification of the pressure-driven ballooning mode was made in TFTR (Nagayama et al., 1992, 1993). This discovery was made possible by the extensive diagnostics providing profile information with microsecond time resolution and synchronism. Fredrickson et al. (1996) examined the phenomenology and role of these ballooning modes for a range of operating modes in TFTR. The two ECE polychromators revealed the toroidal rotation and growth of the high-n ballooning mode following the much slower development of an internal n = 1 kink in the core of high-β plasmas. As seen in Fig. 6.10, the ballooning perturbation was toroidally localized to the region where the n = 1 kink protruded outward in major radius. The explosive growth of ballooning modes precipitated disruptions and limited the β achievable in supershots at high-toroidal field.

Figure 6.10 Contours of constant electron temperature across the plasma midplane versus time showing the development of the ballooning perturbation where the n = 1 mode (detected by a Mirnov coil at the edge) pushes out in major radius. Data are from the two GPCs, separated by 126° in the toroidal direction. Discharge parameters: R = 2.52 m, a = 0.87 m, BT = 5.1 T, Ip = 1.8 MA, βN = 1.9%.m.T/MA.
Neoclassical tearing modes
Chang et al. (1994) investigated the growth of tearing (nonideal) MHD instabilities, typically with mode numbers (m,n) = (3,2), (4,3), (5,4) during NBI heating. Usually only a single helicity mode was identified in a particular discharge. Interestingly, the (m,n) = (2,1) mode was infrequently observed in TFTR. Chang et al. (1995) identified these as neoclassical tearing modes (NTMs), ie, modes destabilized by the perturbation to the bootstrap current produced by the island itself in an equilibrium otherwise stable to tearing instabilities. However, the trigger for the growth of the NTM island in TFTR was not identified. Since sawteeth were suppressed in supershots, they could not be implicated in the triggering of the NTMs. In plasmas with detectable tearing activity, the inferred size of the island was found to correlate with the degradation of the stored energy and fusion neutron rate, although confinement degradation was also observed in discharges without MHD activity.
6.4.5.4. Wall interactions
As described in Section 6.3, confinement in the TFTR supershots was extremely sensitive to the influx of cold atoms at the plasma edge. It was necessary to deplete the inner limiter surface of adsorbed hydrogen isotopes, much of which was probably bound in layers of redeposited carbon on the surface of the graphite tiles. These redeposited layers may have had poor or intermittent thermal contact with the bulk graphite so that during intense NBI heating, they were heated to the point where they became sources of hydrogen and carbon rather than sinks for ions escaping from the plasma. While the limitation on plasma performance due to massive carbon influxes was reduced following the final mechanical realignment of the limiter, the interaction of the plasma with the limiter remained an issue for high-performance operation.
Strachan et al. (1999) studied a large database of TFTR discharges and concluded that the “rollover” in plasma stored energy and fusion rate in both D-only and D-T plasmas, which often occurred in the later period of a high-power NBI pulse (typically after about 0.5 s of heating) correlated well with an increase in the levels of line emission from both deuterium and singly ionized carbon ions. This correlation was independent of whether MHD activity was present, including the NTM activity described before. The degradation accompanying the rise in the edge influx was consistent both with the heuristic model describing supershot confinement in terms of the peaking of the beam fueling and the model based on transport driven by ITG modes since the influx at the plasma edge depressed the plasma temperature there, leading to reduction in the ion temperature throughout the plasma.
6.4.5.5. Disruptions and their avoidance
Disruptions in TFTR occurred for a variety of reasons, including exceeding the density, current or beta limits, the development of nonrotating (“locked”) MHD modes, and rapid impurity influxes caused by localized interactions with the limiter or other PFCs (Mueller et al., 1996). Sometimes, more than one cause contributed to a disruption. Major disruptions not only terminated the discharge involved but also affected subsequent discharges by “deconditioning” the limiter surface. The most extreme example of this occurred during the experiment to maximize the D-T fusion power in 1994 when the disruption of a 2.5 MA plasma with a thermal stored energy of 6.5 MJ required two days of intensive conditioning of the limiter to recover satisfactory supershot performance.
In the low-density ohmically heated phase of supershots prior to the NBI pulse, locked modes tended to develop at rational values of the edge q, particularly integers and half-integers in the range 3.0–4.5. These modes could then persist through the current flattop period and eventually trigger a disruption. Large-amplitude locked modes caused a helical pattern of increased heat deposition on the IBL (Janos et al., 1992), precipitating subsequent impurity influxes. These were avoided by tailoring the evolution of the plasma equilibrium to cross through the troublesome q values early in the current ramp-up.
Fredrickson et al. (1993a) showed that disruptions occurring at the density limit in TFTR initially involved a collapse of the electron temperature at the edge. This was followed by the growth of an (m,n) = (1,1) kink mode and the ingestion of a poloidally nonsymmetric “bubble” of cold plasma into the core. There was then a collapse of the electron temperature to a flat profile extending out to roughly the q = 3 surface. If the kink mode was external, its growth was rapid and disruption was inevitable. However, if the kink mode was internal and the edge temperature was not too low, the discharge could recover.
At high field and current in TFTR, the β-limit disruption occurred in three stages (Fredrickson et al., 1995). In the first, low (m,n) global modes grew at rates 103–104 s−1 triggering, in some cases, moderate n (10–20) ballooning modes. This produced a rapid collapse of the electron temperature and a partial quench of ion energy. During the second stage, locked modes often developed. Impurities, resulting from the heat deposition on the limiter, entered the plasma and began to cool it. The second stage ended in a global reconnection of magnetic flux possibly involving an (m,n) = (1,1) internal kink, as in the high-density disruption. This led to a complete thermal energy quench, followed, in the third stage, by a final, slower current decay.
By contrast, at low toroidal field (2 T), the approach to the β-limit was characterized by the growth of locked modes. Above βN = 2.3 (%.m.T/MA) (higher than was obtained at high field) a locked mode would appear and grow through the beam phase. The plasma then typically disrupted after the end of NBI. Thus, there appear to be differences, both qualitative and quantitative (in particular, the apparent variation in the βN limit) between the disruption characteristics observed at low- and high-magnetic fields in TFTR (Fredrickson et al., 2015).
Although β-limit disruptions were rare in most operations of TFTR they were difficult to avoid altogether in high-performance supershots. Some success was achieved by implementing a system to control in real time the NBI power to maintain βN below a preset limit (Mueller et al., 1996). This system was only used, however, in experiments that did not require the maximum performance. Because the β limit is determined by the local pressure gradient exceeding a stability boundary, the peaking of the pressure profile in the highest-performing supershots lowered the global β limit significantly. Thus, a successful strategy to avoid β-limit disruptions by reducing the heating power would require a real-time estimate of the stability boundary and its projected evolution.
6.5. Results from the D-T experiments in TFTR
Many of the scientific and technical results from the D-T experiments both in TFTR and subsequently conducted in JET have been described in two reviews by Hawryluk (1998b, 1999) to which the reader is referred for additional material.
Prior to the start of D-T operation, simulations were performed of the fusion performance and alpha particle population expected to be produced (Budny, 1994; Strachan et al., 1993) based on the plasma parameters in previous D-only discharges but substituting tritium for deuterium in some of the NBI sources. They showed that for studying the physics of alpha particles, the most favorable conditions would be obtained in supershots, and other TFTR-enhanced confinement regimes, provided that the conditions could be maintained long enough to approach equilibrium.
The first D-T experiments aimed to produce a significant amount of D-T fusion power, ∼5 MW, and to conduct an initial exploration of the confinement of the fusion alpha particles. Within two days of operation, a discharge producing 6.2 MW of fusion power had been achieved, the losses of energetic alpha particles born on unconfined orbits had been studied as a function of plasma current, and a preliminary assessment had been made of the confinement of plasmas with varying mixtures of tritium and deuterium (Hawryluk et al., 1994a,b; Strachan et al., 1994; Zweben et al., 1994).
6.5.1. Fusion power optimization
In 1994, two campaigns were made to maximize the fusion power from TFTR. The first of these campaigns achieved a peak fusion power of 9.3 MW from a plasma with total NBI power of 34 MW (20 MW T-NBI) (Bell et al., 1994). Both the fusion power and stored energy (6.5 MJ) were still rising when the plasma underwent a very rapid disruption. In this discharge, the total energy confinement time deduced from magnetic measurements (ie, including the energy in unthermalized energetic ions) immediately before the disruption was 0.24 s, which was 2.5 times the prediction of the ITER-89 power law scaling (Yushmanov et al., 1990).
In the second campaign, the toroidal magnetic field was increased for a limited number of pulses in order to reduce the normalized beta and avoid potential pressure-driven MHD instabilities. A peak fusion power of 10.7 MW was reached in a discharge with plasma current of 2.7 MA, toroidal field 5.5 T, and a total neutral beam power of 39.5 MW (25 MW T-NBI) (Bell et al., 1995; McGuire et al., 1995). This shot also suffered an adverse event after 0.45 s of heating, precipitated by an influx of carbon from the limiter, but the plasma current was not disrupted. By design, this discharge relied on higher NBI power rather than improved confinement to reach the stored energy, 7 MJ, needed to produce the fusion power goal; at the time of peak fusion power, the confinement time was 0.18 s, about twice the ITER-89P scaling prediction. Waveforms for the TFTR shots producing the highest fusion power are shown in Fig. 6.11. Fusion power up to 8.7 MW was also produced in the high-li regime (Sabbagh et al., 1994, 1996) but at lower plasma current than in standard supershots.
6.5.2. Isotopic effects on confinement
6.5.2.1. Energy confinement
The initial TFTR D-T experiments in the supershot regime clearly indicated an increase of up to 20% in the global energy confinement time τE and an increase in the central ion temperature by up to 25% for a 50:50 D-T plasma compared to a D-only plasma under identical external conditions (R, a, BT, Ip, PNB) (Hawryluk et al., 1994a,b). For higher heating power, 60–80% of the increase in Wtot between D and D-T plasmas was due to changes in the thermal plasma. The effective ion thermal diffusivity, χi,tot (including both the conductive and convective fluxes) decreased throughout the region r/a ≤ 0.75 in a D-T plasma relative to a D-only plasma (Scott et al., 1995, 1996a).

Figure 6.11 Evolution of the NBI power, plasma stored energy and fusion power for the four discharges producing the highest power in TFTR. All had major radius 2.52 m and minor radius 0.87 m. For the three nondisruptive shots, the toroidal magnetic field was 5.5 T and plasma current 2.7 MA. For the shot that reached the β-limit and disrupted, the toroidal magnetic field was 5.1 T and the plasma current 2.5 MA.
At fixed Ti, χi,tot∝ was obtained, so the observed scaling cannot be explained by a simple dependence on Ti/Te or by the correlation χi,tot∝
 previously observed in the D-only supershots (see Section 6.4). When that temperature correlation is included, the results imply that roughly
  (at fixed B) in contrast to a gyro-Bohm dependence (Zarnstorff et al., 1994). In both supershots (Synakowski et al., 1995a) and L-mode plasmas (Scott et al., 1996b), matched density and temperature profiles were obtained by injection of ∼25% less NBI power in D-T than in D plasmas. Thus, although the plasmas have the same β and
  , the D-T plasmas have higher confinement despite having a larger ρ∗ as a result of the larger average ion mass. This is shown in Fig. 6.12 for L-mode discharges. This trend is opposite to that occurring in D plasmas when ρ∗ was changed by varying the B field and suggests that in tokamaks, the behavior of plasma transport is more complex than can be encapsulated by a simple power law involving basic dimensionless parameters.

Figure 6.12 Kinetic profiles in D (dashed) and D-T (lines with dots) L-mode plasmas matched in density, temperature, β, ν∗, BT, Ip, Zeff. Contrary to expectations for gyro-Bohm scaling, the D plasma with smaller ρ∗ requires ∼30% more heating power to achieve the same parameters. The alpha particle heating power was not significant in the D-T L-mode.
The BES data indicated a slight reduction in the level of density fluctuations across the core region of a D-T supershot compared to a similar D-only plasma (Fonck et al., 1994). However, the reflectometer data showed essentially no difference between otherwise similar D-T and D-only supershots in either the total fluctuation level or the correlation decay length (Mazzucato et al., 1995).
By utilizing H-minority ICRF heating only in plasmas with different fractions of D and T, it was possible to investigate the intrinsic scaling of confinement with the mass, or equivalently the normalized gyroradius, of the majority ion species without the fueling and momentum input that accompany NBI heating (Phillips et al., 1997). Since the heated H-minority ions transferred their energy predominantly to the electrons, the heating profile was essentially independent of the majority ion mass. It was found that the confinement showed a positive scaling with average isotopic mass, τE∝A(0.35–0.5).
In both the high-li and H-mode discharges in TFTR, the global energy confinement was also higher in D-T plasmas than in comparable D-only plasmas. After the H-mode transition in a D-T plasma, but prior to the onset of ELMs (which were larger in the D-T plasma), the energy confinement was enhanced by a factor of up to four relative to the predictions of the ITER-89P scaling. Fig. 6.13 shows that the inferred ion thermal diffusivity was lower by almost an order of magnitude in the outer half of the radial profile in a D-T H-mode plasma compared to its D-only counterpart. These results stand in sharp contrast to those reported for H-mode D-T plasmas in JET (Cordey et al., 1999).
In the TFTR reversed-shear discharges, however, there appeared to be little difference in the confinement between discharges with D-only and T-only NBI heating (Scott et al., 1996b). Although the confinement in reversed-shear plasmas was essentially unchanged by introducing tritium NBI, it was found that the threshold NBI power for the formation of the localized internal transport barrier of the enhanced reversed-shear regime increased with the fraction of NBI power in tritium (Bell et al., 1997).

6.5.2.2. Particle confinement
The large cross section for the D-T fusion reaction and the absence of tritium recycling from the limiter in the early D-T experiments made it possible to determine the radial profiles of both an effective particle diffusivity and a radial convective velocity for tritium ions introduced by a brief gas puff (Efthimion et al., 1994, 1995; Johnson et al., 1994). The particle diffusivity of the tritium was comparable to both the electron particle and the deuterium ion thermal diffusivities, as seen in Fig. 6.14.
In the reversed-shear regime, by contrast, the tritium profile remained hollow for >0.15 s following a tritium gas puff, and the inferred tritium ion diffusivity showed a drop by almost an order of magnitude from just outside the surface of minimum q to inside it. Within this particle transport barrier, the tritium ion diffusivity approached the calculated neoclassical transport level, confirming the results from helium puffs described in Section 6.4.
6.5.2.3. Fast-ion confinement
Making use again of the dominance of the D-T fusion reaction and the absence of tritium recycling, the confinement of the energetic ions produced by brief pulses of T-NBI was investigated (Ruskov et al., 1995). In most cases, the time evolution of the 14 MeV neutron emission was consistent with the fast tritons being well confined and subject to a negligibly small radial diffusivity, Df,T < 0.2 m2/s. An exception to this occurred in some discharges run at large major radius where the outer part of the plasma entered the region of higher intrinsic ripple in the toroidal field where the fast-ion orbits suffered stochastic diffusion. There was also evidence for enhanced losses of NBI ions from reversed-shear discharges in TFTR (Ruskov et al., 1999).

6.5.3. Alpha particle confinement and thermalization
Assessing the confinement of the fusion alpha particles was approached from two directions. First, the losses of the energetic alpha particles were measured and, second, measurements were made of the confined alpha particles. Only a summary of these results is given here and the reader is referred to the comprehensive review of these topics by Zweben et al. (2000) for more detailed discussion.
For the supershots (with monotonic q-profiles) initially studied, the flux of alpha particles to the lost-alpha scintillator detector located 90° below the midplane (ie, in the direction of the ion ∇B drift) normalized to the total alpha particle birth rate showed the theoretically expected dependence on plasma current and pitch-angle distribution for the prompt (ie, “first-orbit”) losses of those alphas born onto trapped orbits (Zweben et al., 1995). This is shown in Figs. 6.15 and 6.16. In supershots free of significant MHD activity, there was no evidence for an increasing rate of alpha particle loss with time during the heating pulse or with increasing fusion power that might have indicated the development of an alpha-driven instability. Absolute measurements of the alpha particle flux time-integrated during a low current discharge to a foil collector probe, also located 90° below the midplane, agreed with theoretical calculations of the escaping alphas (Herrmann et al., 1996).
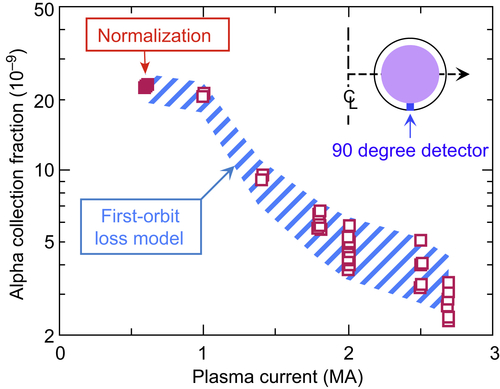
Figure 6.15 Fraction of alpha particles collected by a detector located near the bottom of the vessel (90 degree). The decrease in loss with increasing current is in good agreement with the predictions of the first-orbit loss model. The data are normalized at low current where all trapped alphas are expected to be lost.
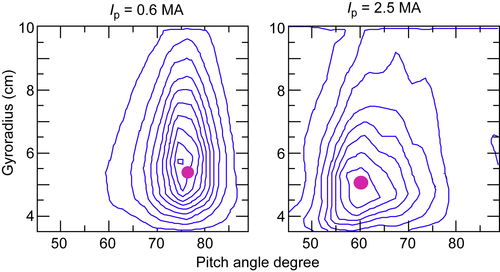
Figure 6.16 Time-averaged contours of alpha loss rate versus pitch angle and gyroradius as measured by the 90 degree scintillator detector in TFTR. At both low- and high-plasma currents the peaks of the data are consistent with the expected peak for first-orbit loss of 3.5 MeV alphas shown by the magenta points. The widths of the pitch angle distributions are consistent with expectations; the widths of the gyroradius distributions are dominated by the instrumental width but are also consistent with 3.5 ± 1 MeV alphas.
The lost-alpha detectors nearer the midplane revealed information about alpha particles whose orbits were affected by the ripple in the toroidal magnetic field (Darrow et al., 1996), both through intrinsic stochastic ripple diffusion (Boivin et al., 1993; White et al., 1996) and by collisional scattering of the alpha particles onto ripple-trapped orbits. The fluxes to these detectors were delayed relative to the prompt first-orbit losses by the time for the alpha particles to undergo pitch-angle scattering.
Although the alpha particle losses from MHD-quiescent supershots were generally consistent with classical orbit theory, additional losses were detected by the lost-alpha detectors during MHD activity (Darrow et al., 1996), including low-(m/n) modes, high-n kinetic ballooning modes (KBMs) (Chang et al., 1996, 1997). During low-(m,n) modes, the alpha particle losses were modulated in synchronism with the magnetic fluctuations detected by Mirnov coils. The MHD activity appeared to cause the redistribution of the originally well-confined alpha particles from the core of the plasma onto orbits subject to prompt or ripple loss (Zweben et al., 1999). Increased alpha particle loss occurred during the Alfvén mode activity excited by ICRF-accelerated ions (Darrow et al., 1997). Rapid loss alpha particles, occurring on a millisecond timescale and estimated to be up to 20% of the unthermalized alphas, were also measured by the lost-alpha particle detector at 90 degree coincident with the thermal quench phase preceding a major disruption (Janos et al., 1996).
The technique of PCX spectrometry revealed information about alpha particles in the energy range 0.5–3.5 MeV for a narrow range of pitch angles with  (ie, slightly counter-going). A relative measurement of the alpha particle energy distribution could be made at one time in a discharge across that part of the profile where the pellet was able to penetrate, generally r/a ≥ 0.2 (Medley et al., 1996). In order to achieve adequate penetration, the pellet was injected after the end of the NBI heating when both the electron temperature had decreased and the population of fast ions from NBI had decayed but before the alpha particles themselves had slowed down.
In MHD-quiescent supershots, the PCX measurements showed that the energy distribution of the confined alpha particles evolved as expected for classical slowing down on the electrons. This is shown in Fig. 6.17. In addition to applying purely classical thermalization, the model applied an adjustable “anomalous” radial diffusivity (uniform in time and space) to the alphas. It can be seen in Fig. 6.18 that the PCX data are consistent with this anomalous diffusivity being <0.03 m2/s, which is more than an order of magnitude less than the typical thermal diffusivity for the thermal plasma ions.
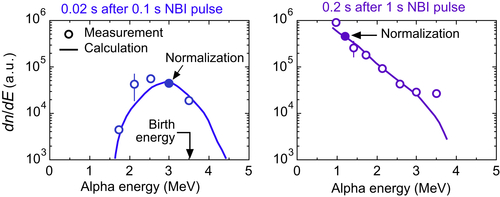
Figure 6.17 PCX measurements of the confined alpha particle energy spectrum in the core (r/a ≈ 0.1) of quiescent D-T supershots after 0.1 and 1.0 s NBI pulses, which are respectively shorter and longer than the alpha particle slowing time. The slowing-down spectra calculated assuming classical processes, which are normalized at the points shown, are in good agreement with the measurements.
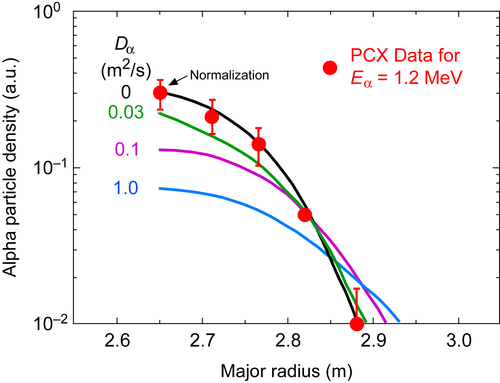
Figure 6.18 PCX measurements of the radial profile of partially slowed, confined alpha particles after 1.0 s of NBI heating in a quiescent D-T supershot compared with TRANSP-FPPT simulations assuming different amounts of anomalous spatial diffusion. The measured profile is consistent with a diffusivity D < 0.03 m2/s, which is comparable to the neoclassical diffusivity, indicating that there is no significant radial transport.
In TFTR discharges with an elevated central q and reversed (negative) magnetic shear near the axis, the PCX data revealed higher losses of the slowing-down alpha particles than in comparable plasma supershots with monotonic shear and q(0) < 1 on axis. These additional losses were attributed to enhanced collisional ripple trapping of the alpha particles due to their larger orbits at higher q(0) (Medley et al., 1998). The redistribution of alpha particles by the magnetic reconnection occurring at a sawtooth crash was also measured (Petrov et al., 1995).
The TFTR alpha-CHERS diagnostic (McKee et al., 1995) made absolute measurements of the alpha particle population at five radial locations as it evolved following the end of the T-NBI heating pulse in a high-power supershot. The measured emission was mainly from passing alpha particles. The data are shown in Fig. 6.19. Fig. 6.20 compares on an absolute scale the measured radial profile of the integrated line brightness with the results of modeling, including variable levels of spatial radial diffusion for the alphas. The modeled radial profiles show best agreement with the data for Dα,anom ≈ 0.03 m2/s (McKee et al., 1997).
Since the alpha particles measured by this diagnostic had slowed down considerably since their birth (although they were not yet fully thermalized), the alpha-CHERS measurements provided, both through their absolute calibration and the observed time evolution of the alpha particle population, confirmation that the supra-thermal alpha particles were well confined in quiescent high-current TFTR supershots.
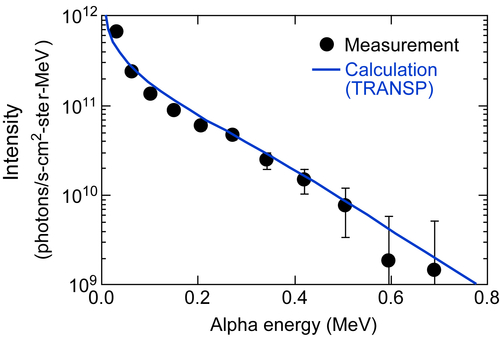
Figure 6.19 Absolutely calibrated spectrum of alpha charge exchange recombination emission at r/a ∼ 0.3 late in the NBI heating of a non-sawtoothing D-T supershot when the alpha particles have approached an equilibrium distribution. The Doppler shift of the HeI line has been converted to alpha particle energy. The data are compared with calculations based on TRANSP modeling of the alpha slowing down.

The alpha-CHERS diagnostic also measured the effect on the alpha particle population of the reconnection occurring during a sawtooth crash (Stratton et al., 1996). A model for the rapid redistribution of the alpha particles by the reconnection event followed by purely diffusive transport was able to reproduce the observed profile evolution for Dα,anom ≈ 0.03 m2/s.
The helium “ash” resulting from the complete thermalization of the fusion alpha particles in D-T plasmas was also measured (Synakowski et al., 1995b) during a 0.7 s “postlude” of D-only NBI following 1.3 s of D (10 MW) and T (12 MW) NBI. Most of the alphas created during the preceding D-T phase were then thermally equilibrated with the bulk ions. The results are shown in Fig. 6.21 where the measurements are compared with modeling by the TRANSP code under various assumptions for the transport of the helium ash. Without invoking transport for the helium similar to that inferred for the thermal plasma, the calculated profile of the helium is much more peaked than the measurement. It was also necessary to include a recycling coefficient of ∼0.8 for the helium at the limiter to obtain satisfactory agreement. The inferred particle confinement time for the helium ash,  , was about 6–10 times the global energy confinement time, which is consistent with the requirements for maintaining fusion burning in a reactor.

Figure 6.21 Measured and modeled ash profile shapes measured 1.95 s after the start of deuterium–tritium beam injection. The errors include uncertainties related to the atomic physics of charge exchange and beam attenuation, as well as photon statistics. The longer dashed line represents the helium–ash profile shape predicted under the assumption of no radial transport of the thermalized ash. The shorter dashed line represents the predicted profile shape including the effects of radial transport and wall recycling.
6.5.4. Alpha heating
In quiescent high-performance D-T discharges in TFTR, the core electron temperature was systematically higher than in D-only plasmas run under the same operating conditions. However, determining whether this was due to heating of the electrons by the fusion alpha particles was difficult for two reasons. First, even in the core of supershots, the alpha heating power could represent only 15% of the total power to the electrons. Second, the strong isotope scaling of the energy confinement with the average isotopic mass of the plasma meant that separating the effects of alpha particle heating from change in confinement would be a challenge. Because of the residual influx of deuterium from the limiter, it was not possible to vary the concentration of tritium in the plasma from 0 to 100% in order distinguish the effects of isotopic scaling from alpha particle heating.
Using the TRANSP code, Taylor et al. (1996) modeled the D-T discharges under different assumptions to assess whether alpha particle heating was occurring. The alpha heating term in the modeled power balance was turned on and off and the electron temperature was calculated assuming that the electron thermal diffusivity profile was either that for a D-only or D-T plasma. Fig. 6.22(a) shows the averaged electron temperature profiles for well-matched sets of D-only and D-T plasmas 0.6 s after the start of neutral beam heating. In Fig. 6.22(b), the magnitude and localization of the measured temperature difference is consistent with that calculated by TRANSP including alpha particle heating of electrons.
Perhaps the strongest direct evidence for alpha heating of the electrons, albeit essentially qualitative, came from what was called the D-T “afterglow” effect in TFTR. When the NBI heating was turned off in plasmas that had built up a substantial population of fusion alpha particles, the electron temperature increased substantially as the source of cold electrons from the ionization of beam neutrals ceased. Despite the relatively rapid decay in the energetic beam-ion population and the ion temperature, the elevated electron temperature persisted for the longer slowing down time for the alpha particles. In comparable D-only plasmas, there was a much smaller initial increase in electron temperature, which decayed very quickly as the thermal ions, from which the electrons received most of their heating power, cooled. Quantitative transport analysis was not possible during this afterglow, however, because with the cessation of the NBI, ion temperatures were no longer available.

Figure 6.22 Radial profiles of (a) Electron temperature 0.6 s after the start of neutral beam injection for six D-T plasmas with PNBI = 24.2 MW producing Pfus = 4.5 MW (solid line) and 17 D plasmas with PNBI = 24.7 MW (dashed line); (b) Electron temperature difference between the D-T and D plasmas compared to the predicted temperature increase due to alpha heating from the time-dependent kinetic code, TRANSP (shaded region).
6.5.5. Alpha-driven instabilities and their effects on alphas
Prior to the advent of D-T operation in tokamaks, there was concern that toroidal eigenmodes of shear Alfvén waves could be excited by the alpha particles (Furth et al., 1990) causing their redistribution within or loss from the plasma. Experiments had been conducted in TFTR to investigate such toroidal Alfvén eigenmodes (TAEs) excited either by the energetic deuterons from D-NBI (Wong et al., 1991) or the trapped energetic ions produced by ICRF heating of minority species (Wong et al., 1994).
In the initial D-T experiments, there was no sign of TAE activity on the magnetic or density-fluctuation diagnostics. The escaping alpha particle detectors also showed no sign of increasing loss rates even at the highest alpha particle pressures achieved. However, it was demonstrated that the threshold in the ICRF power needed to excite measurable TAE activity with RF-accelerated H-minority ions could be reduced by the additional drive provided by the fusion alpha particles in D-T plasmas compared to similar D-only counterparts (Wong et al., 1996).
This lack of TAE alpha-driven activity prompted developments in the theory and, in particular, a better understanding of the damping mechanisms acting on them. In the high-temperature supershots, the theory predicted that Landau damping by both the thermal ions and the unthermalized ions from NBI stabilized the TAEs. Further theoretical development then showed the possibility of exciting “core-localized” (as opposed to global) low-n TAEs in plasmas with elevated q and weak shear in the core (Fu et al., 1995; Spong et al., 1995). However, in the initial experiments with modified q-profiles (Batha et al., 1995), the modes remained elusive.
Finally, in the last year of TFTR operation, what at first appeared to be purely alpha-driven TAEs were observed in TFTR (Nazikian et al., 1997, 1998). The modes were observed following the end of the main NBI heating pulse in discharges with q(0) > 1 and weak central shear. Fig. 6.23 shows the time traces of the NBI power, the Troyon-normalized plasma β, the central βα, and the dominant frequency of magnetic fluctuations for a D-T plasma. Short bursts of activity 50–100 ms in duration are observed with toroidal mode numbers n = 2,3,4.
While some characteristics of the observed fluctuations were consistent with their being alpha-driven TAEs, others were not. These anomalies were subsequently explained (Nazikian et al., 2003) following the observation of “Alfvén cascade” modes, first in JT-60U (Kimura et al., 1998) and later in JET (Sharapov et al., 2002) and the development of their theory (Breizman et al., 2003). The chirping of the fluctuation frequency was a consequence of the slow reduction in the central q from 1.91 to 1.85 as the current profile evolved. Fig. 6.24 shows the time variation of the dominant fluctuation frequencies measured by the reflectometer and the external coils together with the theoretical predictions for the mode frequency. The theory also reproduced the evolution of the mode from initially having an “antiballooning” structure (ie, larger amplitude in the inboard side of the magnetic axis) to a “ballooning” structure as the q-profile changed.
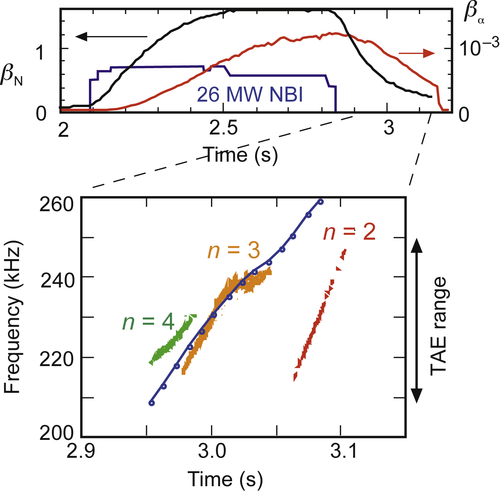
Figure 6.23 Evolution of NBI power, central βα, and Troyon-normalized volume-average plasma β for a D-T discharge (95,796) with elevated central q in which TAEs appear transiently after the termination of NBI. The contour plot of magnetic fluctuation amplitude versus frequency and time shows a succession of modes near the calculated TAE frequency at r/a ≈ 0.3 (solid line). The plasma parameters during the mode activity were: B = 5 T, I = 2.0 MA, R = 2.52 m, ne(0) = 4.3 × 10¹⁹ m−3, Te(0) = 6 keV, Ti(0) = 15 keV. The modes appear after the slowing down of neutral beam ions (τs,NBI ∼ 80–100 m) but before complete thermalization of the alphas (τs,α ∼ 300–400 ms).
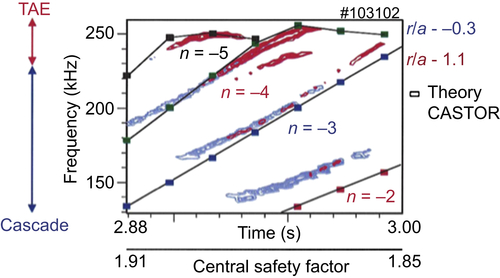
Figure 6.24 Contour plot of edge magnetic measurements (red) and core density fluctuations (blue) for a D-T discharge with B = 5.3 T, I = 2.0 MA, R = 2.52 m. The reflectometer measurements are located at r/a ≈ 0.3 on the inboard (high-field) side of the magnetic axis. Also indicated are the ranges of expected frequencies for TAEs and cascade modes. Rectangles indicate calculations of the mode frequency expected for cascade modes using the measured plasma equilibrium and evolving the central safety factor over a narrow range near q = 2.
6.6. Summary
During its 14 years of operation, TFTR produced seminal, and often unique, results and insights into tokamak operation and confinement. Its operation for more than four years with tritium plasmas demonstrated that it was possible to conduct a thriving research program within the regulatory constraints imposed on a nuclear facility. In the 6 years following the start of D-T operation, more than 360 papers related to TFTR were published in journals and conference proceedings.
During the D-T phase, it proved possible to maintain equipment close to the tokamak and even to install new equipment inside the vacuum vessel. The operation of the neutral beam system with tritium was an outstanding success. TFTR investigated ICRF heating in D-T plasmas using several coupling schemes. The demonstration of second-harmonic 3T ICRF heating without a minority ion resonance is important for ITER, which may need to rely on this heating method to obtain sufficient heating power to obtain the H-mode. The experience with carbon plasma-facing components in TFTR during and following its D-T operation provided critical data for the choices of plasma-facing materials in ITER (Skinner et al., 2004, 2008).
TFTR investigated many regimes of tokamak operation including L-mode, H-mode, supershots, high-internal inductance, and detached plasmas. The results unequivocally showed that it was possible to change tokamak confinement and stability radically by means other than simply the “engineering” parameters of size, magnetic field, and current. While the investigation of H-modes was not a large element in the TFTR research program, data from the TFTR H-mode plasmas (including D-T H-modes) were contributed to the ITPA H-mode database (McDonald et al., 2007) where they provide an important constraint on confinement scalings derived from that data set, particularly for reactor-relevant plasma parameters, in terms of temperature, density, and collisionality.
Measurements of fluctuations in TFTR strongly support the view that moderate-scale electrostatic turbulence, ie, with kθρi < 1, was a major determinant of anomalous transport in the “confinement zone” of high-temperature tokamaks. The investigation and confirmation of the neoclassical resistivity, including the bootstrap current, in TFTR established the basis for modeling the evolution of the plasma current in future tokamaks, including ITER and concepts for steady-state tokamak reactors.
In the core of the highest-performance TFTR D-T supershots the fusion power density reached 2.8 MW/m3, exceeding that expected in ITER (∼1 MW/m3). The central density, beta, and collisionality in TFTR were quite similar to those expected in ITER although the normalized gyroradius in ITER will be smaller due to its larger size. However, whereas in ITER the electron and ion temperatures are expected to be similar, in TFTR there was a large temperature difference between the ions (∼40 keV) and electrons (∼13 keV) maintained by the strong (positive-ion source) neutral beam heating.
The results on fusion alpha-particle confinement in TFTR were favorable for the development of a fusion reactor. The energetic alphas were well confined and appeared to be described by neoclassical physics without large anomalous losses in quiescent plasmas. Once thermalized, however, the alphas became subject to the same transport processes as other thermal ions, leading to the conclusion that a reactor would not become “poisoned” by ash accumulation provided that adequate helium pumping could be provided at the plasma edge. The TFTR observations with respect to alpha particle heating were encouraging, but they were not definitive. Although the subsequent D-T experiments on JET made progress in demonstrating alpha particle heating (Thomas et al., 1998), a final resolution of this burning issue for the viability of magnetic confinement fusion reactors must await future experiments in plasmas with significantly higher Q.
Acknowledgments
The TFTR project involved a dedicated group of engineers, physicists, technicians, and support staff at PPPL and from collaborating institutions whose talent, creativity, and hard work over many years I wish to acknowledge with thanks. Sadly, several members of that team are no longer with us.
In compiling this overview, I have benefited greatly from discussions with many colleagues, including Eric Fredrickson, Larry Grisham, Rich Hawryluk, Joel Hosea, Dale Meade, Steve Scott, Charles Skinner, Tim Stevenson, Jim Strachan, Gary Taylor, Al von Halle, Randy Wilson, Bob Woolley, Ken Young, Mike Zarnstorff, and Stewart Zweben. They helped to refresh my mind about many aspects of the operation and research program of TFTR that the passage of 18 years since the end of its operation had obscured.
The construction, operation, and research program of TFTR at Princeton Plasma Physics Laboratory were performed under United States Department of Energy Contract No. DE-AC02-76CH03073.
..................Content has been hidden....................
You can't read the all page of ebook, please click here login for view all page.