
3Managing
resources
In the Introduction to this book, we stressed the need for operations to be:
![]() effective – delivering the right product or service, one that meets the needs and wants of your customer, on time, every time
effective – delivering the right product or service, one that meets the needs and wants of your customer, on time, every time
![]() efficient – using the fewest possible inputs to deliver the product or service to specification, keeping costs and waste to a minimum
efficient – using the fewest possible inputs to deliver the product or service to specification, keeping costs and waste to a minimum
![]() responsive – accommodating changes in political, economic, social, technological, legal and environmental factors, in the marketplace and in customer demand, in order to ensure that your product or service and the methods used to produce and deliver it are consistent with market needs and best practice.
responsive – accommodating changes in political, economic, social, technological, legal and environmental factors, in the marketplace and in customer demand, in order to ensure that your product or service and the methods used to produce and deliver it are consistent with market needs and best practice.
To achieve these three criteria, it is necessary for the operations manager to control four key elements:
![]() physical capacity
physical capacity
![]() operating schedules
operating schedules
![]() inventory of both raw materials and finished stocks
inventory of both raw materials and finished stocks
![]() staff capability.
staff capability.
In this chapter, we will consider each of those four elements in turn.
MANAGING CAPACITY
Capacity levels
All operations have:
![]() an optimum capacity. This refers to the level of output which is consistent with efficient and economic running of the operation, whilst still allowing time for maintenance of the resources used. This may be physical maintenance of equipment and machinery, particularly in the case of a manufacturing operation, or the training and development of staff if the operation is heavily dependent on its people resource.
an optimum capacity. This refers to the level of output which is consistent with efficient and economic running of the operation, whilst still allowing time for maintenance of the resources used. This may be physical maintenance of equipment and machinery, particularly in the case of a manufacturing operation, or the training and development of staff if the operation is heavily dependent on its people resource.
![]() a maximum capacity. This refers to the level of output which makes fullest use of all the resources required by the operation. When running at maximum capacity, an operation will have all its machinery running at full speed, with no time for any maintenance other than running repairs. Staff will be working as much overtime as they are prepared to work or as much as they can be allowed to work without falling ill or endangering their own safety or the quality of the output. Two very different case studies will illustrate this.
a maximum capacity. This refers to the level of output which makes fullest use of all the resources required by the operation. When running at maximum capacity, an operation will have all its machinery running at full speed, with no time for any maintenance other than running repairs. Staff will be working as much overtime as they are prepared to work or as much as they can be allowed to work without falling ill or endangering their own safety or the quality of the output. Two very different case studies will illustrate this.
CASE STUDY
You may not naturally think of a battle as an operation! Never the less, a battle can be seen as the transformation of inputs – shells, troops, guns, expertise and experience – into a desired output: the defeat of the enemy. Commenting in his book Gallipoli (Wordsworth Editions, 1997) on the battle of Chunuk Bair during the First World War, Alan Moorhead describes the human causes of failure:
On both sides the men had been fighting for three days and nights without sleep, and with very little water or food. The trenches behind them were choked with dead and wounded, and most of those who were still living looked out on their hideous surroundings through a fog of exhaustion. They lay on the ground, they waited, and they responded to their orders like robots with dull mechanical movements.
A more current example comes from the National Health Service.
CASE STUDY
Junior doctors in the NHS are expected to spend extended periods working in hospitals’ casualty departments. Until1997, a typical week of duty exceeded 80 hours. The intention was that the week would be made up of alternating periods of work and time ‘resting’ but on call. However, because the flow of patients (which constitutes customer demand for a hospital) is so unpredictable, it was not unusual for casualty doctors to work 48 hours without sleep. The resulting misdiagnoses and occasional patient deaths have forced the NHS to reduce junior doctors’ working week. Nevertheless, this is being achieved very slowly, because there are too few doctors on the payroll and coming into training.
Most operations also have a minimum capacity. This is the level of output at which the cost of the operation is at breakeven level. In other words, if the operation produced any less, it would be making a loss.
Managing operational capacity is a relatively straightforward process, provided that one of two situations applies:
![]() demand for the outputs (products or services) is consistent and predictable
demand for the outputs (products or services) is consistent and predictable
![]() the operation is designed to achieve flexibility of response through simple adjustments to resource availability.
the operation is designed to achieve flexibility of response through simple adjustments to resource availability.
Neither of these situations arises naturally. However, several techniques and strategies exist to smooth demand and build in flexibility.
Smoothing demand
Demand for an operation's outputs depends on:
![]() the nature of overall demand for the product or service
the nature of overall demand for the product or service
![]() the level and quality of the competition
the level and quality of the competition
![]() the quality of the operation's own outputs
the quality of the operation's own outputs
![]() pricing policy.
pricing policy.
It helps understanding to separate the factors affecting demand in this way. However, the separation is an artificial one. For example:
![]() Overall demand will influence the level of competition.
Overall demand will influence the level of competition.
![]() Quality of outputs should take account of the quality of competitors’ outputs, as we shall see when we consider bench marking in Chapter 4 of this book.
Quality of outputs should take account of the quality of competitors’ outputs, as we shall see when we consider bench marking in Chapter 4 of this book.
![]() Pricing policy is a consideration perceived by customers as an element of quality, or at least value for money.
Pricing policy is a consideration perceived by customers as an element of quality, or at least value for money.
If all these factors remained constant, then demand for the operation's outputs would be both consistent and predictable, and capacity could be planned and managed accordingly. However, in most operations, this is not the case. For Example:
![]() With few exceptions, restaurants experience their greatest demand at lunchtime and in the evenings. But premises, furniture and kitchen equipment are all renewable or fixed resources, with associated costs which cannot be adjusted to match demand.
With few exceptions, restaurants experience their greatest demand at lunchtime and in the evenings. But premises, furniture and kitchen equipment are all renewable or fixed resources, with associated costs which cannot be adjusted to match demand.
![]() Seaside hotels experience their greatest demand during the summer holiday period.
Seaside hotels experience their greatest demand during the summer holiday period.
![]() The demand for barbecues is highest during the hot weather.
The demand for barbecues is highest during the hot weather.
Actions to smooth demand may take one or more of five forms:
![]() differential pricing
differential pricing
![]() product or service diversification
product or service diversification
![]() making to stock
making to stock
![]() customer queuing
customer queuing
![]() encouraging customer loyalty.
encouraging customer loyalty.
Although these are largely different techniques, it is sometimes possible to enhance the effectiveness of one by combining with another, as we shall see.
Differential pricing
This is the best known technique for smoothing demand. It involves attracting customers at periods of low demand by offering price reductions and discounts.
QUESTION
What examples of differential pricing can you think of?
You may have come up with any of the following (some are more obvious than others):
![]() January and summer sales in the high street
January and summer sales in the high street
![]() ‘bargain break’ holidays out of season
‘bargain break’ holidays out of season
![]() ‘off-peak’ ticket prices on the railways
‘off-peak’ ticket prices on the railways
![]() evening and weekend price reductions for telephone calls
evening and weekend price reductions for telephone calls
![]() ‘off-peak’ electricity for domestic heating
‘off-peak’ electricity for domestic heating
![]() higher night-time rates for taxi journeys
higher night-time rates for taxi journeys
![]() commercial gas prices which favour manufacturing processes at night.
commercial gas prices which favour manufacturing processes at night.
All of these approaches are intended to increase the usage of resources which would otherwise be underutilized. It is also worth noticing that the majority apply to service industries, where the processes involved do not allow the business concerned to ‘make for stock’ by producing now, then storing the product to meet later demand.
Differential pricing can also be combined with:
![]() customer queuing
customer queuing
![]() encouraging customer loyalty.
encouraging customer loyalty.
Customer queuing, as we shall see in more detail later, involves making customers wait for the product or service they want. However, most customers are unwilling to wait, unless they receive some tangible benefit.
CASE STUDY
Most airlines offer ‘stand-by’ flights. Under this arrangement, customers are expected to wait until a seat is available on an aeroplane to their desired destination. Airlines compensate for this inconvenience by offering stand-by flights at reduced prices. A further advantage, which is also an example of differential pricing, is that passengers may find them selves upgraded from one class to another. This further smooths demand by ensuring that all cabins on the plane are full.
There are several ways of encouraging customer loyalty, as we shall see. Very often, they are combined with differential pricing by offering customers a price benefit or bonus if they buy regularly from the same source.
J. Sainsbury, the supermarket, offers customers ‘Reward cards’. These are a form of cash card, onto which the checkout operator registers a credit each time the customer makes a purchase. This approach smooths demand by discouraging customers from buying from the competition(Tesco, for example, or the local corner shop). It operates as differential pricing because customers can spend their Reward card credits as part or full payment for later purchases.
Product or service differentiation
This technique is primarily a response to seasonal fluctuations. It involves designing operation processes and, normally, multi skilling staff to take account of different levels of demand for different products and services at different times of year. You should be able to identify examples of product and service differentiation in manufacturing, service, commercial and not-for-profit operations.
QUESTION
What examples of product and service differentiation can you think of?
Here is a range of examples from a variety of sectors.
CASE STUDY
Manufacturing
Walls has been famous for ice-cream for many generations. However, ice-cream is most in demand during the summer. The reduced level of demand during the winter is compensated for at company level because Walls also make pies and sausages – both more popular during the cold weather.
Local builders often offer external house redecoration during the summer – exterior paint does not dry well in the bad weather! – and internal painting and decorating during the winter. The skills required are not markedly different, so the same workforce is able to carry out both kinds of work.
Similarly, you may find that your local coal merchant delivers coal during the winter and offers a garden maintenance service during the summer.
Not-for-profit
Unfortunately, fires happen all the year round. However, There is a seasonal variation in the kinds that occur. In the winter, fires often involve chimney fires or misuse of heating appliances. In the summer, they are more likely to involve outdoor fires, for example from sparks alongside railway tracks, or picnic fires, or matches dropped on country walks. The Fire Service is equipped and trained to deal with both indoor and outdoor fires.
Making to stock
This technique smooths demand by manufacturing products at a fairly consistent level throughout the year, warehousing excess production when demand is low and supplying from stock when demand is high.
QUESTION
What types of product can you think of that are suited to this technique?
You may have mentioned:
![]() fireworks
fireworks
![]() Christmas crackers
Christmas crackers
![]() frozen turkeys
frozen turkeys
![]() anti-freeze
anti-freeze
![]() swimwear
swimwear
![]() skis.
skis.
Many businesses combine making for stock with product diversification, there by reducing costs by sharing the costs between products with different demand patterns, with the added benefit of maintaining turnover throughout the year.
CASE STUDY
W. H. Smith, the high street retailer, offers a wide diversity of merchandise from magazines to wrapping paper to pre-recorded and blank videos. Nevertheless, the company makes the whole of its profit during the months of November and December, as customers buy presents for Christmas. To cope with this huge upsurge in demand, W. H. Smith buyers start placing their Christmas orders in January. The merchandise starts arriving in the shops in July. Trading from January to October barely covers overheads, but is essential to survival. The Christmas rush can only be met by supplying from stock.
Customer queuing
As our definitions have already shown – and as Chapter 4 of this book will explore in more detail – effective operations management seeks to, amongst other things, produce the right products or services in the right quantities at the right time, in order to satisfy the customer. Making customers wait seems neither to deliver at the right time nor likely to achieve customer satisfaction.
However, There are exceptions to this rule. Some of these reflect the nature of customer demand, others bring benefits to the customer, some of which are obvious, some hidden.
CASE STUDY
Specialist car manufacturers (Rolls Royce, Mercedes, Morgan are good examples) regularly quote delivery lead times of two years or more for their vehicles. However, customers are happy to wait for delivery. A combination of clever marketing and tradition have persuaded actual and potential customers that only ‘ordinary’ cars are available off-the-shelf. In part, the delay emphasizes the fact that the car is being built to the customer's individual specification – in other words, that it is the result of a job or project operation. It also reflects the linkage in customers’ minds between delay and quality, although that linkage is limited to only a few markets.
Indirectly, this case study also provides an example of the kinds of benefits which can persuade customers to queue. When a specialist car manufacturer like one of those mentioned above announces a new model – or even if the press spreads the rumour of a new model launch – the manufacturer will receive significant numbers of orders, regardless of the wait involved. For some of those ‘early bird’ customers the benefit will come from owning not just an exclusive make, but a rare, new model of that exclusive make, with the implications that has for social reputation.
For other ‘early bird’ customers, though, the benefit is more immediate and tangible. Because the new model is rare, it is highly sought after. Some purchasers of a new model buy it solely so that they can sell it on at a significant profit!
The next case study offers a more mundane example of a benefit which queuing can bring to the customer.
CASE STUDY
Fast food restaurants – whether Burger King, Kentucky Fried Chicken or your local fish and chip shop – will always have a price list, usually illustrated, displayed over the counter. There is often a bewildering choice. The time spent queuing allows customers to make their choice before reaching the counter, thus avoiding the embarrassment of not knowing what to ask for when they arrive.
Customers are becoming less willing to wait for the product or service they want. Whilst it is inarguable that resources are not cost-efficient if at any time there are no customers to benefit from the m, this has to be balanced against the fact that long queues make customers impatient and likely to take their business to competitors – perhaps permanently. Consequently, organizations are increasingly sacrificing the cost-efficiency of customers waiting to higher standards of customer service.
Tesco now promises its customers that, if There are three people at all open checkouts, the supermarket will open another till. Of course, this has resource implications. Complaints that Tesco sometimes fails to honour its promise invariably result from a lack of available checkout operators.
Encouraging customer loyalty
We have already mentioned Sainsbury's Reward cards as one method of encouraging customer loyalty. Other, similar, retail examples are the popularity of Green Shield stamps in the 1960s and the extensive use of Argos Premier Points cards by BP petrol stations and other retailers. All these methods have the same objective: to offer customers an incentive to return regularly and consistently to the same supplier. Such loyalty schemes do not apply exclusively to retail operations.
QUESTION
What other methods can you think of to encourage customer loyalty?
You could have mentioned:
![]() season tickets for sports grounds or the railways
season tickets for sports grounds or the railways
![]() members’ enclosures at, for example, Henley and Ascot
members’ enclosures at, for example, Henley and Ascot
![]() company boxes at theatrical or operatic first nights
company boxes at theatrical or operatic first nights
![]() free wine with your meal at your second visit to a restaurant
free wine with your meal at your second visit to a restaurant
![]() company loyalty discounts from hotel chains
company loyalty discounts from hotel chains
![]() special contract terms for repeat business from just about every commercial supplier
special contract terms for repeat business from just about every commercial supplier
![]() even the right, in the last century, to a named pew at the local church on payment of a one-off or annual sum by members of the gentry!
even the right, in the last century, to a named pew at the local church on payment of a one-off or annual sum by members of the gentry!
In all these examples, customer loyalty is repaid by discounted prices or added convenience. However, it will be obvious that customers will only remain loyal if their first experience of the organization was satisfying, of a high standard and met their needs. To take our extreme example, churchgoers would only have paid for a family pew if the sermon was interesting and the singing at least reasonable the first time they attended.
Which brings us to a recent initiative which encourages customer loyalty by enhancing customer satisfaction. This is the development of customer-supplier partnerships, to which we shall return in Chapter 4 in order to explore a further benefit they bring.
Customer-supplier partnerships work by abandoning the old practice of keeping customers at arm's length – where their role was to receive the product or service once it had been produced – in favour of involving customers at every stage of an operation. Customers will be involved in:
![]() product or service specification
product or service specification
![]() design
design
![]() development
development
![]() testing
testing
![]() quality monitoring
quality monitoring
![]() regular performance reviews
regular performance reviews
![]() revisions to the product or service.
revisions to the product or service.
In the context of customer loyalty, this approach brings benefits in the form of:
![]() a closer match between customer requirements and the output specification
a closer match between customer requirements and the output specification
![]() a reduction in complaints about quality or performance
a reduction in complaints about quality or performance
![]() early warning of problems
early warning of problems
![]() a greater feeling of ownership of the product or service on the part of the customer.
a greater feeling of ownership of the product or service on the part of the customer.
Evidence of customer-supplier partnerships often comes in the shape of joint working parties, regular consultation and focus groups, another topic we shall return to in Chapter 4.
Smoothing demand from internal customers
The examples and case studies we have quoted so far have all related to external or final customers. But it would be a mistake to assume that the techniques we have described do not apply to internal customers. We have mentioned methods related to:
![]() differential pricing
differential pricing
![]() product or service diversification
product or service diversification
![]() making to stock
making to stock
![]() encouraging customer loyalty.
encouraging customer loyalty.
We have also pointed out that demand depends on:
![]() the nature of overall demand
the nature of overall demand
![]() the competition
the competition
![]() quality
quality
![]() price.
price.
QUESTION
Bearing these issues in mind, which of the five techniques described earlier can be applied to internal customers?
You may be in the happy position of facing no competition at all for internal demand. If so, your customers will be forced to come to you, regardless of the quality you offer or how much it costs. You can make them wait as long as you choose, they can do nothing but remain loyal and you can confidently refuse to alter either the product or service you offer or the way you deliver it. Under those favourable circumstances, the only smoothing technique you need to worry about is customer queuing: ‘If they want it, they ’ll have to wait’.
However, even under those circumstances, your internal customers still have some alternatives: they can do it them selves, or they can do without. Two case studies make the point.
CASE STUDY
Comment from an Operations Manager in a national charity:
We used to rely on Accounts to give us feedback on our income and expenditure. But they made such a mess of it, we decided we couldn't rely on them anymore. So, we recruited our own Finance Officer. Now we know exactly how much money we have available and how much we have spent. Her information is reliable – the rubbish we got from Accounts never was.
The Training Manager of a national retail chain took the decision that management training should focus exclusively on interpersonal skills. Branch managers recognized the fact that management skills also included financial control, stock management and the legal aspects of staff discipline, amongst others.
Demand for management courses dropped by 50 percent in three years.
It is essential to note that, increasingly, organizations are moving away from the idea that internal customer-supplier relationships are fixed.
CASE STUDY
The ‘Competing for Quality’ initiative in government departments requires individual operations to be made subject to competitive tenders. Internal teams are entitled to bid, but their proposals and prices will be compared with those from external suppliers on the basis of:
![]() fitness for purpose
fitness for purpose
![]() quality standards
quality standards
![]() value for money.
value for money.
As an internal supplier, therefore, you may find it a useful survival strategy to seek answers to the following questions:
![]() Do the products or services I provide justify their costs to my customers?
Do the products or services I provide justify their costs to my customers?
![]() Are There times when my operation could deliver at lower cost?
Are There times when my operation could deliver at lower cost?
![]() What additional products or services could I offer?
What additional products or services could I offer?
![]() Are my team adequately multiskilled?
Are my team adequately multiskilled?
![]() What could my operation be producing at times of low demand for our normal output?
What could my operation be producing at times of low demand for our normal output?
![]() Is There any way of storing our excess production?
Is There any way of storing our excess production?
![]() In what ways could I turn waiting for my output into a benefit?
In what ways could I turn waiting for my output into a benefit?
![]() Is the current delay in delivering my output acceptable to customers?
Is the current delay in delivering my output acceptable to customers?
![]() What incentives – in the way of price, discount or convenience – do I offer for customer loyalty?
What incentives – in the way of price, discount or convenience – do I offer for customer loyalty?
![]() How far do I operate in partnership with my customers?
How far do I operate in partnership with my customers?
![]() How could I operate more in partnership with my customers?
How could I operate more in partnership with my customers?
![]() How could I involve them more in output specification, design, development, testing, monitoring, review and revision?
How could I involve them more in output specification, design, development, testing, monitoring, review and revision?
Adjusting capacity
Regardless of the extent to which techniques are successful in smoothing demand, it will still, to some extent, remain inconsistent and unpredictable. Hence, the need to adjust capacity in line with demand. Such adjustments may involve major injections of capital at one extreme, to short-term remedial measures at the other.
Two techniques for adjusting capacity involve significant capital. A further four can be considered as short-term remedial measures, although the definition of short-term and remedial are relative.
Maintaining excess capacity
Our first technique for adjusting capacity runs counter to our argument that operations should make efficient use of resources. Strictly speaking, it may not even involve any adjustment to capacity. It certainly involves a major injection of capital. Simply, the technique is a question of forecasting peak demand and making resources available to meet it. A surprising number of operations apply this technique.
QUESTION
What examples of maintaining excess capacity can you think of?
How do they cope with the efficiency implications of this technique?
Here are a few examples:
![]() Holiday resorts maintain excess capacity in the shape of tourist attractions which remain underutilized during off-peak periods, but compensate for this by closing some attractions out-of-season and encouraging joint marketing initiatives to attract visitors at other times of the year.
Holiday resorts maintain excess capacity in the shape of tourist attractions which remain underutilized during off-peak periods, but compensate for this by closing some attractions out-of-season and encouraging joint marketing initiatives to attract visitors at other times of the year.
![]() The former USSR maintained excess capacity in the shape of larger than necessary armed forces, but dealt with this by a combination of charging high prices in the form of an excessive proportion of Gross National Product and justifying this through a strenuous propaganda programme.
The former USSR maintained excess capacity in the shape of larger than necessary armed forces, but dealt with this by a combination of charging high prices in the form of an excessive proportion of Gross National Product and justifying this through a strenuous propaganda programme.
![]() Airlines maintain excess capacity by offering more seats than necessary on many flights, but resolve the efficiency implications by operating differential pricing.
Airlines maintain excess capacity by offering more seats than necessary on many flights, but resolve the efficiency implications by operating differential pricing.
Automation
Our second capital-intensive technique involves the adoption of automated, frequently computer-controlled, operations. Typically, this technique brings benefits in three ways:
![]() Computer-controlled production allows more rapid adjustments to both the nature and volume of output.
Computer-controlled production allows more rapid adjustments to both the nature and volume of output.
![]() Specifications for a range of outputs can be preprogrammed and stored, thus facilitating product or service diversification.
Specifications for a range of outputs can be preprogrammed and stored, thus facilitating product or service diversification.
![]() Automated operations release staff for other duties. Combined with the technique of multiskilling, which we shall examine later, this allows staff to be used more flexibly.
Automated operations release staff for other duties. Combined with the technique of multiskilling, which we shall examine later, this allows staff to be used more flexibly.
CASE STUDY
The introduction of automated teller machines (ATMs), known popularly as ‘hole in the wall machines’ or simply as ‘cash dispensers’, by the high street banks mean that customers can draw cash, check account balances, request statements or order cheque books at any time of the day or night.
The range of services available from the machines is an example of service diversification, whilst reducing staff involvement simply to that of replenishing them. They are also a response to changes in customer expectations from banking and to changes in the social and technological environment.
As an operations manager, you are unlikely to have the authority to implement either of these capital-intensive techniques without agreement from more senior management. However, it is worth giving thought to the suitability of both maintaining excess capacity and increased automation to your operation – and the potential benefits – so that you can make a case for the introduction of one or both of them.
We shall now look at four techniques for adjusting capacity which concentrate on flexibility rather than capital. These are:
![]() flexible staffing
flexible staffing
![]() multiskilling
multiskilling
![]() revising maintenance patterns
revising maintenance patterns
![]() subcontracting.
subcontracting.
Flexible staffing
As the name suggests, this technique involves adjusting capacity by increasing or reducing staff numbers and/or hours worked.
QUESTION
How many different methods of flexible staffing can you think of?
Here is a fairly lengthy list of alternative approaches. Even so, it is not complete!
![]() Overtime working. This may be paid overtime, agreed between management and staff, or the normal expectation that professional and executive staff will work longer hours when the work demands it.
Overtime working. This may be paid overtime, agreed between management and staff, or the normal expectation that professional and executive staff will work longer hours when the work demands it.
![]() Annualized hours. Instead of specifying how many hours staff are expected to work each week, some organizations have introduced specifications of annual hours. This means that employees work short hours during slack periods and long hours during busy ones. Although open to abuse if management makes unreasonable demands on staff, annualized hours can bring staff benefits in the form of extra holidays or time off at slack periods. These are more attractive, of course, if those slack periods coincide with decent weather!
Annualized hours. Instead of specifying how many hours staff are expected to work each week, some organizations have introduced specifications of annual hours. This means that employees work short hours during slack periods and long hours during busy ones. Although open to abuse if management makes unreasonable demands on staff, annualized hours can bring staff benefits in the form of extra holidays or time off at slack periods. These are more attractive, of course, if those slack periods coincide with decent weather!
![]() Part-time working. Introduced by public sector organizations largely in response to social change (an increase in women returners) and by retail organizations in response to market patterns. Part-time working involves the negotiation of working patterns in line with the needs of both the job and the employee. For example, working hours may be full-time during school terms but none at all during school holidays; mid-morning till mid-afternoon; early morning till after lunch; before lunch till late afternoon.
Part-time working. Introduced by public sector organizations largely in response to social change (an increase in women returners) and by retail organizations in response to market patterns. Part-time working involves the negotiation of working patterns in line with the needs of both the job and the employee. For example, working hours may be full-time during school terms but none at all during school holidays; mid-morning till mid-afternoon; early morning till after lunch; before lunch till late afternoon.
The most flexible examples of part-time working come from retailing.
CASE STUDY
A typical demand pattern in a supermarket starts quietly first thing in the morning, becomes busy at lunchtime, quietens again mid-afternoon and reaches a peak late afternoon and into the evening. Superimposed on this is a weekly pattern, with Friday evenings and weekends busier than the rest of the week.
There are various part-time working responses to these patterns. Staff may work mid-morning to mid-afternoon, lunchtime to close of business, evenings only, Saturday sonly, weekends only. Yet others will come in after the store closes to clean up and restock the shelves ready for the next day's opening.
![]() Flexitime. A precursor to annualized hours, flexitime typically allows staff to work so many hours less or more than their contract requires each week, provided that they meet the contract requirements over a one-, two-, or three-month period. Often seen (rightly) as a staff benefit, flexitime also enables the organization to adjust its operating capacity, provided that management-staff relations are harmonious enough for staff to be willing to accommodate the changing volumes of work.
Flexitime. A precursor to annualized hours, flexitime typically allows staff to work so many hours less or more than their contract requires each week, provided that they meet the contract requirements over a one-, two-, or three-month period. Often seen (rightly) as a staff benefit, flexitime also enables the organization to adjust its operating capacity, provided that management-staff relations are harmonious enough for staff to be willing to accommodate the changing volumes of work.
![]() Temporary shift-working. Many manufacturing operations use temporary additional shifts in response to increases in demand. This may involve a temporary move from two-shift to three-shift working, or the short-term introduction of weekend shifts. Of course, this method is only truly flexible if the business has access to temporary staff in the area, whom they can call on at short notice.
Temporary shift-working. Many manufacturing operations use temporary additional shifts in response to increases in demand. This may involve a temporary move from two-shift to three-shift working, or the short-term introduction of weekend shifts. Of course, this method is only truly flexible if the business has access to temporary staff in the area, whom they can call on at short notice.
![]() Temporary, agency or contract staff. Recent years have seen a major growth in agencies supplying temporary staff.
Temporary, agency or contract staff. Recent years have seen a major growth in agencies supplying temporary staff.
Temporary staff are no longer mainly clerical, secretarial or administrative. It is now possible to hire
![]() engineers
engineers
![]() accountants
accountants
![]() human resource managers
human resource managers
![]() Research and Development specialists
Research and Development specialists
![]() project managers.
project managers.
from agencies, all on a temporary basis.
An alternative is to hire staff on a short-term contract: three, six or twelve months. Indeed, organizations are increasingly turning all their employment contracts into fixed-term contracts: one, two or three years are typical.
![]() ‘No work, no pay’ contracts. We have included this approach, not as one to be adopted, but by way of completeness. ‘No work, no pay’ contracts operate on the basis of recruiting and training staff, requiring them to be available, but only paying them if There is work. In its original form, this approach has been around for a long time. Many building firms used it for building labourers, who would arrive at the site first thing in the morning and stay to work if needed.
‘No work, no pay’ contracts. We have included this approach, not as one to be adopted, but by way of completeness. ‘No work, no pay’ contracts operate on the basis of recruiting and training staff, requiring them to be available, but only paying them if There is work. In its original form, this approach has been around for a long time. Many building firms used it for building labourers, who would arrive at the site first thing in the morning and stay to work if needed.
More recent examples are less humane. There have been several cases of fast-food catering staff expected to stay permanently on the employer's premises, but only being paid when There was an upturn in business. Whilst this new approach is more flexible for the organization than the traditional approach, we find it hard to justify from a human rights standpoint.
Multiskilling
This approach to adjusting capacity is simple in concept but significant in terms of its implications. The basic concept asserts that, if staff members are capable of carrying out a range of tasks, they can be moved to those tasks which are needed to satisfy customer demand.
CASE STUDY
The Civil Service promotes people into grades rather than specific jobs. The intention is that civil servants should receive training in a wide range of skills, so that they are capable of performing equally satisfactorily in, for example, a strategy planning, contracts management, accounting or human resources function.
You may see this intention as unrealistic. If so, you would be right! Many civil servants express a wish to specialize. To address this wish, two promotion systems now apply in parallel. Individual jobs are advertised and staff can achieve promotion by applying successfully for one of them. At the same time, staff can also ask to attend a promotion board, success at which gives them the necessary ‘ticket’ to be posted to the next available job at the relevant grade.
This case study has several implications for multiskilling:
![]() Its success is dependent on the quality and potential of the staff.
Its success is dependent on the quality and potential of the staff.
![]() Its success is dependent on their willingness to take on a variety of tasks.
Its success is dependent on their willingness to take on a variety of tasks.
![]() Its success is dependent on the quality and availability of training in the various skills.
Its success is dependent on the quality and availability of training in the various skills.
Revising maintenance patterns
A well-run operation will set aside time for regular maintenance of equipment and updating or upgrading of staff skills. A way of adjusting capacity to demand is to revise equipment maintenance and staff training schedules, bringing these forward when demand is low and deferring them when demand is high.
Of course, the approach has dangers. Maintaining equipment too soon or too frequently may simply be a waste of time, effort and resources. Deferring maintenance for too long may result in expensive machine breakdown.
Equally, training people just because they have no work to do probably means that they will have no chance to practise the new skills or knowledge they have gained. And ‘skills you don't use, you lose’. Deferring training is also dangerous. In a busy work environment, There is never a good time to train staff. As a result, training is not just deferred – it simply never happens!
Nevertheless, used intelligently, the practice of revising maintenance patterns to suit demand offers valuable scope for flexibility.
Subcontracting
Our final method is often described as the ‘make or buy’ decision. When demand is relatively light, operations are carried out in-house. When demand is heavy, increased use is made of subcontractors.
The ‘make or buy’ title suggests that this technique applies primarily to manufacturing. This, however, is not the case. For example:
![]() A training organization can design its own materials in slack periods, but buy in generic materials or commission a consultant to design for them at busy times.
A training organization can design its own materials in slack periods, but buy in generic materials or commission a consultant to design for them at busy times.
![]() The workshop in a garage may use an apprentice to take a customer to the bus stop in slack periods, but call a taxi at busy times.
The workshop in a garage may use an apprentice to take a customer to the bus stop in slack periods, but call a taxi at busy times.
![]() The ambulance service will transport outpatients in their own sitting-cars when these are available, but use volunteer drivers at other times.
The ambulance service will transport outpatients in their own sitting-cars when these are available, but use volunteer drivers at other times.
Literature on operations management often states that using subcontractors gives them an opportunity to learn your trade secrets and skills and then set up in competition with you. Whilst this does happen, the risk can be minimized by careful wording of contracts. In any case, such action would run counter to most business ethics. The argument that such action would be unethical may not always be very powerful, but breaches of ethics will have a significant adverse effect on the subcontractor's chances of gaining work elsewhere.
QUESTION
Which of these remedial techniques could you make more use of:
![]() flexible staffing?
flexible staffing?
![]() multiskilling?
multiskilling?
![]() revising maintenance pattern?
revising maintenance pattern?
![]() subcontracting?
subcontracting?
MANAGING OPERATING SCHEDULES
The process of operations scheduling sets out to ensure that the sequence of activities which make up an individual operation, and the sequence of operations which support and depend on each other, are logical and efficient. The ease with which the scheduling process can be carried out depends on:
![]() the complexity of the operation. The more stages or activities in an operation, the more scope There is for delays, waste and inefficiency.
the complexity of the operation. The more stages or activities in an operation, the more scope There is for delays, waste and inefficiency.
![]() the duration of the operation. Long operations are more difficult to schedule, but give more opportunity to increase efficiency by rearranging the component activities.
the duration of the operation. Long operations are more difficult to schedule, but give more opportunity to increase efficiency by rearranging the component activities.
![]() the nature of the operation. As we explained in the last chapter, operations may involve one-off jobs, batches or continuous flow. The more repetitive the operation, the more experience will be available with which to streamline it and enhance its efficiency.
the nature of the operation. As we explained in the last chapter, operations may involve one-off jobs, batches or continuous flow. The more repetitive the operation, the more experience will be available with which to streamline it and enhance its efficiency.
Effective operations scheduling involves the analysis and planning of four key elements:
![]() activity duration
activity duration
![]() activity frequency
activity frequency
![]() activity sequence
activity sequence
![]() activity timing.
activity timing.
Activity duration
Under this heading, it is necessary to consider:
![]() how long the activity takes to complete
how long the activity takes to complete
![]() the resources currently used to complete it
the resources currently used to complete it
![]() its impact on the next activity in the sequence.
its impact on the next activity in the sequence.
In most, but not all cases, the time needed to complete an activity will depend on the resources used. For example:
![]() Two postmen should be able to complete a delivery round twice as fast as one.
Two postmen should be able to complete a delivery round twice as fast as one.
![]() Calculations done on a calculator should be quicker than if done with paper and pencil.
Calculations done on a calculator should be quicker than if done with paper and pencil.
CASE STUDY
B. F. Skinner, known as ‘ the father of scientific management’, observed a team of workers shovelling coal. He noticed that, being casual workers, each man had brought his own shovel and that some performed work more efficiently than others. Skinner identified the most efficient shovel design, then bought and issued enough for all the team. Output improved dramatically.
This case study raises the issue of the suitability of the resources for the activity. This applies to both physical and human resources. It is worth asking yourself:
QUESTION
Are the physical resources used by my people suitable for the job?
The answer may raise issues related to, for example:
![]() the comfort of the seating
the comfort of the seating
![]() how effectively computer programs deal with specific tasks
how effectively computer programs deal with specific tasks
![]() whether There are enough telephones to go round
whether There are enough telephones to go round
![]() should the photocopier be upgraded to offer double-sided copies or a collation facility
should the photocopier be upgraded to offer double-sided copies or a collation facility
![]() whether the containers used for component storage are big enough
whether the containers used for component storage are big enough
![]() whether fork-lift trucks have a high enough reach
whether fork-lift trucks have a high enough reach
![]() whether delivery vehicles are too small for the size of load, or too big for customer's unloading bays.
whether delivery vehicles are too small for the size of load, or too big for customer's unloading bays.
QUESTION
Do my people have the capability to do the job?
It is obvious that inexperienced staff are likely to be slower and more prone to error than experienced ones.
CASE STUDY
When the Road Transport Industry Training Board were making a film about basic workshop practice, they asked an experienced fitter to demonstrate how to change a wheel. He did it so quickly that it was impossible to identify his actions. They had to find a recently qualified trainee to demonstrate the task instead!
Matching people to jobs is an essential process which we will cover in more detail later in this chapter.
As a result of asking such questions, it is always tempting to embark on a remedial or improvement programme. However, such action would be premature.
For the purpose of operations scheduling, it is necessary first to consider the impact of reducing the time taken by an activity on the next activity in the sequence. If speeding it up has no benefit, it is not worth doing. Equally, if the cost of improvement exceeds the efficiency savings gained, again it has no value. Whilst the theme of continuous improvement is attractive, it does not justify remedial action which achieves nothing, or is more costly than leaving things as they are.
Activity frequency
The more frequently an activity takes place, the more worthwhile it is to invest in making it more efficient. This is a fundamental principle of time and motion study, which involves experts with clipboards and stopwatches observing and analysing the actions which make up tasks, and the tasks which make up activities.
Failure to seek ways to make frequent activities more efficient leads to longer task durations, increased costs and, if they are physical activities, often to strain or injury.
CASE STUDY
The workplace injury known as RSI (repetitive strain injury) often affects word processor operators. The cause most usually identified is that their workstations are designed for traditional typewriters, whilst the physical movements necessary to operate a word processor are different and inconsistent with the layout provided for a typewriter.
Activity sequence
The analysis of activity sequence goes to the heart of operations scheduling. It involves critical examination of the whole chain of activities which make up an operation, in order to identify such inefficiencies as:
![]() double handling
double handling
![]() repetition
repetition
![]() excessive distance between activities.
excessive distance between activities.
CASE STUDY
The diabetic clinic of the Radcliffe Infirmary in Oxford is world-famous for the expertise of its consultants and the quality of treatment. A typical patient visit will include:
![]() a blood test
a blood test
![]() an eye examination
an eye examination
![]() a foot examination
a foot examination
![]() a review of any problems since the last visit
a review of any problems since the last visit
![]() an interview with the consultant.
an interview with the consultant.
In order to improve the sequence of those activities, the clinic has introduced a new system:
![]() Patients go to their own GP for a blood sample to be taken.
Patients go to their own GP for a blood sample to be taken.
![]() The sample is sent to the clinic in advance of the patient's visit, so that the results are already available when the patient arrives.
The sample is sent to the clinic in advance of the patient's visit, so that the results are already available when the patient arrives.
![]() A nurse examines the patient's eyes on his or her arrival at the clinic, during the time otherwise spent waiting to see the consultant.
A nurse examines the patient's eyes on his or her arrival at the clinic, during the time otherwise spent waiting to see the consultant.
![]() Patients are encouraged to keep a diary of events since their last visit in a set format, so that this information is readily available to the consultant.
Patients are encouraged to keep a diary of events since their last visit in a set format, so that this information is readily available to the consultant.
![]() Feet are examined by a qualified podiatrist after the patient's interview with the consultant. The podiatrist then agrees and prescribes any necessary treatment, which is recorded in the patient's notes for later reference.
Feet are examined by a qualified podiatrist after the patient's interview with the consultant. The podiatrist then agrees and prescribes any necessary treatment, which is recorded in the patient's notes for later reference.
The implementation of this system has brought down typical attendance at the clinic from over an hour to twenty-five minutes.
The most common method of analysing activity sequence is by the use of a flow chart or network diagram. An example of a simple network diagram for the operation of carrying out an office removal is shown in Figure 3.1.
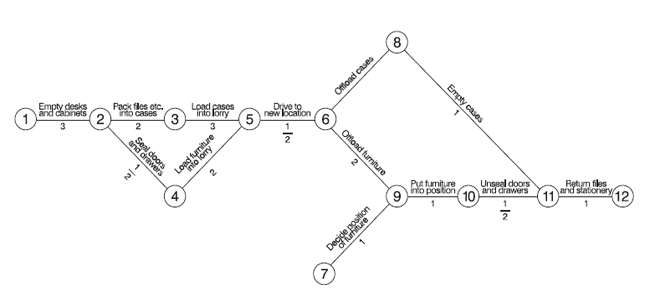
Figure 3.1Network: office removal
The conventions of a network diagram are as follows:
![]() All activities start and finish with a circle (called a ‘node’).
All activities start and finish with a circle (called a ‘node’).
![]() Nodes are numbered for ease of reference (there is no special logic to the numbering).
Nodes are numbered for ease of reference (there is no special logic to the numbering).
![]() Activities are described in action words above the line, with the duration below.
Activities are described in action words above the line, with the duration below.
![]() Durations can be in anything suitable from seconds to weeks, as long as they are all consistent.
Durations can be in anything suitable from seconds to weeks, as long as they are all consistent.
![]() ‘Burst’ nodes are points where several activities can start when one is completed.
‘Burst’ nodes are points where several activities can start when one is completed.
Network diagrams have several advantages:
![]() They enable you to identify the sequence of activities which determine the minimum duration of an operation ( the ‘critical path’ through the network).
They enable you to identify the sequence of activities which determine the minimum duration of an operation ( the ‘critical path’ through the network).
![]() They encourage you to concentrate on improving those activities which can bring about real efficiency savings in an operation.
They encourage you to concentrate on improving those activities which can bring about real efficiency savings in an operation.
![]() They provide scope for streamlining an operation by identifying those activities which could be carried out in parallel.
They provide scope for streamlining an operation by identifying those activities which could be carried out in parallel.
![]() They highlight waiting time.
They highlight waiting time.
If you want to know more about the use of network diagrams, refer to the Institute of Management Foundation's Open Learning Text Understanding Business Process Management (Teresa Riley, Pergamon, 1997), which explains the process in greater detail and provides opportunities to practise.
Activity timing
So far, we have considered the duration, frequency and sequence of activities as existing in their own right. In other words, we have paid little attention to practical realities, like delivery dates specified in a customer contract, or the requirements of an internal customer.
However, analyses of activity duration and activity sequence will both contribute to decisions about activity timing. They can assist calculations of what timings are achievable and realistic, whilst knowledge of the timings can also assist with decisions about, for example, the need for efficiency savings or how many resources to allocate. For example:
![]() At several points in this book, we have stressed the need to deliver customer satisfaction. In job or project operations, in particular, it is tempting to attempt this by promising early delivery dates. However, nothing is more likely to lead to customer dissatisfaction than a missed delivery promise! Careful analysis of activity duration and activity sequence will ensure that the delivery promises you make are realistic.
At several points in this book, we have stressed the need to deliver customer satisfaction. In job or project operations, in particular, it is tempting to attempt this by promising early delivery dates. However, nothing is more likely to lead to customer dissatisfaction than a missed delivery promise! Careful analysis of activity duration and activity sequence will ensure that the delivery promises you make are realistic.
![]() Alternatively, you may be required to achieve specified activity timings. Analyses of activity duration and sequence will enable you to work out whether your current processes make those timings achievable and, if not, what scope you have to shorten the overall operation by allocating extra resources, carrying out activities in parallel or achieving efficiency savings in individual activities.
Alternatively, you may be required to achieve specified activity timings. Analyses of activity duration and sequence will enable you to work out whether your current processes make those timings achievable and, if not, what scope you have to shorten the overall operation by allocating extra resources, carrying out activities in parallel or achieving efficiency savings in individual activities.
MANAGING INVENTORY
Most operations depend on the careful management of inventory. In manufacturing operations, that dependence is obvious:
![]() Inputs arrive partly in the form of raw materials, components or subassemblies. The operation depends on their availability.
Inputs arrive partly in the form of raw materials, components or subassemblies. The operation depends on their availability.
![]() Outputs take the form of finished goods, which in most cases will need to be warehoused prior to delivery to the final customer. Too much money tied up in finished stock is a heavy financial drain on the business.
Outputs take the form of finished goods, which in most cases will need to be warehoused prior to delivery to the final customer. Too much money tied up in finished stock is a heavy financial drain on the business.
The relevance of inventory management to service operations is less obvious. However, some simple examples will make the relevance clear:
![]() Schools depend on paper, textbooks, chalk, paint for art classes.
Schools depend on paper, textbooks, chalk, paint for art classes.
![]() Hospitals depend on syringes, blood, swabs, nurses’ uniforms, clean bedlinen.
Hospitals depend on syringes, blood, swabs, nurses’ uniforms, clean bedlinen.
![]() Garage workshops depend on spare parts, oil, anti-freeze.
Garage workshops depend on spare parts, oil, anti-freeze.
![]() Theatres depend on costumes, tickets, refreshments, scenery.
Theatres depend on costumes, tickets, refreshments, scenery.
![]() Cleaning contractors depend on disinfectant, polish, dusters, invoice pads.
Cleaning contractors depend on disinfectant, polish, dusters, invoice pads.
![]() The importance of inventory to retail outlets goes without saying!
The importance of inventory to retail outlets goes without saying!
Inventory is a necessary evil. Held at too low a level, items are likely to run out, which halts production and leaves an operation without saleable output. And it is irrelevant whether the out-of-stock item is a major or minor one. The result is the same.
CASE STUDY
When Reliant, the manufacturer of three-wheeled cars, returned to production after a period in the hands of the receiver, unfinished bodies and components to make engines were still available in the factory. This did not prevent a delay of three weeks, because the purchasing staff were unable to find a supplier of headlamp bulbs who was willing to supply a commercially risky customer.
At the same time, excess inventory is expensive. It is likely to deteriorate, may become obsolete and requires costly storage. It is therefore necessary to walk a very narrow line between inadequate and excess inventory, in order to maintain an inventory buffer which is sufficient to keep an operation running without prejudicing its cost-efficiency.
Three activities are central to effective inventory management:
![]() forecasting demand
forecasting demand
![]() controlling stock
controlling stock
![]() replenishing stock.
replenishing stock.
Forecasting demand
Demand forecasting as it relates to inventory takes place at both a macro and a micro level. It also takes account of both quantitative and qualitative elements.
At a macro level, demand forecasting is part of strategic marketing. It analyses the environmental factors described in Chapter 2 to identify future customer needs and wants, competitive pressures and overall changes in the nature of the market. This is largely a qualitative analysis, although organizations will use as much quantitative data – in the shape of research reports, government and trade statistics and available past sales records.
It is easiest to picture this process as it relates to external markets and customers, but it is equally relevant to internal customers. Changes in your internal customers’ processes or operations will change what they expect from you. Customer departments may increase or decrease the scale of their operation, thus affecting the size of their demand on you. And, as we explained earlier in this chapter, the opportunities for traditional internal customers to go to external suppliers are growing.
At a micro level, demand forecasting seeks to establish, with as much accuracy as possible, future demand patterns on a daily, weekly and monthly basis. In continuous operations, it may even be necessary to forecast demand on an hourly basis!
Micro forecasting is heavily dependent on quantitative techniques. After all, inventory management is fundamentally a matter of having the right items, in the right quantities, in the right place, at the right time. Consequently, demand forecasts with a wide margin for error run major risks of holding excess inventory, or running out of stock. However, as we shall see later, when we examine stock control methods, There are some categories of item where it is preferable to hold large buffer stocks.
Fortunately, short-term demand forecasting at a micro level can be carried out with greater accuracy than long-term strategic forecasting. At a micro level, demand forecasting typically makes use of three techniques.
Extrapolation from historical data
This involves a combination of time series and trend analysis and the use of moving averages. Consider the following example.
COMPETENCE SELF-ASSESSMENT
The Office Manager of Excel Engineering is responsible for several operations. One of these is the production of customer invoices and statements. Both are raised on specially printed, headed documents. Here are some details of the numbers of invoices and statements raised weekly in the past three months, with some supporting data from last year.
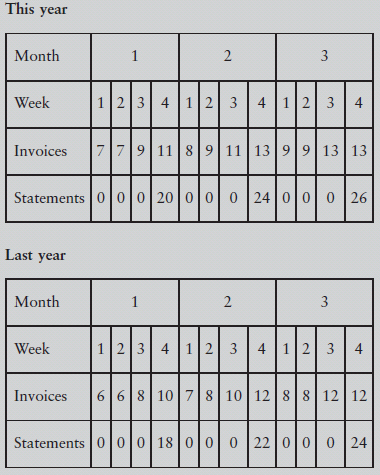
It is now the end of month 3. How many in voices and statements should the Office Manager expect to raise in each of the four weeks of month 4?
A comparison of this year's and last year's figures show some clear trends:
![]() Statements are all raised in the last week of the month.
Statements are all raised in the last week of the month.
![]() More invoices are raised in weeks 3 and 4 of each month than in the previous two.
More invoices are raised in weeks 3 and 4 of each month than in the previous two.
![]() The volume of invoices and statements is slightly higher this year than last year.
The volume of invoices and statements is slightly higher this year than last year.
If we look at this year's figures alone, it looks as though they are following a rising trend. This would tempt us to predict month 4’s invoices at around 10 in each of weeks 1 and 2, and around 14 in weeks 3 and 4, with perhaps 28 statements in week 4.
However, a comparison with last year's figures shows a marked seasonal pattern. Volumes drop significantly in month 4. Although we do not have enough data to be certain, it looks likely that the volumes for month 4 this year will be:

Historical data is accurate – it records what actually happened. Forecasts can be extrapolated from historical data by techniques from one extreme of scanning for a pattern – as we have just done – to complex computer programs, which quantify trends, at the other. But, as we know, history rarely repeats itself – or not exactly, anyway – which brings us to our second technique.
Quantitative prediction
We have already referred to the contribution of market research to demand forecasting and will return to the the me in Chapter 4. Fortunately for short-term forecasting, customers have a much better idea of their buying intentions in the short term than in the long term. For example, if you were asked where you were going to eat lunch today, you would have a much clearer idea than if you were asked where you were going to eat lunch on the same day, three months hence.
Consequently, quantitative prediction of short-term demand can, in many cases, involve customers. Weekly internal production meetings, involving both customers and suppliers, are an effective way of predicting next week's demand.
CASE STUDY
Rank Xerox operates a chain of in-house reproduction facilities on customers’ premises. Each week, the manager of the facility asks customers for the volume and type of reprographic work they will require the following week. The written responses are received on Thursday and form the basis for work scheduling and inventory management for the next week.
Many services – restaurant tables, hotel rooms, airline seats – are booked in advance. Pre-bookings offer another method of quantitative demand prediction. Of course, they are not wholly accurate. Most airlines overbook in order to maintain demand in the face of ‘no shows’. Hotels, in particular, ask for a faxed confirmation or credit card details when a guest books by phone. Nevertheless, customer information is a reasonably accurate way of predicting short-term demand.
Our last technique is far less reliable, but offers an important balance to quantitative methods, which may be so dependent on numbers that they lose sight of wider trends.
Qualitative judgement
Simply expressed, qualitative judgement uses informed judgement – ‘gut feel’ or ‘inspired guesswork’ – to predict demand. Although more often used in the context of macro forecasting, There are situations where it is relevant to shorterterm forecasting as well:
![]() The launch of a new product or service, where There is no historical data.
The launch of a new product or service, where There is no historical data.
![]() Following a change in organization structure, where internal demands will come from new customers or differently structured departments.
Following a change in organization structure, where internal demands will come from new customers or differently structured departments.
QUESTION
Which of these three techniques could you make more use of:
![]() extrapolation from historical data?
extrapolation from historical data?
![]() quantitative prediction, using customer information?
quantitative prediction, using customer information?
![]() qualitative judgement, using hunches from experts or those with experience?
qualitative judgement, using hunches from experts or those with experience?
Controlling stock
Effective stock control demands answers to three questions:
![]() What stock do we have?
What stock do we have?
![]() What stock will we need?
What stock will we need?
![]() What is its value?
What is its value?
What stock do we have?
Unlikely as it may seem, it is often difficult for an organization, or even an individual operation, to determine just what inventory it is currently holding. In some cases, the problem is unavoidable. In others, it is the result of a systems failure. For example:
![]() In most organizations, separate departments hold their own stocks of printed stationery. Thus, one department may run out and order more, while the next department down the corridor has enough for several months – even years!
In most organizations, separate departments hold their own stocks of printed stationery. Thus, one department may run out and order more, while the next department down the corridor has enough for several months – even years!
![]() Mobile repair engineers carry their own van-stocks of consumable items and replacement parts. For their own convenience, they normally carry excess stock. Put together, these excess stocks can be worth up to several thousand pounds.
Mobile repair engineers carry their own van-stocks of consumable items and replacement parts. For their own convenience, they normally carry excess stock. Put together, these excess stocks can be worth up to several thousand pounds.
A major cause is often a mismatch between stock records and physical stock, as this next case study shows.
CASE STUDY
When Toyota (GB) Limited introduced a computerized stock control system for vehicle parts, this incorporated a sophisticated program to reorder parts from Japan, but only when the stock of that part reached a specified level. In the early days, There were numerous cases where the warehouse pickers returned a picking-list marked ‘out of stock’, but the computer would not allow an order on the factory because its records showed that stock was available in the warehouse. In most cases, this resulted either from an inputting error, or because the stock had been put away in the wrong place in the warehouse.
Most organizations dread the thought of the annual stock take. Nevertheless, this is not only a requirement for the preparation of the organization's balance sheet, it is also, for many, the only way of discovering just what stock they hold – and where it is. In view of this, it is not surprising that physical stocktaking now takes place, in some organizations, as often as once a month.
What stock will we need?
Part of the answer to this question comes from the demand forecasting process we have already examined. Another part of the answer comes from a careful analysis of all the inputs needed to achieve a given volume of output to job operations.
Continuous operations, if properly controlled, should generate a large amount of reliable historical data relating to the usage of raw materials, components, subassemblies, and consumables such as lubricants and cleansers. Effective data will also identify the split between inputs used and waste, with a view to improving cost control.
Batch operations should generate similar data. However, because these involve the production of a diverse range of outputs, less data will be available for individual outputs and, in addition, it will be more difficult to allocate common inputs to separate outputs. For example, if a photocopier is used by several teams, how much toner should be allocated as an input to the work of each?
Because job operations are unique, historical data will be unreliable. Comparisons with other jobs can be made, but these can only be approximate. With job operations, the prediction of required stock will be heavily dependent on the best estimates of those using it – another form of qualitative judgement.
The more careful the input analysis, the more reliable the historical data and the more expert the qualitative judgement, so the more likely it is that the operations manager will be able to predict the levels of stock required to achieve specified outputs.
What is value?
In any management process, the point comes where the cost of solving a problem is higher than that involved in leaving it alone. This definitely applies to stock control. Where inventory items are of high value, it is essential to monitor usage and waste very closely and to keep stock levels to the minimum required to achieve delivery of the output.
When W. H. Smith sold cameras and computers, these stocks were held in retail branches in small quantities and in a locked area of the stockroom. Only staff of management grade had access to these locked areas.
Low-cost items, on the other hand, will, if controlled too tightly, cost more to control than to buy!
Several alternative approaches exist to analyse inventory or stock values. However, they are all derived from the same basic principle, which is known as Pareto's Law. Pareto was a nineteenth-century Italian economist. His research into the population of Florence identified that 80 per cent of the wealth was owned by 20 per cent of the population. This ‘80:20 rule’ has since been developed and applied to a wide variety of business and economic situations. For example:
![]() 80 per cent of sales come from 20 per cent of customers
80 per cent of sales come from 20 per cent of customers
![]() 20 per cent of staff cause 80 per cent of problems
20 per cent of staff cause 80 per cent of problems
![]() 20 per cent of customers make 80 per cent of complaints.
20 per cent of customers make 80 per cent of complaints.
As it applies to inventory management, Pareto's Law is an encouragement to identify the small number of high-value items which represent the largest proportion of total stock value.
Because this application of Pareto's Law is a long way from nineteenth-century wealth distribution in Florence, it is unlikely that the analysis will show up a precise 80:20 distribution. However, the modern variation of Pareto's approach – known as ABC analysis – typically reveals some quite close approximations.
ABC analysis takes each inventory item, identifies its cost and turnover, then multiplies these to calculate its annual value. If items are then ranked in order of turnover value, a pattern something like that in Figure 3.2 typically emerges.
As Figure 3.2 shows:
![]() The most valuable 10 per cent of items account for 75 percent of total annual turnover.
The most valuable 10 per cent of items account for 75 percent of total annual turnover.
![]() The least valuable 75 per cent of items account for 10 percent of total annual turnover.
The least valuable 75 per cent of items account for 10 percent of total annual turnover.
The normal outcome of an ABC analysis is to develop a tight system of stock control for Class A items, a less sophisticated system for Class B items and, for Class C items, a system which controls stock by package or container load, rather than individually.

Figure 3.2ABC analysis
Replenishing stock
Stock is a buffer between variations in demand and lack of availability of inputs. But holding stock is costly and inefficient. As a result, approaches to stock replenishment seek to keep stocks and costs to a minimum, whilst maintaining output.
The most recent development in replenishing stock is, strictly speaking, nothing to do with stockholding. Instead, Just-In-Time (JIT) techniques are designed to deliver inputs at precisely the time they are needed to be transformed into outputs. Looked at in one way, JIT has been around for a long time – as a way of delivering utilities. Gas, water and electricity are available to the consumer at the turn of a tap or by pressing a switch. Contrast gas central-heating, for example, where the gas is available on demand when the customer wants it, with oil-fired central heating, where oil supplies need to be ordered in advance and held in stock by the customer until required.
In a manufacturing context, JIT depends on the ability on the part of both customer and supplier to maintain a balance between the stability of the customer's requirements and the flexibility of the supplier's operating systems. If the customer's operation is continuous and stable, it is more likely that the supplier will be able to meet this regular and consistent demand on a JIT basis.
However, JIT is really an operational philosophy rather than simply a method of stock replenishment. It sets out to turn an operation into a continuous process or a seamless web. The implementation of JIT is likely to involve:
![]() a review of system design and layout to eliminate waiting, bottlenecks and transfer problems
a review of system design and layout to eliminate waiting, bottlenecks and transfer problems
![]() a close examination of activity sequences and durations to ensure that the speed and position of each activity are consistent with the operation as a whole
a close examination of activity sequences and durations to ensure that the speed and position of each activity are consistent with the operation as a whole
![]() a sophisticated system to call up inputs
a sophisticated system to call up inputs
![]() quality initiatives to eliminate defective inputs
quality initiatives to eliminate defective inputs
![]() rationalizing product or service range, making greater use of shared components
rationalizing product or service range, making greater use of shared components
![]() the design of maintenance programmes (equipment and people) to eliminate breakdowns and interruption
the design of maintenance programmes (equipment and people) to eliminate breakdowns and interruption
![]() multiskilling
multiskilling
![]() a commitment to continuous improvement
a commitment to continuous improvement
![]() increased customer-supplier co-operation in systems design, specification of requirements, timing, quantity and quality.
increased customer-supplier co-operation in systems design, specification of requirements, timing, quantity and quality.
QUESTION
Is There any scope for JIT methods in your operation?
If JIT is not for you, your approach to stock replenishment will need to balance three factors:
![]() the cost of holding stock
the cost of holding stock
![]() the cost of ordering stock
the cost of ordering stock
![]() the risks and consequences of stock-outs.
the risks and consequences of stock-outs.
CASE STUDY
When garage workshops order parts, they normally have a choice between:
![]() monthly orders
monthly orders
![]() weekly orders
weekly orders
![]() vehicle-off-road (VOR) orders.
vehicle-off-road (VOR) orders.
Monthly orders involve large quantities, a long wait, but 35 per cent discount. Weekly orders can be smaller, take less time, but the discount falls to 25 per cent. Vehicle-off-road orders can be for individual items, have a promised delivery of 24 or 48 hours but only 15 per cent discount.
If the cost of holding stock is high (either because the item is of high value or storage is expensive, for example, in an Oxford Street store), then the customer may do better to order smaller quantities more frequently.
However, if the ordering system is complicated or time-consuming (for example, involving a physical stock check, raising of a handwritten order which is then typed and sent to the supplier, with the consequent checking of stock on delivery and initiating of a manual payment process), it may be preferable to raise large orders infrequently.
And, of course, if stock-outs have costly consequences, it will be necessary to set high safety stock levels in order to satisfy ‘worst case’ demands.
MANAGING CAPABILITY
To finish this chapter, we will look briefly at the issue of staff capability, although we shall reserve a more detailed examination of the topic until Chapter 10.
A traditional organization employed two classes of people: managers and workers. Managers did the thinking and gave orders. Workers did as they were told. If this sounds like a Victorian hierarchy, it is worth recognizing that it was a typical approach in UK manufacturing until well into the 1960s. Indeed, you may also recognize the ‘power culture’, which Charles Handy identifies as characterizing owner-managed businesses and which we describe more fully in Chapter 4.
By contrast, we have already referred in this chapter to multiskilling and the philosophy of involving staff in continuous improvement; monitoring performance and managing change will become evident later in this book.
Nevertheless, it is important to make four points:
![]() Managers can delegate authority but not responsibility. Involving your staff in decisions will necessitate giving them authority to take these decisions. But remember, if things go wrong – you are still responsible!
Managers can delegate authority but not responsibility. Involving your staff in decisions will necessitate giving them authority to take these decisions. But remember, if things go wrong – you are still responsible!
![]() Not all staff want to be involved. ‘That's not my job’ or ‘that's not what I'm paid for’ are valid and understandable responses from staff who were not recruited, and until now have not been expected, to take part in operations management. Managing fear, resentment or abrupt changes in expectations requires considerable time, effort and care.
Not all staff want to be involved. ‘That's not my job’ or ‘that's not what I'm paid for’ are valid and understandable responses from staff who were not recruited, and until now have not been expected, to take part in operations management. Managing fear, resentment or abrupt changes in expectations requires considerable time, effort and care.
![]() Capability is not innate. Most people have the potential to achieve more than they are currently capable of. Never-theless, changing potential into capability requires communication, training, support and encouragement, as we shall see in Chapter 10.
Capability is not innate. Most people have the potential to achieve more than they are currently capable of. Never-theless, changing potential into capability requires communication, training, support and encouragement, as we shall see in Chapter 10.
![]() People are different. Optimum performance varies between individuals. Assuming that all members of staff can reach the same standard is equivalent to assuming that all cars can reach the same top speed! Successful operations management involves assessing individual intelligence, skill, attitude and experience – and allocating tasks accordingly, in order to avoid ‘square pegs in round holes’.
People are different. Optimum performance varies between individuals. Assuming that all members of staff can reach the same standard is equivalent to assuming that all cars can reach the same top speed! Successful operations management involves assessing individual intelligence, skill, attitude and experience – and allocating tasks accordingly, in order to avoid ‘square pegs in round holes’.
The process of managing capability therefore requires answers to the following questions:
![]() Am I recruiting the right staff for the jobs that need doing?
Am I recruiting the right staff for the jobs that need doing?
![]() How can I achieve the best match between tasks and individuals?
How can I achieve the best match between tasks and individuals?
![]() What individual and/or group training do people need?
What individual and/or group training do people need?
![]() How are the people needs of my operation changing?
How are the people needs of my operation changing?
![]() What must I do to accommodate those changes?
What must I do to accommodate those changes?
![]() Must I change the operation?
Must I change the operation?
![]() Or can I change the people?
Or can I change the people?
COMPETENCE SELF-ASSESSMENT
1How effective, efficient and responsive is your operation?
2Against which of these criteria is the shortfall greatest? How can you improve it?
3How close is your operation to maximum capacity? What risks does this bring?
4What more could you do to smooth demand from your customers?
5What more could you do to adjust capacity to match demand?
6Are the physical resources used by your staff suited to the work they do? What changes would you make?
7Map the activity sequence of your operation. Where is there room for improvement?
8How could you improve the accuracy of demand forecasting for your operation?
9What are the drawbacks of your stock control systems? How could you overcome the m?
10How capable are your people of delivering your operation? What changes could you make?