4
REDEFINE KEY METRICS
WE HAVE SO FAR FOCUSED on what you can do for one important constituency, namely, your customers. In competitive capitalist markets, however, companies have other important constituencies, one of the most important being those who provide the capital that fuels investment to begin with. The two are somewhat linked: Absent the ability to create value for customers, investors are unlikely to feel a firm has future growth potential. But creating value for customers does not necessarily imply that a firm is going to create value for its investors. Capturing, not only creating, value is essential to building a good reputation in the capital markets. In this chapter, we will explore techniques for marketbusting by transforming your performance using the lens of the investor. The goal is to create advantages in your markets, but also to have a positive effect on your firm’s stock market capitalization. This is the price of your shares multiplied by the number of shares outstanding, and it is a good simple measure of how the financial markets value your company (we will refer to it as market cap).
Understanding what influences the capital markets’ evaluation of your company’s stock is no mystery: For established industries at least, analysts and the investors they influence tend to look at a well-developed set of ratios or key numbers that tell them how you are doing relative to everybody else in your industry. Let your costs be higher, your asset utilization lower, your inventory turns less frequent, and so on, and you will pay the price in lower assessment of your future potential, often manifest in a lower price-to-earnings ratio (or P/E as it is often called) than your competitors. A low P/E makes a firm vulnerable to all sorts of risks, such as hostile takeover, because it means the company’s stocks are relatively cheap.
So, what are investors looking for? Typically, growth in market cap. How do you demonstrate that you can deliver growth? We believe there are two dominant ways. First, demonstrate that you can outperform your industry on those dimensions of performance that have become well understood by doing things that are different from the competition. Second, demonstrate that you have viable new opportunities for future good performance that make your stocks a good bet—what the academic community refers to as “growth options.”1 What is the scorecard for how well you are doing on these two factors? The scorecard is the set of key metrics that investors use to determine how good you really are.
The lens of the investor relies on two closely related concepts— your firm’s unit of business and the key metrics associated with this unit of business. The unit of business is what you sell. The key metrics tell observers how successful you are at selling it.
Although it isn’t unusual to take your unit of business for granted, it is vitally important to recognize that the unit of business is a strategic choice. The marketbusting moves in this chapter have in common that they involve either dramatically changing a unit of business or dramatically changing the processes used to manage an existing unit.
What Is a Unit of Business?
By unit of business, we mean the fundamental thing that you sell. For manufacturing companies, the traditional unit of business is literally a unit, typically of a product. So companies that manufacture CT scanners, index cards, or compressed gas cylinders charge for the number of those things that customers buy.
In services, the potential units of business are more varied. Typically, professional services firms (law firms, accountancies, consultants) charge for a unit of time, such as a billing day. Time is also the core unit of other service businesses, such as the time spent talking (for telecommunications companies), the length of a stay (for a hotel), or the length of time (for a lease or rental). As an industry develops and matures, most players settle on a common unit of business.
When everyone takes a common unit of business for granted, one route to marketbusting is to change the rules by changing the unit. GE Medical Systems, for example, changed its focus from selling medical devices to selling equipment utilization contracts. The BOC Group went from selling gas molecules to selling a variety of services—including remote plant management and on-site supply services—to its customers. Siemens Medical Systems changed from selling cures for diseases to selling total health management services, including prevention systems. Some consulting firms have moved from a payment model of the traditional retainer or hourly contract to a model that calculates payment based on value generated or even on equity appreciation in the underlying businesses of their clients.
Why is this kind of change important? Because it’s hard for competitors to anticipate, and then very hard for them to match. Competitors are accustomed to anticipating your moves through the lens of an existing way of doing business. When you change your unit of business, they can sometimes entirely overlook what you’re up to. For instance, it’s become commonplace to blame file swapping for the woes of the music business. What has received far less airtime is the impact of readily available music in digital form on businesses such as traditional advertising-supported radio. Indeed, one recent study reported a 25 percent drop in radio-listening time by teens in Canada, coupled with substantial growth in satellite radio station subscriptions, in which people pay to listen, but don’t have to put up with commercials.2 The unit of business in the radio business is thus being redefined—from a unit based on advertising revenue to a unit having to do with the attractiveness of the content the stations provide.
Your unit of business is critically important because it affects how you go to market, how you price, whom you sell to, whom you employ, and how you plan and execute your operations. A firm selling its customers magnetic resonance imaging (MRI) equipment is run and managed very differently from a firm selling its customers MRI utilization contracts, even though both firms feature MRI machines. Different units of business can also lead to paradoxical competitive exchanges: Consider the competition between a firm that gives away software in order to sell proprietary equipment facing off against a competing firm that gives away equipment to lock in long-term software contracts. It’s as if the two companies are playing completely different games, and in a sense they are, because their units of business are different. What becomes interesting in competitive exchange is that each will have built up capabilities that make it very hard to compete on the same ground as the other.
What Is a Key Metric?
A key metric is a measure that captures something about how many units of business you are likely to sell and how much money you will make selling them. We have found that up to 90 percent of the impact you can make on profitability and profit growth stems from managing around seven to ten critical measures. Key metrics tap the key success factors in your strategy—those few things you must get right. Some people refer to them as key performance indicators (KPIs) or critical success factors (CSFs). We really don’t mind what you call them, as long as the term captures the essence of the idea: just a few numbers that explain an awful lot and that a company has to get right.
In the airline industry, for example, one huge cost component is the relatively fixed costs of purchasing and operating planes, reservation systems, and staff. How good the airline is at filling its planes also makes a difference, because unused seating capacity on a flight represents perishable revenues (and hence profits) that can never be recaptured. Consequently, two key metrics that are commonly used by airlines analysts are the fixed cost per passenger mile flown and the passenger yield (meaning the extent to which the seats on the plane are filled).
In insurance, particularly life insurance, premium revenues come in long before the bulk of expenses go out the door as claims. Most competitors earn the bulk of their profits not on their underwriting, but on the investment income that they earn after premiums are received and before losses are claimed. To the extent that few losses are claimed relative to current revenue received, the company will have more to invest in revenue-generating assets and therefore will be more profitable. To the extent that an insurance firm keeps a good handle on administrative expenses, its profits and profit prospects are enhanced. In this industry, therefore, key metrics analysts look at the loss ratio (the proportion of losses claimed to premium revenue received) and the expense ratio (the proportion of sales and general administrative expenses to premium revenue received). Together, these two key metrics form an important combined ratio that investors and analysts examine to compare the performance of one insurance company relative to another.
Retailers operating conventional bricks-and-mortar stores have only so much floor space to display and sell items. This space limitation has for years led analysts to use ratios such as same-store sales (in which sales for one time period at one store are compared to a similar previous time period) and sales per square foot (compared to the stores’ previous record, to the performance of sister stores, or to competitors’ stores). Increased stock turnover means that less money is tied up in working capital, the margin on the item is captured more frequently, and the company can enjoy greater velocity of sales. Thus, another key metric in traditional retail businesses is inventory turns, on an annual (or shorter) basis, meaning the number of times inventory must be restocked.
Figure 4-1 suggests an approach to linking the unit of business with just a few key metrics.
FIGURE 4-1
Associating a Unit of Business with Critical Key Metrics
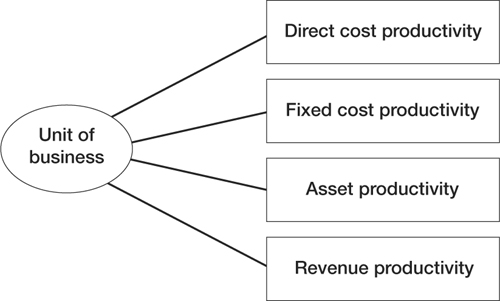
The key metrics lens for marketbusting involves doing two things: (1) either thinking of a way to dramatically improve your performance on key metrics that are already in place; or (2) changing your unit of business and developing a new set of key metrics. Sometimes the major benefit of this approach comes when you can figure out a way to improve customers’ key metrics so that they perceive value from your activities. In both cases, improving key metrics improves your positioning with respect to your investors, ideally leading to improved assessment of your prospects and a higher market cap.
Hunting Down High-Potential Key Metrics
How to find key metrics for marketbusting? Although there is no magic recipe, generally you’ll want to combine insights about your own operations, competitive intelligence, and data from publicly available sources. Here are our “top ten” places to go for the publicly available portion of the key metrics analysis.
- Industry benchmarks.–You’ll find it easy to locate key comparative metrics for companies in mature industries, particularly in the United States. In established industries, time and experience have created a consensus about those industry benchmarks that constitute key metrics. In other countries and for new businesses, it can be harder. For example, businesses based on the Internet are still working out appropriate key metrics. Should the model be fee-for-transaction-based? An advertising model with the infamous “eyeball counts” that characterized the Internet bubble period? Will pricing be fixed or dynamic? Will the unit of business be a standalone offering or will it reflect a combination of products and services? Although this lack of established benchmarks can be frustrating (not to mention confusing), it offers an opportunity. The firm that can shape which key metrics come to represent the way in which its industry or segment is evaluated often enjoys substantial investor appreciation—that is, provided that it follows up on its promises!3
- Analyses of your own company data.–What better way to gain insight that is unique than to leverage your own experience? There are a number of useful techniques (some of which we described in chapter 6 in our earlier book) to develop trend analyses based on your own data.4 Similarly, you can use any number of sensitivity analysis models to determine how you might create future advantage. Analyze your recent income statements and balance sheets and use sensitivity analyses to build a picture of which variables most influence your firm’s profit and profit growth.
- Analysts’ reports.–Look at the reports on your company or industry written by investment bank and stock market analysts to discover the metrics they use. Clues about the key industry profit metrics will appear in their comments about the reasons for industry profits.
- Bankers.–Commercial bankers who specialize in loans for your industry often develop ratios to assess the riskiness of their loans. They also have industry-level data that you can use as benchmarks.
- Industry associations and industry-specialized consulting firms.–If you have an industry association, check to see whether it maintains firm- and industry-level metric data-banks. Also scan association publications for indicators. In some industries, competitors actually supply information to the association in order to facilitate comparisons. The ISO (Insurance Services Office), for instance, compiles data from insurance companies. In other industries, firms have emerged that independently collect benchmark data. Greenwich Associates, an independent company, collects and analyzes data on financial institutions and offers consulting advice. Its annual rankings are considered an authoritative source on the performance of financial institutions.
- Online databanks.–Vast amounts of data are available in online data services such as Value Line, Compustat, and others. The Wharton School has a user-friendly financial analysis service (WRDS) that provides access to many online databases. In addition to publications and analyst reports, many of these databases provide rankings and comparison information.
- Industry-specific Web sites.–Since the commercialization of the Web, any number of industry-specific sites have sprung up with the aim in part of collecting and sharing information as well as doing business. BusinessWeek recently reported that some $3.9 trillion in e-commerce transactions will take place in 2004.5 You will find industry and competitive information on the World Wide Web at industry-specific sites such as e-STEEL, investment sites such as those run by E*Trade, and information-oriented sites such as Hoovers.com.
- The business press.–You can get insights by scanning business publications and the business section of major newspapers and periodicals, notably the Economist. In particular, look for commentaries about why your current industry is cooking or in the doldrums—key clues about the industry profit drivers.
- Books and other publications.–You can sometimes get interesting insights by scanning the business sections of libraries and bookstores and by searching Amazon.com and Barnesandnoble.com for specific industry-level publications.
- Government publications and NGO Web sites.–Federal and international agencies (such as the United Nations or the World Bank) often publish reports on specific industries or sectors (such as the energy or environmental sectors). Many also operate rich Web sites that provide even more information. The United Nations Statistics Division (http://unstats.un.org/unsd), for example, provides access to a vast number of demographic and industry statistics that can help you identify key trends and opportunities.
If all this seems overwhelming, you may want to consider tapping into the talent of people who have been trained to sift through lots of information to distill key insights. People with an MBA degree, for instance, have usually been marched through exercises such as the one we are proposing you undertake and are often quite skilled at data analysis and interpretation. And the good news is that they are often readily available for a reasonable price as summer interns. A “key metrics” type project would make an excellent internship opportunity both for the student and for your company.
A word of warning here that we cannot overemphasize: You do not need highly precise data; instead, you need indicative data. In seeking marketbusting moves you are not interested in marginally improving a key metric. Rather, you are interested in either substantially improving it or completely replacing it, so precision is relatively unimportant. What is crucial is to have convincing evidence that the metrics you are considering are in fact indicative of profits and profit growth at the firm level and the industry level.
Developing a New Unit of Business
It should be easy to determine what your unit of business is. What do you charge for? When you send customers invoices, what do you bill for? Try to spell it out in the simplest terms possible: “We make money by billing our customers or clients for ______.”
When you have figured out what it is that you bill for, you have an opportunity for creativity in figuring out whether there might be a different way to generate profits by selling customers something different from what you sell today. So, if you sell a product, might you instead sell the benefits or services yielded by that product? If you sell a unit of time, might you instead see advantages in selling the results that the customer actually wants, rather than the time it took you to create them (which, quite honestly, they couldn’t care less about)?
Analysts’ use of key metrics presents a challenge: If you decide to change your unit of business, you will face the task of training your analysts to use metrics that are appropriate for the kind of business you seek to operate. Be aware that they will be understandably reluctant to evaluate your business in a new way, because it makes their lives much more difficult to abandon the few predictable key numbers they have used to formulate recommendations.6
With key metrics in hand, you can begin to think through whether you have the potential to make a marketbusting move by changing either the conventional unit of business in your industry or the way performance is measured (or, ideally, both). You can also begin to think through whether you can help customers compete more effectively by changing or improving their key metrics. Let’s illustrate with the intriguing story of a cement company that radically changed its industry.
The Story of CEMEX
Selling cement is hardly the kind of business that (at least for most of us) gets the heart racing at the prospect of heady growth potential. We are thus particularly taken with the strategy of CEMEX, a cement company based in Mexico, for the way it has adroitly exploited a new unit of business and key metrics to create marketbusting opportunities in the cement business. From its roots as a regional player in Mexico only, the company has aggressively driven growth worldwide, with the result that CEMEX is among the top global players in its industry.
When Lorenzo Zambrano joined what was then a regional Mexican cement company in 1968, the firm’s core business involved highly commoditized cement manufacturing plants. When he became CEO in 1985, he inherited a major headache: a chaotic ready-mix concrete business. The problem with ready-mix concrete is that it is perishable; it begins to set almost as soon as it is loaded into the truck. Couple perishability with unpredictable demand, and you have a mess. Uncertainties about the labor supply, traffic, weather, and financing tended to make customers’ need projections unrealistic. So CEMEX could be caught trying to deliver concrete to customers who weren’t ready to use it, while other customers were often caught without concrete when they needed it. Even when customers could anticipate their needs, constant changes made keeping track of contracts and changes to contracts an administrative headache.
The conventional unit of business in the concrete industry is cubic yards of concrete. But this unit of business didn’t reflect the problems either with perishability or with unpredictable customer demand—two factors that really drove performance for CEMEX’s customers. Moreover, the value of the concrete as a commodity pales in comparison with the value to the customer of having the concrete at the right time—delivery and ancillary services are worth far more as a proportion of the customers’ wallet than the concrete itself. This is a situation in which what the company sells is far less important than the activities surrounding it.
Zambrano concluded that he would have to look at the business through a different lens if he was to make strategic headway. He decided to change his focus from the concrete itself to getting paid instead for what customers really valued—having the concrete at the right time. Thus, the focus moved to the extent to which his perishable goods were delivered within a timing window that worked for both his company and his customers—neither delaying his deliveries so long that the ready-mix had to be dumped nor making customers with expensive construction crews lose valuable time waiting for him to deliver.
The question, then, was how to change the way the delivery window was managed. When Zambrano started thinking about this, his company operated six independent concrete-mixing plants, each with an independent fleet of delivery trucks. CEMEX wrestled with unpredictable traffic and problems with raw materials and delivery. Its customers struggled with similar problems in preparing their sites for delivery. The net result was that changes to the agreed-upon delivery schedules were constant, causing losses, stress, and frustration on the part of both customers and supplier.
Zambrano’s solution began with changing the unit of business. Rather than look only at the amount of cement delivered, he resolved to sell (and charge for) cement delivered within a desired delivery window. The original proposal to customers was that after they contracted with CEMEX, they needed to provide only three hours’ notice to arrange delivery. CEMEX guaranteed their supply. In return, customers would pay a bit more for that guarantee than they would pay for cubic yards delivered. More recently, technology initiatives have helped CEMEX to further slash its delivery window from three hours to twenty minutes, making deliveries within that window 98 percent of the time.7
For CEMEX to pull this off, it had to develop entirely new capabilities measured by a new set of key metrics. For insight, the company studied other firms that faced the dilemma of matching supply to unpredictable demand, including emergency call centers, ambulance systems, and parcel carriers such as Federal Express. The CEMEX executives learned several things. First, to succeed in an unpredictable demand situation, they needed systems that could adjust the allocation of resources in real time. Second, workflows needed to account for reciprocal interactions among various operating units so that a change in one part of the system was immediately recognized and adjusted to by the others. And finally, a substantial enabler was digital technology.
These insights led to a major company redesign. CEMEX broke apart its plant-centered model. In the new strategy, production was viewed on a regional basis, with links between plants and trucks created on a digital platform. Mobile communications networks linked plants within a region and coordinated the deliveries by all trucks and the production of ready-mix by all plants. In this way, multiple trucks could be serviced by multiple mixing plants to serve any site, coordinated by a central regional scheduling and communications center. Instead of disruptive change orders, the system allowed CEMEX to adjust, in real time, which trucks were bound where. Customers who unexpectedly needed cement could be served, often by shipments originally destined for customers who had requested delayed delivery. Patterns across the entire region could then be analyzed to diminish the extent to which CEMEX was caught by surprise.
After an initial investment in regional communications centers with mobile phone systems connecting the center to plants and to trucks, the system blossomed into a global communications and scheduling capability comprising three components: a global communications system called CEMEXNET, which links every truck and plant via satellite; a tracking, scheduling, and routing system known as Dynamic Synchronization of Operations, which coordinates customer orders with mixing plant and truck availability; and a digital system that links plants, offices, and customers on the Internet.
This new set of capabilities allows CEMEX to deliver same-day service, unlimited order changes by the customer, and a 98 percent reliability of delivery within a twenty-minute window (compared with the original four hours)—with a discount to customers of 5 percent per five-minute delay! Its new capabilities, coupled with astute leadership and financial acumen, has allowed CEMEX to grow from a regional Mexican firm to the third-largest cement and ready-mix concrete supplier in the world. The company delivers nearly $2 billion worth of cement and ready-mix in thirty countries, primarily in emerging economies where the same scheduling challenges prevail as in Mexico.
Detailed Key Metrics Analysis
The first step in developing a set of key metrics is to construct a table of financials that reflects the basic financial performance parameters of your business and, if you have the data, allows you to compare yourself with the top competitors in your industry.8
Table 4-1 shows the CEMEX example. The first row specifies the unit of business you are using as well as those used by competitors. In the case of the CEMEX ready-mix business, the unit of business is the number of deliveries of truckloads of ready-mix within the specified time window. Your job here is to look first at whether your competitors are using the same or different units of business and to decide whether the time is right to change the rules of the game by changing the unit of business.
Following the specification of the unit of business, the table is divided into four categories. First are the various direct costs that increase as the unit of business increases. In the case of CEMEX, two such costs are the average total cost of ready-mix raw materials and the average total cost of drivers per load discharged. To get the ratio of net revenues to direct costs, which is a measure of direct cost productivity, you divide the average net revenues per load by each of these costs.
If you have data for the competitors, compare your results with competitors’ figures in the remaining columns.9 This will indicate where you are outperforming or underperforming relative to the competition. Brainstorm with your team how you might significantly improve on the best direct cost ratio in each row along with the new skills, assets, and system improvements it would take to do so. If you do not have competitors’ figures, inspect your firm-specific column for the smallest ratios. Think through what prevents you from improving the ratio.
Next, look at the various fixed costs your firm is incurring as you conduct business. For CEMEX, three significant fixed costs are trucking operations overhead, mixing plant overhead, and sales and administration overhead. If you divide these into the gross operating profits of your firm, you will get an indication of your fixed cost productivity; low numbers mean that you are incurring a lot of fixed costs to earn your operating profits. As before, look first across the rows to see where you are under- or outperforming competitors, and brainstorm ideas to radically increase your fixed cost productivity. Assess the new skills, assets, and systems it would take to do it.
TABLE 4-1
CEMEX Key Metric Analysis
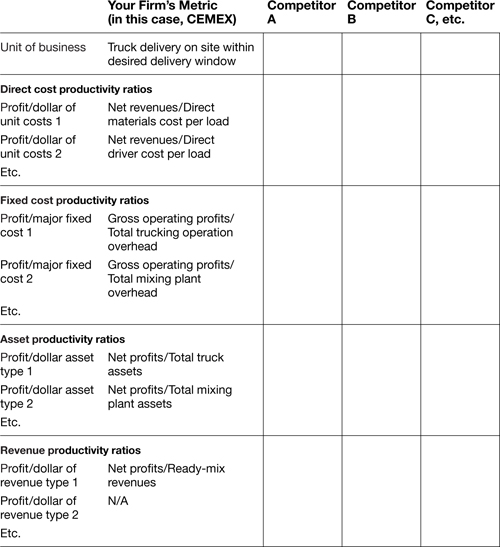
Next, do the same thing for asset productivity and for revenue productivity—the measure of the amount of revenue it takes to generate a dollar of profits.
Fitch Ratings recently credited CEMEX with doing an excellent job of improving its business and financial profile since 1999. Among the strengths noted by the Fitch analyst are CEMEX’s excellent generation of free cash flow, which grew in the period 1999–2001 from $860 million to $1.1 billion. Free cash flow generation is a direct outcome of CEMEX’s highly productive operating model.
Its productivity has allowed CEMEX to rapidly pay down the debt it took on to make acquisitions. Fitch also observes CEMEX’s “solid track record for meeting its financial targets” and its “production cost advantage vis-à-vis most competitors due to its ability to share best-management and operational practices and transfer production technology among its businesses.”10 The advantages generated by CEMEX’s improved key ratios have had significant positive effects on its investment attractiveness.
MarketBuster Prospecting
To begin prospecting for potential marketbusters, it’s useful to have your leadership team brainstorm potential alternatives to your current unit of business. If you sell a product, ask yourself whether it might be bundled with a service. If you sell a component, perhaps you could sell a complete solution. If you sell a service, perhaps some customers might like it delivered as a turn-key activity or priced as a package of modules.
With a list of potential new units of business in hand, see whether you have an opportunity to change your business along the lines of eight patterns we identified among firms that dramatically improved their competitive position by changing what they sold, or dramatically improved the way they did business with an existing unit of business. As before, we’ll continue with the move numbers from the previous chapter. The eight strategic moves are as follows:
Move #13: Radically change the unit of business
Move #14: Radically improve your productivity
Move #15: Improve your cash flow velocity
Move #16: Change the way you use assets
Move #17: Improve your customers’ key metrics
Move #18: Improve your customers’ personal productivity
Move #19: Help improve your customers’ cash flow
Move #20: Help improve your customers’ quality
Move #13: Radically Change the Unit of Business
The first place to prospect for marketbusting moves is to look for an opportunity to rethink the way your industry does business.
Example: Changing the Unit of Business in Television from Sales of Advertising to Sales of User Subscriptions.Often, new technologies or changes in regulations can provide the impetus to rethink the way an industry does business. Consider the evolution of television broadcasting. For many years, TV broadcasting operated on a model in which consumers received free television content that was paid for by advertising shown during the programs (or they paid a flat licensing fee to receive limited programming, as in the United Kingdom). For broadcasters, business was driven largely by the ability of programs to attract mass audiences having desirable demographics, which could then be exploited in advertising sales.
Not long ago, however, innovators such as Ted Turner of Turner Broadcasting System in the United States and Rupert Murdoch of News Corp. came up with a then-heretical idea: What about offering a television service that people would actually pay for on a subscription basis? Skeptics believed that there was no future in such a concept. After all, who would willingly pay for something they could receive for free?
In fits and starts, the satellite and cable-based pay television systems have proven that given the right incentives—such as better reception, more choices of content, access to targeted programming, and the absence of infuriating commercials—people are prepared to pay for television. This dramatically shifted the unit of business from a reliance purely on advertisers to a new model, in which cable and satellite subscriptions provided a solid revenue base that operators could use to build infrastructure and offer new kinds of products. This in turn has created some of the infrastructure on which cable-based Internet-access businesses rely. The point is that altering the basic economic structure of the industry by rethinking the unit of business has led to dramatic new opportunities. As we mentioned earlier, such changes are also evident in the radio business and in other advertising-dependent industries.
Example: Changing the Unit of Business from Promotional Printed Matter to Promotional Services and Solutions. Changes in technology, along with commoditization and aggressive sourcing consolidation by customers, have caused severe price pressure on printers and indeed have sparked many exits from the business. Privately held Madden Communications, however, has escaped the commodity trap by shifting its business definition from providing printing to providing the communications that the printing is designed to create.
In 1988, Madden operated pretty much as a conventional printing house, with a unit of business of individual print jobs. After winning a contract to print one hundred thousand in-store display ads for one of America’s largest food companies, company salesman Jim Donahugh visited a target supermarket to see his product on display. Much to his dismay, the displays were nowhere to be seen, nor were they visible at several other stores he then checked. Donahugh found that this was not unusual at all. Operating on very thin margins and with thousands of stockkeeping units to manage, supermarket owners often didn’t (or couldn’t) take the time to display promotions properly. Donahugh also found out that Madden’s own customers, the packaged goods companies, often overordered promotional materials as insurance against running short. In both cases, the end result was either a failure to communicate with their potential customers or money wasted on printed matter that wasn’t used.
From these insights, Madden developed a direct-to-store printing and shipping program. Instead of buying individual printing jobs, its customers now contract for a long-term promotional arrangement in which Madden prints only the required number of displays and promotional materials and then manages their distribution and installation on-site. Together with its changed unit of business, Madden changed the customers it sought to serve—moving from many smaller customers to a few large ones with whom it could build long-term relationships. The larger customers appreciated and were willing to pay for Madden’s capabilities. Madden naturally had to change the way it did business. From a relatively low-level, standard type of selling, it has now migrated to a partnership position with its customers, in which Madden people try to really understand the customers’ businesses and objectives.
Madden’s revenues grew from $5 million in 1980 to $10 million in 1990 to $120 million in 1997, in an industry many had come to regard as hopelessly mature. Year 2000 sales were $132,429,000. In 2002 Madden generated more than half a million dollars in revenue for each of its two hundred fifty employees.
Prospecting Questions for Changing the Unit of Business
Probe the following questions. Keep at it until you are convinced that you have really gotten people to think.
Can you generate revenues via a different unit of business?
Can you charge for what you offer in a different way?
Can you incur costs and make payments in a different way?
Can you shift the emphasis in how you charge customers from what you traditionally provide to what they might value (for instance, going from a part of a solution to the actual solution)?
Can you create better incentives for your people by changing the unit of business (for instance, going from an incentive system based on business unit performance to one based on the total relationship between your company and your customer)?
Would some other way of charging for what you sell be more convenient, less effortful, or easier to explain to your customers?
Move #14: Radically Improve Your Productivity
Some firms established and sustained strong positions because they achieved consistently superior productivity. With this marketbusting move, your aim is to identify ways to dramatically enhance your key productivity ratios in a way that rivals will find difficult to imitate. Note that here, unlike the previous move of changing your unit of business, you are essentially using the same measurements as others, but achieving better performance. When you can do this in a credible and measurable way, investors notice! These moves have the advantage that they are relatively easy to communicate to the investing community.
Example: Using E-commerce and Supply Chain Solutions to Eliminate Inefficiencies and Boost Productivity.Lamons Gasket Company (http://www.lamonsgasket.com) is the largest manufacturer and distributor of static sealing solutions for the petrochemical, refining, nuclear, OEM, pulp, and paper industries. The company, an $80 million subsidiary of MetalDyne Corporation, manufactures and distributes more than one hundred thousand standard and special-order products, ranging from gaskets to an extensive line of packings, threaded barstock, nuts, bolts, and screws.
Until recently, customer orders were manually entered into the enterprise resource planning (ERP) system. Ken Frigo, Lamons’s executive vice president, observed that “Customers would either phone in or fax an order, using their own language to describe what they needed. One of our thirty customer service representatives would then have to translate this order into the correct Lamons format and part numbers. . . Because an average order is less than $500, this thirty to sixty minutes of manual work to get each order into our systems presented significant costs.”11 Indeed, relative to the value of the sale, this level of inefficiency was devastating to profits. It was also costly to customers. Let’s not forget that someone on the customer side is spending the same thirty to sixty minutes!
Lamons decided to tackle the problem by building an integrated e-commerce Web site. The site enabled customers to find and order goods. The solution allows for customer-specific pricing, lets customers pay for orders with either a credit card or a traditional purchase order, and permits multiple ship-to and bill-to options. In addition to automating the product-selection and order-entry process, having a Web site that was connected to its ERP system enabled Lamons to provide customers with the information they need without having to contact a Lamons customer service representative, something that has led to further reductions in the company’s customer service costs. Lamons achieved an advantage by implementing this solution quickly.12
Prospecting Questions for Radically Improving Productivity
Can you dramatically enhance your productivity by deploying new technology?
- Direct cost productivity
- Fixed cost productivity
- Asset productivity
- Revenue productivity
Can you leapfrog your competition in productivity? Look especially for situations where their resources are already committed to something else (such as integrating a large merger).
Can you eliminate time-wasting repetitive activities to enhance productivity? Can you figure out how to eliminate transaction costs (such as internal reviews and approvals) by automating some of your internal control practices, thus boosting productivity?
A cautionary note is in order, however. Given Lamons’s success, its competitors are sure to emulate this approach to supply and ordering. When they do, the e-commerce solution will no longer differentiate Lamons but instead will become a competitive prerequisite. Then the challenge for the company will be to identify the next major productivity advance if it continues to offer the same things to its customers.
Move #15: Improve Your Cash Flow Velocity
Another move that can give you better profitability is to speed up the cash velocity of your business. Even if you don’t change anything about your business model, speeding everything up can create surprising positive outcomes, because profits can pour in more rapidly. The idea is that the higher your cash flow velocity, the less working capital you need, and the more effectively your assets are used. This will show up as an improvement in key ratios relative to competition.
Example: A Coordinated Attack on Time Lags in the Mortgage Business. American Home Mortgage Holdings (AHMH) has accelerated its cash velocity by building systems that let it take advantage of a boom in home mortgage refinancing. With interest rates at historic lows, there has been a dramatic increase in the availability of debt capital. (For example, the Federal Reserve reports that as of February 2004, a ten-year treasury bond carried an interest rate of around 4 percent.13) Coupled with cheaper money, real estate values increased significantly throughout the 1990s. This combination of contextual factors has made it attractive for many homeowners to use their home equity, often by borrowing against it or by refinancing their mortgages at lower rates. As of this writing, most borrowers can replace their existing financing and harvest 10 to 20 percent over their existing debt with very little change in debt-service coverage.
Historically, AHMH focused on home buyers rather than on refinancing, but it was quick to recognize the opportunities in refinancing and move aggressively to capitalize on them. Aside from representing a large market, refinancers are also attractive because they can be persuaded to refinance, unlike home buyers for whom the activity is linked in time to the purchase of a home. AHMH has identified ways to speed capturing and placing loans throughout the mortgage system. It places deals with large refinancers such as Fannie Mae and the government-owned Freddie Mac, thus enabling profits on the spread between the interest rate charged to consumers and the interest rate it pays to refinancers. Because its systems interact with large refinancers’ systems, it can guarantee credit compliance, place deals, and move the cash quickly. The more deals it can close in the shortest time, the higher its cash flow velocity.
American Home Mortgage also enhances velocity by the use of both highly automated systems and highly focused bricks-and-mortar infrastructure. It originates and sells mortgage loans through its MortgageSelect.com Web site, which provides customers with twenty-four-hour access to interest rates and product terms. At this site customers can also lock in interest rates, file preapproval applications, check the status of pending applications, and obtain credit reports. In addition, the Web site contains calculation tools that determine the affordability of financing, letting potential customers prescreen their qualification for various loan levels. AHMH complements its virtual interface with seventy field offices in several states (although it does a much higher volume of business through electronic mechanisms than it does face to face).
AHMH is forecast to grow at 28 percent per year, a rate that, according to analysts, puts this company in the excellent or outperform category. The company is expected to continue to produce operational results that are well above average, with relatively consistent returns over the long term.
Example: Getting Paid for Accelerating Bad Debt Collection. National Credit Systems (NCS), founded in 1984, has based its entire competitive strategy on the acceleration of cash flows. NCS is an accounts receivable management firm, a polite term for collection agency.
Unlike most collection agencies, NCS does not charge its customers a percentage of the money it can collect for them. Instead, it charges a fee per account of $20. This translates into large client savings relative to its competition, because the average collection agency retains 40 percent of collections as fees, whereas NCS retains a mere 8 percent. Furthermore, any money recovered is sent directly to the client, and therefore NCS does not delay client cash flow.
How can NCS possibly make money by keeping less of what it collects and giving most of its cash flow directly back to customers? The answer lies in the recovery ratio, a key ratio that drives profitability in the world of collections. NCS achieves an unusually high recovery rate of 57 percent compared with the national average of 18 percent. The company has built a powerful set of collections capabilities by rethinking standard practice in its industry. The industry took it for granted that collection effectiveness increased with the cost and complexity of the three major methods of collection. At the low cost and complexity end was sending letters. Next was telephone calling, and finally (the most expensive) was taking legal action. NCS revisited this set of assumptions and came to a surprising conclusion: The least expensive method (letters) was ultimately the most effective—some 80 percent of all bad debt collected in fact came from a transaction initiated by a letter—but incumbent players were not using it very effectively.
Prospecting Questions for Improving Cash Flow Velocity
How might you accelerate the cash flow velocity of your firm? Could you eliminate or reduce inventory?
Might you delay payments to others?
Can you speed up receipts from your customers?
Can you generate cash before you have to incur costs (such as with Dell’s “build to order” computers)?
Can you speed up the ordering cycle of your customers?
Can you get paid more frequently over the lifetime of a contract? Can you automate the payment stream so that manual delays don’t hold up incoming cash?
Can you make sure that your invoicing mechanisms are easy for your customers to respond to, so that you don’t create additional payment delays?
Have you checked to see whether you might link up with customers electronically to speed payments?
Have you explored technologies such as direct-deposit or lock-boxes to speed payments?
NCS succeeded in increasing collection volume, based on the old technology. With high volumes, NCS could charge clients less than the industry standard, further increasing volumes as clients appreciated the better prices. Not only did NCS accelerate its own cash flows, but it also improved the bottom line of its customers by improving their cash flow.
How to Accelerate Cash Flow Velocity
To accelerate cash flows, businesses address the following key areas:
Optimize the sales cycle.
- Allow adjustments for seasonality.
- Harmonize the billing cycles for customers and suppliers.
Optimize collection policies.
- Enhance credit-granting policies.
- Monitor the system to collect receivables on time.
- Control purchases of inputs.
- Place orders systematically.
- Take advantage of trade credit policies and supplier discounts.
Pace payments of payables.
- Extend the employee payroll cycle from weekly to biweekly or monthly.
- Stretch the average payment cycle.
Leverage bank credit policies.
- Monitor how fast sales receipts are credited to bank accounts.
- Establish a line of credit for negative cash flow periods.
- Ensure that loan repayment terms remain “in sync” with the cash flow cycle.
Manage assets efficiently.
- Carry inventory on consignment.
- Assess leasing versus buying assets.
Plan tax strategy.
- Maximize tax reductions and deferrals.
Balance cash flow and profitability objectives.
- Increase sales without increasing collections.
- Rapidly pass on increased costs from suppliers to customers.
- Automatically adjust prices as costs of inputs vary.
Move #16: Change the Way You Use Assets
A powerful area to probe is whether you can do anything differently from others in your industry to reduce asset intensity or to better use those assets that you must have. In most industries, a key metric used to assess performance is return on assets, a direct assessment of how effectively you are using your assets to drive profits.
Example: Using Scale to Reduce Asset Intensity for Both You and Your Customers. Quanta Computers was founded in May 1988 by Chinese entrepreneur Barry Lam to address the challenge of asset intensity facing many notebook computer manufacturers. Lam combined the promise of reducing customers’ assets with the ability to spread Quanta’s asset base across companies worldwide. This strategy successfully fueled the dramatic growth of Quanta as a reliable sales and manufacturing partner to notebook PC vendors such as Apple, Dell, Gateway, and Fujitsu-Siemens.
Quanta has two major asset productivity drivers. First, it serves many customers as a contract manufacturer and design partner, a practice that has the effect of using manufacturing capacity more effectively than any one company could do in-house. Second, Quanta helps its customers reduce their asset intensity by using Quanta to manufacture some or preferably all the components they need. In this way, Quanta has effectively played a two-way game of reducing asset intensity. Sales in 2002 exceeded $4 billion.
Prospecting Questions for Changing the Way You Use Assets
Can you reduce the asset intensity of your business by outsourcing some activities to specialist providers?
Can you eliminate the need to own certain assets?
Can you utilize assets owned by someone else on an as-needed basis?
Can you use assets more effectively—for instance, by extending the time of day in which they are used or by using remote electronics to operate them?
Might you be able to pool your assets with those of other firms and reduce the asset intensity for the whole group?
Can you change fixed assets to variable assets—for instance, by establishing utilization contracts with suppliers for certain services? Can you help your customers reduce their fixed asset burden by taking on their assets and charging them for usage?
Move #17: Improve Your Customers’ Key Metrics
Another powerful application of key metrics analysis is to focus the analysis on helping your customers. Helping your customers improve their performance generates a stronger, more robust, more profitable, more loyal base of clients that are both more willing and more able to buy from you. To the extent that your system is critical to or embedded in the way they do business, you can also achieve a certain amount of competitive sustainability.
How can you figure out how to help your customers? You could start by asking them—they usually can be quite articulate about the pain points in their businesses. Next, you could look at their financial statements and (if appropriate) assessments of them from knowledgeable outside sources, such as stock analysts (see the box earlier in this chapter, Hunting Down High-Potential Key Metrics). When you know what your customers get graded on, consider how you might help them improve their grades.
Can you help your customers improve productivity? Increasingly, this means providing them with tools they can use to take best advantage of the skills, assets, and systems they have in place.
Example: Swiss Re Uses Administrative Reinsurance to Free Up Capital for Insurance Company Clients. A persistent problem for insurance companies is what are termed “closed blocks” of in-force life and health insurance. Because an insurance policy can be in force for a long time, the issuing company can find itself lumbered with decades of obligations that tie up capital which could be put to more strategic uses. Moreover, old books of business are often supported by legacy IT systems, which can easily become an expensive nightmare to maintain and run, also costing the companies money for staff and computer systems they would love to be able to eliminate.
Swiss Re (Swiss Reinsurance Company) has developed a solution for this problem that creates dramatic positive effects for its clients. Through its Admin Re line of business, Swiss Re takes on closed blocks of in-force life and health insurance either by acquiring them outright or by reinsuring them. It then administers the policies using its own proprietary business processes, often partnering with professional administrators to maximize the efficiencies gained. The advantage for customers is that they can eliminate the need to tie up capital to support this business, reduce the personnel costs linked to historical business (which are thus not available to develop new business), and eliminate legacy systems. This shows up for customers as an improvement in their combined ratio (as explained earlier), a key metric used to assess insurance industry performance. In the seven years (as of this writing) that Swiss Re has offered the Admin Re solution, it has grown the numbers of policies managed to over four and a half million, making this service one of the Swiss company’s fastest-growing lines of business.
Prospecting Questions for Improving Customers’ Key Metrics
Have your marketbusting team gather the following information:
What are the key numbers your customers seek to achieve? (Be explicit.)
How do your customers measure this outcome?
What are the key ratios in your customers’ businesses?
What are some ways to
- Help your customers improve their key ratios (financial, operating, investment)? Conceive of a better way to help customers hit the numbers they care about (market share, cash flow, EBITDA, revenue growth, profit)?14
- Help customers better understand what really drives success in their businesses?
Can you find ways to improve your customers’ productivity?
Can you help customers make better use of their assets? Their working capital?
Can you take over some aspect of your customers’ operations that they find burdensome?
Move #18: Improve Your Customers’ Personal Productivity
What asset productivity is to a commercial customer, time saving and convenience are to a consumer. Whenever you can see a way to make something that is irritatingly complex more convenient and quick to accomplish, you may have the seeds of a marketbuster with high potential. Most people can readily recite how well-intentioned companies do things that drive them crazy, usually because they lead them to waste time or induce delays in meeting their objectives. For instance, banks and insurance companies force you to obtain information from third parties before they will do business with you; service desks run you through the “press 1, press 2” voice-mail gauntlet; retail establishments subject you to the same checkout delays whether you are buying a truckload or a single item; companies require that you remember the numbers (order numbers, service tag numbers, customer numbers) that they gave you in the first place; and on and on. Solve the irritations and customers will often gratefully reciprocate by increasing your sales volumes or paying you more.
Example: Simplifying the Process of Obtaining Financial Services by Having Providers Compete for Your Business.–Just as AHMH figured out how to accelerate the process of refinancing, mortgage broker LendingTree built its business on making the process less onerous from a consumer point of view. It uses Web-based technology to dramatically reduce customer acquisition costs and obtain leads on loans. In contrast to the AHMH model, in which the company itself is a broker of mortgages, Lending Tree acts to link networks of mortgage providers to give consumers maximum choice and improve the competitiveness of the offers they consider. They send requests to their network of lenders, who return bids. Consumers can also use the service to choose from a list of mortgages, credit cards, and home equity, auto, and personal loans. Unlike a conventional bank, LendingTree’s model claims to empower borrowers by making lenders apply to them, rather than making borrowers apply to the lender.
Prospecting Questions for Improving Your Customers’ Personal Productivity
Can you change the way you do business to save your customers time?
Can you reduce the number of steps a customer must take to do business with you?
Can you eliminate hassles and annoyances from your transactions (for instance, forcing the customer to repeat information on forms, to collect information from different places, or to get material from third parties before they can do business with you).
Can you create a single point of interface between your company and your customers?
Can you address some customer issues with a single interaction rather than with multiple interactions?
Can you routinize customer-facing activities to make them faster? Can you find ways to improve the personal productivity of your customers’ staff? On the job? In their private lives?
Participating lenders pay a transaction fee upon submitting the loan application and again when the loan is closed. Consumers who use LendingTree do not pay a service fee. From 1998 through 2001, LendingTree processed more than 5 million credit requests and generated $10 billion in transaction volume. In 2003, LendingTree was acquired by InterActive Corp., inspired no doubt by a 74 percent sales increase from 2001 to 2002.
Move #19: Help Improve Your Customers’ Cash Flow
Just as you will look better in the analysts’ eyes by improving your cash flow metrics (see move #15), your customers will look better to their analysts to the extent that they can do the same. Many of the same techniques we described above are applicable here, but instead of trying to get better within your own operations, you are going to try to sell something to customers that helps them improve their cash flows. Alternatively, you might differentiate your company by being the one that allows customers to operate more effectively when they work with you—for instance, by requiring that they stock less inventory or by moving faster on orders received.
Example: Helping Companies Make Better Asset Utilization Decisions. The rapid growth of software company SAS Institute is attributable largely to the accelerating effect it has on customers’ ability to make better decisions faster, thus using their assets more productively. SAS provides integrated enterprise information-delivery and e-business solutions. Among SAS’s remarkable qualities are that it benefits from the lowest employee turnover in its industry and enjoys a 98 percent renewal rate among customers, many of whom could not conceive of doing without its software.
By becoming a true strategic partner in which its developments are driven largely by customer demand for improved operations, SAS has enjoyed a long track record of solid profits. The Institute has a balance sheet free of debt and a projected annual growth rate of more than 20 percent. In 2002 its sales topped $1 billion.
Similar rapid growth has been enjoyed in the whole enterprise resource management area, with firms such as SAP building on clients’ hunger to better utilize their resources to achieve marketbusting outcomes.
Example: Leveraging the Most Time-Intensive Part of the PC Repair Process with Logistics Expertise. Package delivery firm United Parcel Service (UPS) has begun to branch out from its core business of package delivery into an array of businesses, all of which are designed to help customers’ cash flow. Under the rubric “synchronizing commerce,” UPS performs a variety of services that go well beyond the traditional pickup and delivery. One recent move, for instance, has UPS employees doing the repair work for Toshiba laptops. As Mark Simons, a general manager of Toshiba’s digital products division was reported as saying, “Moving a unit around and getting replacement parts consumes most of the time.. . . The actual service only takes about an hour.”15 By taking over both the shipping of warrantee repairs and the repair, UPS eliminates steps in the process, removes the need for PC makers to employ a maintenance staff, integrates the repair and shipping activity, and, most importantly, reduces the time that a broken PC is not in the hands of its owner. Just as the management of CEMEX realized that the time window for cement delivery had value beyond the cement itself, the management of UPS is capitalizing on the fact that the timing of item delivery can have value well beyond the items alone.
Prospecting Questions for Improving Customers’ Cash Flow
Refer to the questions in #15 with respect to your cash flow velocity. Ask also:
Can you change the way you do business to help customers get revenues in more quickly or delay expenditures?
Can you help customers better coordinate their activities to eliminate cash flow losses due to internal inefficiencies?
Can you change the way you do business to make some fixed costs variable for your customers?
Can you eliminate “nuisance” payments for your customers?
Move #20: Help Improve Your Customers’ Quality
Another opportunity for marketbusting concerns improving the quality of your customers’ offerings. If you can do something for customers that lets them credibly claim superior quality or that allows them to provide state-of-the-art quality at a competitive price, you have the potential to gain enormous loyalty, along with all the benefits of becoming embedded as a central element in your customers’ business model. The reason quality is so powerful as a key metric is that it influences many other metrics—for manufactured products, for instance, repairs and returns can have an impact on working capital, employee costs, customer loyalty, and return on assets. Even small improvements in quality that eliminate warrantee repairs can have a substantial follow-on impact.
Example: KLA-Tencor Helps Eliminate Defects in Computer Chips. In the semiconductor business, a hugely important key metric is “yield”—meaning the number of defect-free chips that come out of the manufacturing process. Let yields go down, the profitability of the whole enterprise is hurt. Improve yields, and a company can make more chips for less investment in assets (which is considerable in the semiconductor business; plants can cost upwards of $3 billion each). KLA-Tencor makes equipment and software that can detect defects in silicon wafers. By using the KLATencor process, manufacturers can improve yields throughout their system.
Example: Six Sigma Everything! An entire industry has grown up around a concept pioneered by Motorola, that of dramatically reducing the defects in manufactured products through the rigorous application of statistical process control techniques. The concept has become central to the strategies of many manufacturing organizations, premised on the simple idea that if quality is designed into a process, dramatic improvements in asset utilization and other key metrics will follow.
Prospecting Questions for Improving Customer Quality
Can you redesign the way you do business with customers to help them improve quality metrics?
Can you offer examples or advice to customers to help them improve quality?
Can you offer consulting solutions to improve customer quality (or related concepts such as safety)?
Can you lead your industry in creating more high-quality offerings than it does today?
Can you provide quality-oriented feedback to your customers so that they can respond in real time?
Action Steps for Redefining Key Metrics
Step 1: Identify your own unit of business and associated key metrics.
Step 2: Identify the obstacles that prevent you from achieving higher performance on these key metrics.
Step 3: Assess how you do relative to your competition. Do they use the same metrics? How do you stack up?
Step 4: Determine which customer segments you serve. What are the key metrics that matter to them? How well do you do in helping them achieve desirable results? Could you improve your value to them by offering a different unit of business (for example, by switching from selling a product to selling a more comprehensive solution)?
Step 5: Assess what new capabilities you would need if you were to change units of business. How would you measure success? What are your key assumptions with respect to customer adoption? How will you sell this idea to customers?
Step 6: Decide on a marketing plan. How can you communicate the advantages of this new unit to your customers? To your stock analysts?
Step 7: Carefully examine the implementation challenge. Refer to the DRAT table in chapter 7, and try to identify obvious pitfalls as you roll out this shift in strategy.