
13
Monitoring Kubernetes Clusters
In the previous chapter, we looked at serverless computing and its manifestations on Kubernetes. A lot of innovation happens in this space, and it is both super useful and fascinating to follow the evolution.
In this chapter, we’re going to talk about how to make sure your systems are up and running and performing correctly, and how to respond when they’re not. In Chapter 3, High Availability and Reliability, we discussed related topics. The focus here is on knowing what’s going on in your system and what practices and tools you can use.
There are many aspects to monitoring, such as logging, metrics, distributed tracing, error reporting, and alerting. Practices like auto-scaling and self-healing depend on monitoring to detect that there is a need to scale or to heal.
The topics we will cover in this chapter include:
- Understanding observability
- Logging with Kubernetes
- Recording metrics with Kubernetes
- Distributed tracing with Jaeger
- Troubleshooting problems
The Kubernetes community recognizes the importance of monitoring and has put a lot of effort to make sure Kubernetes has a solid monitoring story. The Cloud Native Computing Foundation (CNCF) is the de-facto curator of cloud-native infrastructure projects. It has graduated twenty projects so far. Kubernetes was the first project to graduate, and out of the early graduated projects, three other projects that graduated more than two years ago are focused on monitoring: Prometheus, Fluentd, and Jaeger. This means that monitoring and observability are the foundation for a large-scale Kubernetes-based system. Before we dive into the ins and out of Kubernetes monitoring and specific projects and tools, we should get a better understanding of what monitoring is all about. A good framework for thinking about monitoring is how observable your system is.
Understanding observability
Observability is a big word. What does it mean in practice? There are different definitions out there and big debates about how monitoring and observability are similar and different. I take the stance that observability is the property of the system that defines what we can tell about the state and behavior of the system right now and historically. In particular, we are interested in the health of the system and its components. Monitoring is the collection of tools, processes, and techniques that we use to increase the observability of the system.
There are different facets of information that we need to collect, record, and aggregate in order to get a good sense of what our system is doing. Those facets include logs, metrics, distributed traces, and errors. The monitoring or observability data is multidimensional and crosses many levels. Just collecting it doesn’t help much. We need to be able to query it, visualize it, and alert other systems when things go wrong. Let’s review the various components of observability.
Logging
Logging is a key monitoring tool. Every self-respecting long-running software must have logs. Logs capture timestamped events. They are critical for many applications like business intelligence, security, compliance, audits, debugging, and troubleshooting. It’s important to understand that a complicated distributed system will have different logs for different components, and extracting insights from logs is not a trivial undertaking.
There are several key attributes to logs: format, storage, and aggregation.
Log format
Logs may come in various formats. Plain text is very common and human-readable but requires a lot of work to parse and merge with other logs. Structured logs are better suitable for large systems because they can be processed at scale. Binary logs make sense for systems that generate a lot of logs as they are more space efficient, but require custom tools and processing to extract their information.
Log storage
Logs can be stored in memory, on the file system, in a database, in cloud storage, sent to a remote logging service, or any combination of these. In the cloud-native world, where software runs in containers, it’s important to pay special attention to where logs are stored and how to fetch them when necessary.
Questions like durability come to mind when containers can come and go. In Kubernetes, the standard output and standard error streams of containers are automatically logged and available, even when the pod terminates. But, issues like having enough space for logs and log rotation are always relevant.
Log aggregation
In the end, the best practice is to send local logs to a centralized logging service that is designed to handle various log formats, persist them as necessary, and aggregate many types of logs in a way that can be queried and reasoned about.
Metrics
Metrics measure some aspects of the system over time. Metrics are time series of numerical values (typically floating point numbers). Each metric has a name and often a set of labels that help later in slicing and dicing. For example, the CPU utilization of a node or the error rate of a service are metrics.
Metrics are much more economical than logs. They require a fixed amount of space per time period that doesn’t ebb and flow with incoming traffic like logs.
Also, since metrics are numerical in nature, they don’t need parsing or transformations. Metrics can be easily combined and analyzed using statistical methods and serve as triggers for events and alerts.
A lot of metrics at different levels (node, container, process, network, and disk) are often collected for you automatically by the OS, cloud provider, or Kubernetes.
But you can also create custom metrics that map to high-level concerns of your system and can be configured with application-level policies.
Distributed tracing
Modern distributed systems often use microservice-based architecture, where an incoming request is bounced between multiple microservices, waits in queues, and triggers serverless functions. When you try to analyze errors, failures, data integrity issues, or performance issues, it is critical to be able to follow the path of a request. This is where distributed tracing comes in.
A distributed trace is a collection of spans and references. You can think of a trace as a directed acyclic graph (DAG) that represents a request’s traversal through the components of a distributed system. Each span records the time the request spent in a given component and references are the edges of the graph that connect one span to the following spans.
Here is an example:

Figure 13.1: The path of a sample distributed trace
Distributed tracing is indispensable for understanding complex distributed systems.
Application error reporting
Error and exception reporting is sometimes done as part of logging. You definitely want to log errors, and looking at logs when things go wrong is a time-honored tradition. However, there are levels for capturing error information that go beyond logging. When an error occurs in one of your applications, it is useful to capture an error message, the location of the error in the code, and the stack trace. This is pretty standard and most programming languages can provide all this information, although stack traces are multi-line and don’t fit well with line-based logs. A useful piece of additional information to capture is the local state in each level of the stack trace. This helps when a problem occurs in a central place but local states, like the number and size of entries in some lists can help identify the root cause.
A central error reporting service like Sentry or Rollbar provides a lot of value specific to errors beyond logging, such as rich error information, context, and user information.
Dashboards and visualization
OK. You’ve done a great job of collecting logs, defining metrics, tracing your requests, and reporting rich errors. Now, you want to figure out what your system or parts of it, are doing. What is the baseline? How does traffic fluctuate throughout the day, week, and on holidays? When the system is under stress, what parts are the most vulnerable?
In a complicated system that involves hundreds and thousands of services and data stores and integrates with external systems, you can’t just look at the raw log files, metrics, and traces.
You need to be able to combine a lot of information and build system health dashboards, visualize your infrastructure, and create business-level reports and diagrams.
You may get some of it (especially for infrastructure) automatically if you’re using cloud platforms. But you should expect to do some serious work around visualization and dashboards.
Alerting
Dashboards are great for humans that want to get a broad view of the system and be able to drill down and understand how it behaves. Alerting is all about detecting abnormal situations and triggering some action. Ideally, your system is self-healing and can recover on its own from most situations. But you should at least report it, so humans can review what happened at their leisure and decide if further action is needed.
Alerting can be integrated with emails, chat rooms, and on-call systems. It is often linked to metrics, and when certain conditions apply, an alert is raised.
Now that we have covered, in general, the different elements involved in monitoring complex systems, let’s see how to do it with Kubernetes.
Logging with Kubernetes
We need to consider carefully our logging strategy with Kubernetes. There are several types of logs that are relevant for monitoring purposes. Our workloads run in containers, of course, and we care about these logs, but we also care about the logs of Kubernetes components like the API server, kubelet, and container runtime.
In addition, chasing logs across multiple nodes and containers is a non-starter. The best practice is to use central logging (a.k.a. log aggregation). There are several options here, which we will explore soon.
Container logs
Kubernetes stores the standard output and standard error of every container. They are available through the kubectl logs command.
Here is a pod manifest that prints the current date and time every 10 seconds:
apiVersion: v1
kind: Pod
metadata:
  name: now
spec:
  containers:
    - name: now
      image: g1g1/py-kube:0.3
      command: ["/bin/bash", "-c", "while true; do sleep 10; date; done"]
We can save it to a file called now-pod.yaml and create it:
$ k apply -f now-pod.yaml
pod/now created
To check out the logs, we use the kubectl logs command:
$ kubectl logs now
Sat Jan  4 00:32:38 UTC 2020
Sat Jan  4 00:32:48 UTC 2020
Sat Jan  4 00:32:58 UTC 2020
Sat Jan  4 00:33:08 UTC 2020
Sat Jan  4 00:33:18 UTC 2020
A few points about container logs. The kubectl logs command expects a pod name. If the pod has multiple containers, you need to specify the container name too:
$ k logs <pod name> -c <container name>
If a deployment or replica set creates multiple copies of the same pod, you can query the logs of all pods in a single call by using a shared label:
k logs -l <label>
If a container crashes for some reason, you can use the kubectl logs -p command to look at logs from the crashed container.
Kubernetes component logs
If you run Kubernetes in a managed environment like GKE, EKS, or AKS, you won’t be able to access Kubernetes component logs directly, but this is expected. You’re not responsible for the Kubernetes control plane. However, the logs of control plane components (like the API server and cluster autoscaler), as well as node components (like the kubelet and container runtime), may be important for troubleshooting issues. Cloud providers often offer proprietary ways to access these logs.
Here are the standard control plane components and their log location if you run your own Kubernetes control plane:
- API server:
/var/log/kube-apiserver.log - Scheduler:
/var/log/kube-scheduler.log - Controller manager:
/var/log/kube-controller-manager.log
The worker node components and their log locations are:
- Kubelet:
/var/log/kubelet.log - Kube proxy:
/var/log/kube-proxy.log
Note that on a systemd-based system, you’ll need to use journalctl to view the worker node logs.
Centralized logging
Reading container logs is fine for quick and dirty troubleshooting problems in a single pod. To diagnose and debug system-wide issues, we need centralized logging (a.k.a. log aggregation). All the logs from our containers should be sent to a central repository and made accessible for slicing and dicing using filters and queries.
When deciding on your central logging approach, there are several important decisions:
- How to collect the logs
- Where to store the logs
- How to handle sensitive log information
We will answer these questions in the following sections.
Choosing a log collection strategy
Logs are collected typically by an agent that is running close to the process generating the logs and making sure to deliver them to the central logging service.
Let’s look at the common approaches.
Direct logging to a remote logging service
In this approach, there is no log agent. It is the responsibility of each application container to send logs to the remote logging service. This is typically done through a client library. It is a high-touch approach and applications need to be aware of the logging target as well as be configured with proper credentials.

Figure 13.2: Direct logging
If you ever want to change your log collection strategy, it will require changes to each and every application (at least bumping to a new version of the library).
Node agent
The node agent approach is best when you control the worker nodes, and you want to abstract away the act of log aggregation from your applications. Each application container can simply write to standard output and standard error and the agent running on each node will intercept the logs and deliver them to the remote logging service.
Typically, you deploy the node agent as a DaemonSet so, as nodes are added or removed from the cluster, the log agent will always be present without additional work.

Figure 13.3: Using a node agent for logging
Sidecar container
The sidecar container is best when you don’t have control over your cluster nodes, or if you use some serverless computing infrastructure to deploy containers but don’t want to use the direct logging approach. The node agent approach is out of the question if you don’t control the node and can’t install the agent, but you can attach a sidecar container that will collect the logs and deliver them to the central logging service. It is not as efficient as the node agent approach because each container will need its own logging sidecar container, but it can be done at the deployment stage without requiring code changes and application knowledge.

Figure 13.4: Using a sidecar container for logging
Now that we covered the topic of log collection, let’s consider how to store and manage those logs centrally.
Cluster-level central logging
If your entire system is running in a single Kubernetes cluster, then cluster-level logging may be a great choice. You can install a central logging service like Grafana Loki, ElasticSearch, or Graylog in your cluster and enjoy a cohesive log aggregation experience without sending your log data elsewhere.
Remote central logging
There are situations where in-cluster central logging doesn’t cut it for various reasons:
- Logs are used for audit purposes; it may be necessary to log to a separate and controlled location (e.g., on AWS, it is common to log to a separate account).
- Your system runs on multiple clusters and logging in each cluster is not really central.
- You run on a cloud provider and prefer to log into the cloud platform logging service (e.g., StackDriver on GCP or CloudWatch on AWS).
- You already work with a remote central logging service like SumoLogic or Splunk and you prefer to continue using them.
- You just don’t want the hassle of collecting and storing log data.
- Cluster-wide issues can impact your log collection, storage, or access and impede your ability to troubleshoot them.
Logging to a remote central location can be done by all methods: direct logging, node agent logging, or sidecar logging. In all cases, the endpoint and credentials to the remote logging service must be provided, and the logging is done against that endpoint. In most cases, this will be done via a client library that hides the details from the applications. As for system-level logging, the common method is to collect all the necessary logs by a dedicated logging agent and forward them to the remote logging service.
Dealing with sensitive log information
OK. We can collect the logs and send them to a central logging service. If the central logging service is remote, you might need to be selective about which information you log.
For example, personally identifiable information (PII) and protected health information (PHI) are two categories of information that you probably shouldn’t log without making sure access to the logs is properly controlled.
It is common to redact or remove PII like user names and emails from log statements.
Using Fluentd for log collection
Fluentd (https://www.fluentd.org) is an open source CNCF-graduated project. It is considered best in class in Kubernetes, and it can integrate with pretty much every logging backend you want. If you set up your own centralized logging solution, I recommend using Fluentd. Fluentd operates as a node agent. The following diagram shows how Fluentd can be deployed as a DaemonSet in a Kubernetes cluster:

Figure 13.5: Deploying Fluentd as a DaemonSet in a Kubernetes cluster
One of the most popular DIY centralized logging solutions is ELK, where E stands for ElasticSearch, L stands for LogStash, and K stands for Kibana. On Kubernetes, EFK (where Fluentd replaces LogStash) is very common.
Fluentd has plugin-based architecture so don’t feel limited to EFK. Fluentd doesn’t require a lot of resources, but if you really need a high-performance solution, Fluentbit (http://fluentbit.io/) is a pure forwarder that uses barely 450 KB of memory.
We have covered a lot of ground about logging. Let’s look at the next piece of the observability story, which is metrics.
Collecting metrics with Kubernetes
Kubernetes has a Metrics API. It supports node and pod metrics out of the box. You can also define your own custom metrics.
A metric contains a timestamp, a usage field, and the time range in which the metric was collected (many metrics are accumulated over a time period). Here is the API definition for node metrics:
type NodeMetrics struct {
    metav1.TypeMeta
    metav1.ObjectMeta
    Timestamp metav1.Time
    Window    metav1.Duration
    Usage corev1.ResourceList
}
// NodeMetricsList is a list of NodeMetrics.
type NodeMetricsList struct {
    metav1.TypeMeta
    // Standard list metadata.
    // More info: https://git.k8s.io/community/contributors/devel/sig-architecture/api-conventions.md#types-kinds
    metav1.ListMeta
    // List of node metrics.
    Items []NodeMetrics
}
The usage field type is ResourceList, but it’s actually a map of a resource name to a quantity:
// ResourceList is a set of (resource name, quantity) pairs.
type ResourceList map[ResourceName]resource.Quantity
A Quantity represents a fixed-point number. It allows easy marshaling/unmarshaling in JSON and YAML, and accessors such as String() and Int64():
type Quantity struct {
    // i is the quantity in int64 scaled form, if d.Dec == nil
    i int64Amount

    // d is the quantity in inf.Dec form if d.Dec != nil
    d infDecAmount
    // s is the generated value of this quantity to avoid recalculation
    s string
    // Change Format at will. See the comment for Canonicalize for more details.
    Format
}
Monitoring with the Metrics Server
The Kubernetes Metrics Server implements the Kubernetes Metrics API.
You can deploy it with Helm:
$ helm repo add metrics-server https://kubernetes-sigs.github.io/metrics-server/
$ helm upgrade --install metrics-server metrics-server/metrics-server
Release "metrics-server" does not exist. Installing it now.
NAME: metrics-server
LAST DEPLOYED: Sun Oct  9 14:11:54 2022
NAMESPACE: default
STATUS: deployed
REVISION: 1
TEST SUITE: None
NOTES:
***********************************************************************
* Metrics Server                                                      *
***********************************************************************
  Chart version: 3.8.2
  App version:   0.6.1
  Image tag:     k8s.gcr.io/metrics-server/metrics-server:v0.6.1
***********************************************************************
On minikube, you can just enable it as an add-on:
$ minikube addons enable metrics-server
    ▪ Using image k8s.gcr.io/metrics-server/metrics-server:v0.4.2
  The 'metrics-server' addon is enabled
Note that at the time of writing, there was an issue with the Metrics Server on minikube, which was fixed in Kubernetes 1.27 (see https://github.com/kubernetes/minikube/issues/13969).
We will use a kind cluster to deploy the metrics-server.
After a few minutes to let the metrics server collect some data, you can query it using these commands for node metrics:
$ k get --raw "/apis/metrics.k8s.io/v1beta1/nodes" | jq .
{
  "kind": "NodeMetricsList",
  "apiVersion": "metrics.k8s.io/v1beta1",
  "metadata": {},
  "items": [
    {
      "metadata": {
        "name": "kind-control-plane",
        "creationTimestamp": "2022-10-09T21:24:12Z",
        "labels": {
          "beta.kubernetes.io/arch": "arm64",
          "beta.kubernetes.io/os": "linux",
          "kubernetes.io/arch": "arm64",
          "kubernetes.io/hostname": "kind-control-plane",
          "kubernetes.io/os": "linux",
          "node-role.kubernetes.io/control-plane": "",
          "node.kubernetes.io/exclude-from-external-load-balancers": ""
        }
      },
      "timestamp": "2022-10-09T21:24:05Z",
      "window": "20.022s",
      "usage": {
        "cpu": "115537281n",
        "memory": "47344Ki"
      }
    }
  ]
}
In addition, the kubectl top command gets its information from the metrics server:
$ k top nodes
NAME                 CPU(cores)   CPU%   MEMORY(bytes)   MEMORY%
kind-control-plane   125m         3%     46Mi            1%
We can also get metrics for pods:
$ k top pods -A
NAMESPACE            NAME                                         CPU(cores)   MEMORY(bytes)
default              metrics-server-554f79c654-hw2c7              4m           18Mi
kube-system          coredns-565d847f94-t8knf                     2m           12Mi
kube-system          coredns-565d847f94-wdqzx                     2m           14Mi
kube-system          etcd-kind-control-plane                      24m          28Mi
kube-system          kindnet-fvfs7                                1m           7Mi
kube-system          kube-apiserver-kind-control-plane            43m          339Mi
kube-system          kube-controller-manager-kind-control-plane   18m          48Mi
kube-system          kube-proxy-svdc6                             1m           11Mi
kube-system          kube-scheduler-kind-control-plane            4m           21Mi
local-path-storage   local-path-provisioner-684f458cdd-24w88      2m           6Mi
The metrics server is also the source of performance information in the Kubernetes dashboard.
The rise of Prometheus
Prometheus (https://prometheus.io/) is yet another graduated CNCF open source project. It focuses on metrics collection and alert management. It has a simple yet powerful data model for managing time-series data and a sophisticated query language. It is considered best in class in the Kubernetes world. Prometheus lets you define recording rules that are fired at regular intervals and collect data from targets. In addition, you can define alerting rules that evaluate a condition and trigger alerts if the condition is satisfied.
It has several unique features compared to other monitoring solutions:
- The collection system is pulled over HTTP. Nobody has to push metrics to Prometheus (but push is supported via a gateway).
- A multidimensional data model (each metric is a named time series with a set of key/value pairs attached to each data point).
- PromQL: A powerful and flexible query language to slice and dice your metrics.
- Prometheus server nodes are independent and don’t rely on shared storage.
- Target discovery can be dynamic or via static configuration.
- Built-in time series storage, but supports other backends if necessary.
- Built-in alert manager and the ability to define alerting rules.
The following diagram illustrates the entire system:

Figure 13.6: Prometheus architecture
Installing Prometheus
Prometheus is a complex beast, as you can see. The best way to install it is using the Prometheus operator (https://github.com/prometheus-operator/). The kube-prometheus (https://github.com/prometheus-operator/kube-prometheus) sub-project installs the operator itself, and a lot of additional components, and configures them in a robust manner.
The first step is cloning the git repo:
$ git clone https://github.com/prometheus-operator/kube-prometheus.git
Cloning into 'kube-prometheus'...
remote: Enumerating objects: 17062, done.
remote: Counting objects: 100% (185/185), done.
remote: Compressing objects: 100% (63/63), done.
remote: Total 17062 (delta 135), reused 155 (delta 116), pack-reused 16877
Receiving objects: 100% (17062/17062), 8.76 MiB | 11.63 MiB/s, done.
Resolving deltas: 100% (11135/11135), done.
Next, the setup manifests install several CRDs and creates a namespace called monitoring:
$ kubectl create -f manifests/setup
customresourcedefinition.apiextensions.k8s.io/alertmanagerconfigs.monitoring.coreos.com created
customresourcedefinition.apiextensions.k8s.io/alertmanagers.monitoring.coreos.com created
customresourcedefinition.apiextensions.k8s.io/podmonitors.monitoring.coreos.com created
customresourcedefinition.apiextensions.k8s.io/probes.monitoring.coreos.com created
customresourcedefinition.apiextensions.k8s.io/prometheuses.monitoring.coreos.com created
customresourcedefinition.apiextensions.k8s.io/prometheusrules.monitoring.coreos.com created
customresourcedefinition.apiextensions.k8s.io/servicemonitors.monitoring.coreos.com created
customresourcedefinition.apiextensions.k8s.io/thanosrulers.monitoring.coreos.com created
namespace/monitoring created
Now, we can install the manifests:
$ kubectl create -f manifests
...
The output is too long to display, but let’s examine what was actually installed. It turns out that it installed multiple deployments, StatefulSets, a DaemonSet, and many services:
$ k get deployments -n monitoring
NAME                  READY   UP-TO-DATE   AVAILABLE   AGE
blackbox-exporter     1/1     1            1           3m38s
grafana               1/1     1            1           3m37s
kube-state-metrics    1/1     1            1           3m37s
prometheus-adapter    2/2     2            2           3m37s
prometheus-operator   1/1     1            1           3m37s
$ k get statefulsets -n monitoring
NAME                READY   AGE
alertmanager-main   3/3     2m57s
prometheus-k8s      2/2     2m57s
$ k get daemonsets -n monitoring
NAME            DESIRED   CURRENT   READY   UP-TO-DATE   AVAILABLE   NODE SELECTOR            AGE
node-exporter   1         1         1       1            1           kubernetes.io/os=linux   4m4s
$ k get services -n monitoring
NAME                    TYPE        CLUSTER-IP      EXTERNAL-IP   PORT(S)                      AGE
alertmanager-main       ClusterIP   10.96.231.0     <none>        9093/TCP,8080/TCP            4m25s
alertmanager-operated   ClusterIP   None            <none>        9093/TCP,9094/TCP,9094/UDP   3m35s
blackbox-exporter       ClusterIP   10.96.239.94    <none>        9115/TCP,19115/TCP           4m25s
grafana                 ClusterIP   10.96.80.116    <none>        3000/TCP                     4m24s
kube-state-metrics      ClusterIP   None            <none>        8443/TCP,9443/TCP            4m24s
node-exporter           ClusterIP   None            <none>        9100/TCP                     4m24s
prometheus-adapter      ClusterIP   10.96.139.149   <none>        443/TCP                      4m24s
prometheus-k8s          ClusterIP   10.96.51.85     <none>        9090/TCP,8080/TCP            4m24s
prometheus-operated     ClusterIP   None            <none>        9090/TCP                     3m35s
prometheus-operator     ClusterIP   None            <none>        8443/TCP                     4m24s
This is a high-availability setup. As you can see, Prometheus itself is deployed as a StatefulSet with two replicas, and the alert manager is deployed as a StatefulSet with three replicas.
The deployments include the blackbox-exporter, Grafana for visualizing the metrics, kube-state-metrics to collect Kubernetes-specific metrics, the Prometheus adapter (a compatible replacement to the standard Kubernetes Metrics Server), and finally, the Prometheus operator.
Interacting with Prometheus
Prometheus has a basic web UI that you can use to explore its metrics. Let’s do port forwarding to localhost:
$ k port-forward -n monitoring statefulset/prometheus-k8s 9090
Forwarding from 127.0.0.1:9090 -> 9090
Forwarding from [::1]:9090 -> 9090
Then, you can browse to http://localhost:9090, where you can select different metrics and view raw data or graphs:
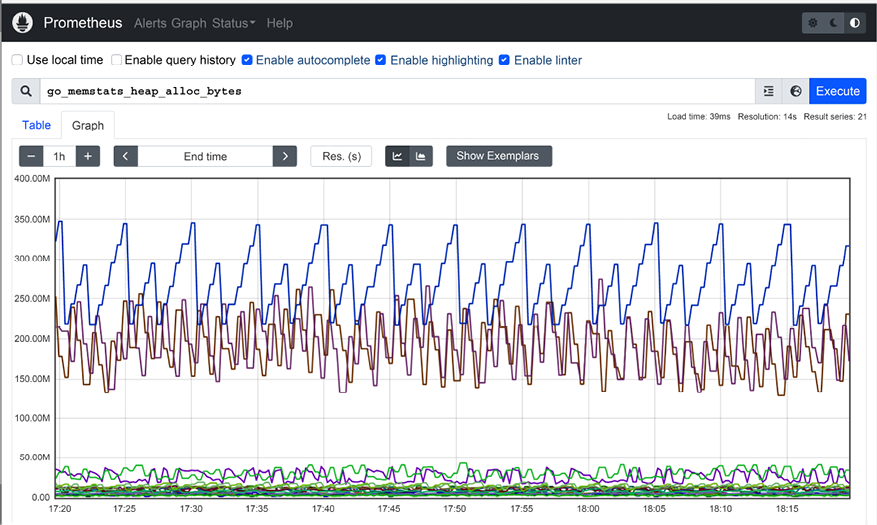
Figure 13.7: Prometheus UI
Prometheus records an outstanding number of metrics (9090 in my current setup). The most relevant metrics on Kubernetes are the metrics exposed by the kube-state-metrics and node exporters.
Incorporating kube-state-metrics
The Prometheus operator already installs kube-state-metrics. It is a service that listens to Kubernetes events and exposes them through a /metrics HTTP endpoint in the format Prometheus expects. So, it is a Prometheus exporter.
This is very different from the Kubernetes metrics server, which is the standard way Kubernetes exposes metrics for nodes and pods and allows you to expose your own custom metrics too. The Kubernetes metrics server is a service that periodically queries Kubernetes for data and stores it in memory. It exposes its data through the Kubernetes Metrics API. The Prometheus adapter adapts the Kubernetes metrics server information and exposes it in Prometheus format.
The metrics exposed by kube-state-metrics are vast. Here is the list of the groups of metrics, which is pretty massive on its own. Each group corresponds to a Kubernetes API object and contains multiple metrics:
CertificateSigningRequestMetricsConfigMapMetricsCronJobMetricsDaemonSetMetricsDeploymentMetricsEndpointMetricsHorizontalPodAutoscalerMetricsIngressMetricsJobMetricsLimitRangeMetricsMutatingWebhookConfigurationMetricsNamespaceMetricsNetworkPolicyMetricsNodeMetricsPersistentVolumeMetricsPersistentVolumeClaimMetricsPodDisruptionBudgetMetricsPodMetricsReplicaSetMetricsReplicationControllerMetricsResourceQuotaMetricsSecretMetricsServiceMetricsStatefulSetMetricsStorageClassMetricsValidatingWebhookConfigurationMetricsVerticalPodAutoscalerMetricsVolumeAttachmentMetrics
For example, here are the metrics collected for Kubernetes services:
kube_service_infokube_service_labelskube_service_createdkube_service_spec_type
Utilizing the node exporter
kube-state-metrics collects node information from the Kubernetes API server, but this information is pretty limited. Prometheus comes with its own node exporter, which collects tons of low-level information about the nodes. Remember that Prometheus may be the de-facto standard metrics platform on Kubernetes, but it is not Kubernetes-specific. For other systems that use Prometheus, the node exporter is super important. On Kubernetes, if you manage your own nodes, this information can be invaluable too.
Here is a small subset of the metrics exposed by the node exporter:
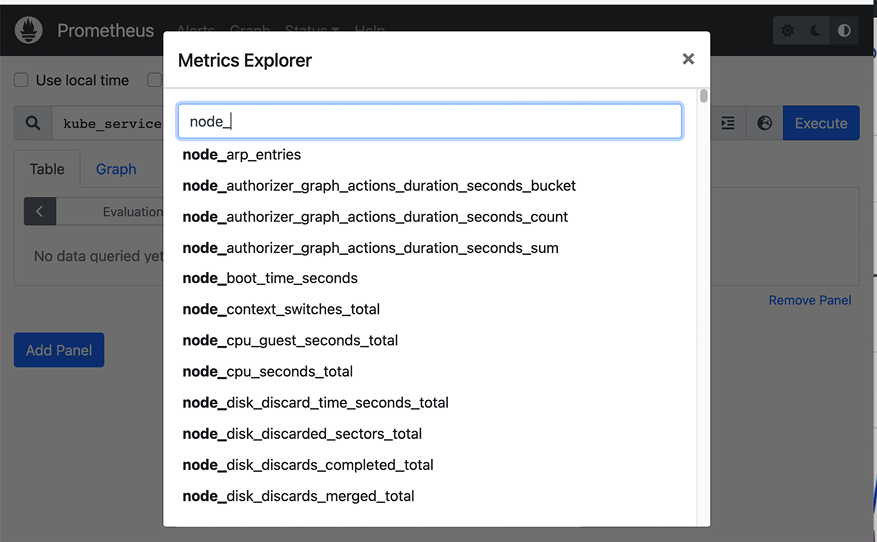
Figure 13.8: Node exporter metrics
Incorporating custom metrics
The built-in metrics, node metrics, and Kubernetes metrics are great, but very often, the most interesting metrics are domain-specific and need to be captured as custom metrics. There are two ways to do it:
- Write your own exporter and tell Prometheus to scrape it
- Use the Push gateway, which allows you to push metrics into Prometheus
In my book Hands-On Microservices with Kubernetes (https://www.packtpub.com/product/hands-on-microservices-with-kubernetes/9781789805468), I provide a full-fledged example of how to implement your own exporter from a Go service.
The Push gateway is more appropriate if you already have a push-based metrics collector in place, and you just want to have Prometheus record those metrics. It provides a convenient migration path from other metrics collection systems to Prometheus.
Alerting with Alertmanager
Collecting metrics is great, but when things go south (or ideally, BEFORE things go south), you want to get notified. In Prometheus, this is the job of the Alertmanager. You can define rules as expressions-based metrics, and when those expressions become true, they trigger an alert.
Alerts can serve multiple purposes. They can be handled automatically by a controller that is responsible for mitigating specific problems, they can wake up a poor on-call engineer at 3 am, they can result in an email or group chat message, or any combination of these.
The Alertmanager lets you group similar alerts into a single notification, inhibiting notifications if other alerts are already firing and silencing alerts. All those features are useful when a large-scale system is in trouble. The stakeholders are aware of the situation and don’t need repeated alerts or multiple variations of the same alert to fire constantly while troubleshooting and trying to find the root cause.
One of the cool things about the Prometheus operator is that it manages everything in CRDs. That includes all the rules, including the alert rules:
$ k get prometheusrules -n monitoring
NAME                              AGE
alertmanager-main-rules           11h
grafana-rules                     11h
kube-prometheus-rules             11h
kube-state-metrics-rules          11h
kubernetes-monitoring-rules       11h
node-exporter-rules               11h
prometheus-k8s-prometheus-rules   11h
prometheus-operator-rules         11h
Here is the NodeFilesystemAlmostOutOfSpace alert that checks if available disk space for the file system on the node is less than a threshold for 30 minutes. If you notice, there are two almost identical alerts. When the available space drops below 5%, a warning alert is triggered. However, if the space drops below 3%, then a critical alert is triggered. Note the runbook_url field, which points to a page that explains more about the alert and how to mitigate the problem:
$ k get prometheusrules node-exporter-rules -n monitoring -o yaml | grep NodeFilesystemAlmostOutOfSpace -A 14
    - alert: NodeFilesystemAlmostOutOfSpace
      annotations:
        description: Filesystem on {{ $labels.device }} at {{ $labels.instance }}
          has only {{ printf "%.2f" $value }}% available space left.
        runbook_url: https://runbooks.prometheus-operator.dev/runbooks/node/nodefilesystemalmostoutofspace
      expr: |
        (
          node_filesystem_avail_bytes{job="node-exporter",fstype!=""} / node_filesystem_size_bytes{job="node-exporter",fstype!=""} * 100 < 5
        and
          node_filesystem_readonly{job="node-exporter",fstype!=""} == 0
        )
      for: 30m
      labels:
        severity: warning
    - alert: NodeFilesystemAlmostOutOfSpace
      annotations:
        description: Filesystem on {{ $labels.device }} at {{ $labels.instance }}
          has only {{ printf "%.2f" $value }}% available space left.
        runbook_url: https://runbooks.prometheus-operator.dev/runbooks/node/nodefilesystemalmostoutofspace
        summary: Filesystem has less than 3% space left.
      expr: |
        (
          node_filesystem_avail_bytes{job="node-exporter",fstype!=""} / node_filesystem_size_bytes{job="node-exporter",fstype!=""} * 100 < 3
        and
          node_filesystem_readonly{job="node-exporter",fstype!=""} == 0
        )
      for: 30m
      labels:
        severity: critical
Alerts are very important, but there are cases where you want to visualize the overall state of your system or drill down into specific aspects. This is where visualization comes into play.
Visualizing your metrics with Grafana
You’ve already seen the Prometheus Expression browser, which can display your metrics as a graph or in table form. But we can do much better. Grafana (https://grafana.com) is an open source monitoring system that specializes in stunningly beautiful visualizations of metrics. It doesn’t store the metrics itself but works with many data sources, and Prometheus is one of them. Grafana has alerting capabilities, too. When working with Prometheus, you may prefer to rely on its Alertmanager.
The Prometheus operator installs Grafana and configures a large number of useful Kubernetes dashboards. Check out this beautiful dashboard of Kubernetes capacity:

Figure 13.9: Grafana dashboard
To access Grafana, type the following commands:
$ k port-forward -n monitoring deploy/grafana 3000
Forwarding from 127.0.0.1:3000 -> 3000
Forwarding from [::1]:3000 -> 3000
Then you can browse to http://localhost:3000 and have some fun with Grafana. Grafana requires a username and password. The default credentials are admin for the user and admin for the password.
Here are some of the default dashboards that are configured when deploying Grafana via kube-prometheus:

Figure 13.10: Default Grafana Dashboards
As you can see, the list is pretty extensive, but you can define your own dashboards if you want. There are a lot of fancy visualizations you can create with Grafana. I encourage you to explore it further. Grafana dashboards are stored as config maps. If you want to add a custom dashboard, just add a config map that contains your dashboard spec. There is a dedicated sidecar container watching new config maps being added and it will make sure to add your custom dashboard.
You can also add dashboards via the Grafana UI.
Considering Loki
If you like Prometheus and Grafana and you didn’t settle on a centralized logging solution yet (or if you’re unhappy with your current logging solution), then you should consider Grafana Loki (https://grafana.com/oss/loki/). Loki is an open source project for log aggregation inspired by Prometheus. Unlike most log aggregation systems, it doesn’t index the log contents but rather a set of labels applied to the log. That makes it very efficient. It is still relatively new (started in 2018), so you should evaluate if it fits your needs before making the decision to adopt it. One thing is sure: Loki has excellent Grafana support.
There are several advantages for Loki compared to a solution like EFK when Prometheus is used as the metrics platform. In particular, the set of labels you use to tag your metrics will serve just as well to tag your logs. Also, the fact that Grafana is used as a uniform visualization platform for both logs and metrics is useful.
We have dedicated a lot of time to discussing metrics on Kubernetes. Let’s talk about distributed tracing and the Jaeger project.
Distributed tracing with Kubernetes
In a microservice-based system, every request may travel between multiple microservices calling each other, wait in queues, and trigger serverless functions. To debug and troubleshoot such systems, you need to be able to keep track of requests and follow them along their path.
Distributed tracing provides several capabilities that allow the developers and operators to understand their distributed systems:
- Distributed transaction monitoring
- Performance and latency tracking
- Root cause analysis
- Service dependency analysis
- Distributed context propagation
Distributed tracing often requires the participation of the applications and services instrumenting endpoints. Since the microservices world is polyglot, multiple programming languages may be used. It makes sense to use a shared distributed tracing specification and framework that supports many programming languages. Enter OpenTelemetry.
What is OpenTelemetry?
OpenTelemetry (https://opentelemetry.io) is an API specification and a set of frameworks and libraries in different languages to instrument, collect, and export logs, metrics, and traces. It was born by merging the OpenCensus and OpenTracing projects in May 2019. It is also an incubating CNCF project. OpenTelemetry is supported by multiple products and became a de-facto standard. It can collect data from a variety of open source and commercial sources. Check out the full list here: https://github.com/open-telemetry/opentelemetry-collector-contrib/tree/main/receiver.
By using a product that complies with OpenTelemetry, you are not locked in, and you will work with an API that may be familiar to your developers.
There are instrumentation libraries for pretty much all the mainstream programming languages:
- C++
- .NET
- Erlang/Elixir
- Go
- Java
- JavaScript
- PHP
- Python
- Ruby
- Rust
- Swift
OpenTelemetry tracing concepts
We will focus here on the tracing concept of OpenTelemetry and skip the logging and metrics concepts we covered earlier.
The two main concepts are Span and Trace.
A Span is the basic unit of work or operation. It has a name, start time, and duration. Spans can be nested if one operation starts another operation. Spans propagate with a unique ID and context. The Trace is an acyclic graph of Spans that originated from the same request and shares the same context. A Trace represents the execution path of a request throughout the system. The following diagram illustrates the relationship between a Trace and Spans:

Figure 13.11: The relationship between Traces and Spans in OpenTelemetry
Now that we understand what OpenTelemetry is about, let’s take a look at the Jaeger project.
Introducing Jaeger
Jaeger (https://www.jaegertracing.io/) is yet another CNCF-graduated project, just like Fluentd and Prometheus. It completes the trinity of CNCF-graduated observability projects for Kubernetes. Jaeger was developed originally by Uber and quickly became the forerunner distributed tracing solution for Kubernetes.
There are other open-source distributed tracing systems like Zipkin (https://zipkin.io) and SigNoz (https://signoz.io). The inspiration for most of these systems (as well as Jaeger) is Google’s Dapper (https://research.google.com/pubs/pub36356.html). Cloud platforms provide their own tracers, like AWS X-Ray. There are also multiple commercial products in the space:
- Aspecto (https://www.aspecto.io)
- Honeycomb (https://www.honeycomb.io)
- Lightstep (http://lightstep.com)
Jaeger’s strong points are:
- Scalable design
- Supports multiple protocols – OpenTelemetry, OpenTracing, and Zipkin
- Light memory footprint
- Agents collect metrics over UDP
- Advanced sampling control
Jaeger architecture
Jaeger is a scalable system. It can be deployed as a single binary with all its components and store the data in memory, but also as a distributed system where spans and traces are stored in persistent storage.
Jaeger has several components that collaborate to provide a world-class distributed tracing experience. The following diagram illustrates the architecture:

Figure 13.12: Jaeger architecture
Let’s understand the purpose of each component.
Client libraries
Originally, Jaeger had its own client libraries that implemented the OpenTracing API in order to instrument a service or application for distributed tracing. Now, Jaeger recommends using the OpenTelemetry client libraries. The Jaeger client libraries have been retired.
Jaeger agent
The agent is deployed locally to each node. It listens to spans over UDP – which makes it pretty performant – batches them and sends them in bulk to the collector. This way, services don’t need to discover the collector or worry about connecting to it. Instrumented services simply send their spans to the local agent. The agent can also inform the client about sampling strategies.
Jaeger collector
The collector receives traces from all the agents. It is responsible for validating and transforming the traces. It then sends the traces to a data store to a Kafka instance, which enables async processing of traces.
Jaeger ingester
The ingester indexes the traces for easy and performant queries later and stores them in the data store, which can be a Cassandra or Elasticsearch cluster.
Jaeger query
The Jaeger query service is responsible for presenting a UI to query the traces and the spans that the collector put in storage.
That covers Jaeger’s architecture and its components. Let’s see how to install and work with it.
Installing Jaeger
There are Helm charts to install Jaeger and the Jaeger operator:
$ helm repo add jaegertracing https://jaegertracing.github.io/helm-charts
"jaegertracing" has been added to your repositories
$ helm search repo jaegertracing
NAME                            CHART VERSION   APP VERSION DESCRIPTION
jaegertracing/jaeger            0.62.1          1.37.0      A Jaeger Helm chart for Kubernetes
jaegertracing/jaeger-operator   2.36.0          1.38.0      jaeger-operator Helm chart for Kubernetes
The Jaeger operator requires cert-manager, but doesn’t install it automatically. Let’s install it first:
$ helm repo add jetstack https://charts.jetstack.io
"jetstack" has been added to your repositories
$ helm install
  cert-manager jetstack/cert-manager
  --namespace cert-manager
  --create-namespace
  --version v1.9.1
  --set installCRDs=true
NAME: cert-manager
LAST DEPLOYED: Mon Oct 17 10:28:43 2022
NAMESPACE: cert-manager
STATUS: deployed
REVISION: 1
TEST SUITE: None
NOTES:
cert-manager v1.9.1 has been deployed successfully!
In order to begin issuing certificates, you will need to set up a ClusterIssuer
or Issuer resource (for example, by creating a 'letsencrypt-staging' issuer).
More information on the different types of issuers and how to configure them
can be found in our documentation:
https://cert-manager.io/docs/configuration/
For information on how to configure cert-manager to automatically provision
Certificates for Ingress resources, take a look at the `ingress-shim`
documentation:
https://cert-manager.io/docs/usage/ingress/
Now, we can install the Jaeger operator into the observability namespace:
$ helm install jaeger jaegertracing/jaeger-operator
       -n observability --create-namespace
NAME: jaeger
LAST DEPLOYED: Mon Oct 17 10:30:58 2022
NAMESPACE: observability
STATUS: deployed
REVISION: 1
TEST SUITE: None
NOTES:
jaeger-operator is installed.
Check the jaeger-operator logs
  export POD=$(kubectl get pods -l app.kubernetes.io/instance=jaeger -l app.kubernetes.io/name=jaeger-operator --namespace observability --output name)
  kubectl logs $POD --namespace=observability
The deployment is called jaeger-jaeger-operator:
$ k get deploy -n observability
NAME                     READY   UP-TO-DATE   AVAILABLE   AGE
jaeger-jaeger-operator   1/1     1            1           3m21s
Now, we can create a Jaeger instance using the Jaeger CRD. The operator watches for this custom resource and creates all the necessary resources. Here is the simplest possible Jaeger configuration. It uses the default AllInOne strategy, which deploys a single pod that contains all the components (agent, collector, query, ingester, and Jaeger UI) and uses in-memory storage. This is suitable for local development and testing purposes:
$ cat <<EOF | k apply -f -
apiVersion: jaegertracing.io/v1
kind: Jaeger
metadata:
  name: simplest
  namespace: observability
EOF
jaeger.jaegertracing.io/simplest created
$ k get jaegers -n observability
NAME       STATUS   VERSION   STRATEGY   STORAGE   AGE
simplest                                           5m54s
Let’s bring up the Jaeger UI:
$ k port-forward deploy/simplest 8080:16686 -n observability
Forwarding from 127.0.0.1:8080 -> 16686
Forwarding from [::1]:8080 -> 16686
Now, we can browse to http://localhost:8080 and see the Jaeger UI:

Figure 13.13: Jaeger UI
In the next chapter, Chapter 14, Utilizing Service Meshes, we will see more of Jaeger and how to use it specifically to trace requests going through the mesh. Now, let’s turn our attention to troubleshooting using all the monitoring and observability mechanisms we discussed.
Troubleshooting problems
Troubleshooting a complex distributed system is no picnic. Abstractions, separation of concerns, information hiding, and encapsulation are great during development, testing, and when making changes to the system. But when things go wrong, you need to cross all those boundaries and layers of abstraction from the user action in their app, through the entire stack, all the way to the infrastructure, crossing all the business logic, asynchronous processes, legacy systems, and third-party integrations. This is a challenge even with large monolithic systems, but even more so with microservice-based distributed systems. Monitoring will assist you, but let’s talk first about preparation, processes, and best practices.
Taking advantage of staging environments
When building a large system, developers work on their local machines (ignoring the cloud development environment here) and, eventually, the code is deployed to the production environment. But there are a few steps between those two extremes. Complex systems operate in an environment that is not easy to duplicate locally.
You should test changes to code or configuration in an environment that is similar to your production environment. This is your staging environment, where you should catch most problems that can’t be caught by the developer running tests locally in their development environment.
The software delivery process should accommodate the detection of bad code and configuration as early as possible. But, sometimes, bad changes will be detected only in production and cause an incident. You should have an incident management process in place as well, which typically involves reverting to the previous version of whatever component caused the issue and then trying to find the root cause by looking at logs, metrics, and traces – sometimes, by debugging in the staging environment too.
But, sometimes, the problem is not with your code or configuration. In the end, your Kubernetes cluster runs on nodes (yes, even if it’s managed), and those nodes can suffer many issues.
Detecting problems at the node level
In Kubernetes’ conceptual model, the unit of work is the pod. However, pods are scheduled on nodes. When it comes to monitoring and the reliability of the infrastructure, the nodes are what require the most attention, as Kubernetes itself (the scheduler, replica sets, and horizontal pod autoscalers) takes care of the pods. The kubelet is aware of many issues on the nodes and it will update the API server. You can see the node status and if it’s ready using this command:
$ k describe no kind-control-plane | grep Conditions -A 6
Conditions:
  Type             Status  LastHeartbeatTime                 LastTransitionTime                Reason                       Message
  ----             ------  -----------------                 ------------------                ------                       -------
  MemoryPressure   False   Fri, 21 Oct 2022 01:09:33 -0700   Mon, 17 Oct 2022 10:27:24 -0700   KubeletHasSufficientMemory   kubelet has sufficient memory available
  DiskPressure     False   Fri, 21 Oct 2022 01:09:33 -0700   Mon, 17 Oct 2022 10:27:24 -0700   KubeletHasNoDiskPressure     kubelet has no disk pressure
  PIDPressure      False   Fri, 21 Oct 2022 01:09:33 -0700   Mon, 17 Oct 2022 10:27:24 -0700   KubeletHasSufficientPID      kubelet has sufficient PID available
  Ready            True    Fri, 21 Oct 2022 01:09:33 -0700   Mon, 17 Oct 2022 10:27:52 -0700   KubeletReady                 kubelet is posting ready status
Note the last condition, Ready. This means that Kubernetes can schedule pending pods to this node.
But, there might be problems that the kubelet can’t detect. Some of the problems are:
- Bad CPU
- Bad memory
- Bad disk
- Kernel deadlock
- Corrupt filesystem
- Problems with the container runtime (e.g., Docker daemon)
We need another solution. Enter the node problem detector.
The node problem detector is a pod that runs on every node. It needs to solve a difficult problem. It must be able to detect various low-level problems across different environments, different hardware, and different operating systems. It must be reliable enough not to be affected itself (otherwise, it can’t report on problems), and it needs to have a relatively low overhead to avoid spamming the control plane. The source code is at https://github.com/kubernetes/node-problem-detector.
The most natural way is to deploy the node problem detector as a DaemonSet, so every node always has a node problem detector running on it. On Google’s GKE clusters, it runs as an add-on.
Problem daemons
The problem with the node problem detector (pun intended) is that there are too many problems that it needs to handle. Trying to cram all of them into a single codebase can lead to a complex, bloated, and never-stabilizing codebase. The design of the node problem detector calls for the separation of the core functionality of reporting node problems to the master from the specific problem detection. The reporting API is based on generic conditions and events. The problem detection should be done by separate problem daemons (each in its own container). This way, it is possible to add and evolve new problem detectors without impacting the core node problem detector. In addition, the control plane may have a remedy controller that can resolve some node problems automatically, therefore implementing self-healing.
At this time, problem daemons are baked into the node problem detector binary, and they execute as Goroutines, so you don’t get the benefits of the loosely-coupled design just yet. In the future, each problem daemon will run in its own container.
In addition to problems with nodes, the other area where things can break down is networking. The various monitoring tools we discussed earlier can help us identify problems across the infrastructure, in our code, or with third-party dependencies.
Let’s talk about the various options in our toolbox, how they compare, and how to utilize them for maximal effect.
Dashboards vs. alerts
Dashboards are purely for humans. The idea of a good dashboard is to provide, at one glance, a lot of useful information about the state of the system or a particular component. There are many user experience elements to designing good dashboards, just like designing any user interface. Monitoring dashboards can cover a lot of data across many components, over long time periods, and may support drilling down into finer and finer levels of detail.
Alerts, on the other hand, are periodically checking certain conditions (often based on metrics) and, when triggered, can either result in automatic resolution of the cause of the alert or eventually notify a human, who will probably start the investigation by looking at some dashboards.
Self-healing systems can handle certain alerts automatically (or ideally, resolve the issue before an alert is even raised). Humans will typically be involved in troubleshooting. Even in cases where the system automatically recovered from a problem at some point, a human will review the actions the system took and verify that the current behavior, including the automatic recovery from problems, is adequate.
In many cases, severe problems (a.k.a. incidents) discovered by humans looking at dashboards (not scalable) or notified by alerts will require some investigation, remediation, and later, post-mortem. In all those stages, the next layer of monitoring comes into play.
Logs vs metrics vs. error reports
Let’s understand where each of these tools excels and how to best combine their strengths to debug difficult problems. Let’s assume we have good test coverage and our business/domain logic code is by and large correct. We run into problems in the production environment. There could be several types of problems that happen only in production:
- Misconfiguration (production configuration is incorrect or out of date)
- Infrastructure provisioning
- Insufficient permissions and access to data, services, or third-party integrations
- Environment-specific code
- Software bugs that are exposed by production inputs
- Scalability and performance issues
That’s quite a list and it’s probably not even complete. Typically, when something goes wrong, it is in response to some change. What kind of changes are we talking about? Here are a few:
- Deployment of a new version of the code
- Dynamic re-configuration of a deployed application
- New users or existing users changing the way they interact with the system
- Changes to the underlying infrastructure (e.g., by the cloud provider)
- A new path in the code is utilized for the first time (e.g., fallback to another region)
Since there is such a broad spectrum of problems and causes, it is difficult to suggest a linear path to resolution. For example, if the failure caused an error, then looking at an error report might be the best starting point. But, if the issue is that some action that was supposed to happen didn’t happen, then there is no error to look at. In this case, it might make sense to look at the logs and compare them to the logs from a previous successful request. In case of infrastructure or scalability problems, metrics may give us the best initial insight.
The bottom line is that debugging distributed systems requires using multiple tools together in the pursuit of the ever-elusive root cause.
Of course, in distributed systems with lots of components and microservices, it is not even clear where to look. This is where distributed tracing shines and can help us narrow down and identify the culprit.
Detecting performance and root cause with distributed tracing
With distributed tracing in place, every request will generate a trace with a graph of spans. Jaeger uses sampling of 1/1000 by default so, once in a blue moon, issues might escape it, but for persistent problems, we will be able to follow the path of a request, see how long each span takes, and if the processing of a request bails out for some reason, it will be very easy to notice. At this point, you’re back to the logs, metrics, and errors to hunt the root cause.
As you can see, troubleshooting problems in a complex system like Kubernetes is far from trivial. You need comprehensive observability in place including logging, metrics, and distributed tracing. You also need deep knowledge and understanding of your system to be able to configure, monitor, and mitigate issues quickly and reliably.
Summary
In this chapter, we covered the topics of monitoring, observability, and troubleshooting. We started with a review of the various aspects of monitoring: logs, metrics, error reporting, and distributed tracing. Then, we discussed how to incorporate monitoring capabilities into your Kubernetes cluster. We looked at several CNCF projects, like Fluentd for log aggregation, Prometheus for metrics collection and alert management, Grafana for visualization, and Jaeger for distributed tracing. Then, we explored troubleshooting large distributed systems. We realized how difficult it can be and why we need so many different tools to conquer the issues.
In the next chapter, we will take it to the next level and dive into service meshes. I’m super excited about service meshes because they take much of the complexity related to cloud-native microservice-based applications and externalize them outside of the microservices. That has a lot of real-world value.
Join us on Discord!
Read this book alongside other users, cloud experts, authors, and like-minded professionals.
Ask questions, provide solutions to other readers, chat with the authors via. Ask Me Anything sessions and much more.
Scan the QR code or visit the link to join the community now.
https://packt.link/cloudanddevops
