
Chapter 13: Security Monitoring and Reporting
In this chapter, we will review the methods that are used for reporting and monitoring endpoints within the environment. Throughout this book, we've provided recommendations that help secure and harden Windows environments by enforcing baselines and security controls. After these controls are in place, proper monitoring should be established to ensure application availability, storage alerting, track assets and inventory, and identify weaknesses and vulnerabilities in the underlying software and operating systems. Many products are available that can help provide these insights, so let's review where they can be found based on the solutions we've discussed throughout this book.
First, we will review the features of Microsoft Defender for Endpoint (MDE). We will cover the MDE dashboards that are used to report on threats, inventory software, and identify weaknesses in the software and configurations on your endpoints. We will cover onboarding Windows clients into MDE, configuring the data connector to Intune, and assigning device-based compliance policies based on the MDE machine risk score. After that, we will discuss collecting telemetry data in Log Analytics workspaces and using gallery solutions and Azure Workbooks to enhance the data to build reporting dashboards.
Later in this chapter, we will provide an overview of enabling vulnerability management with Microsoft Defender for Cloud. We will learn about the services it provides and the methods available to onboard Windows servers. Next, we will review the reporting capabilities in Microsoft Endpoint Manager (MEM). We will review the different reporting types available in MEM and cover how to collect MDM diagnostic logs both remotely and from the clients. Finally, we will provide an overview of monitoring the application health and update status of Office apps using the Microsoft 365 Apps admin center.
In this chapter, we will cover the following topics:
- MDE features
- Onboarding Windows clients into MDE
- Collecting telemetry with Azure Monitor Logs
- Monitoring with Azure Monitor and activity logs
- Overview of Microsoft Defender for Cloud
- Reporting in MEM
- Monitoring the health and update status of Office apps
Technical requirements
To complete this chapter, we recommend the following minimum requirements:
- An Azure subscription and tenant
- Microsoft Defender for Endpoint licensing
- Microsoft Endpoint Manager licensing
- Microsoft 365 Apps admin center
- An Azure Log Analytics workspace and automation account
- Microsoft Defender for Cloud
Let's start by reviewing the features in Microsoft Defender for Endpoint and the dashboards that can help monitor and protect your endpoints.
MDE features
MDE is part of the Microsoft 365 Defender suite of security products. It provides full Endpoint Detection and Response (EDR) capabilities with a focus on protecting connected endpoints. When combined, the M365 Defender suite protects four domains (application, identity, endpoint, and data), allowing threat signals to be viewed holistically by adding context that paints a clearer picture of the security threat. For example, Microsoft Defender for Office (MDO) can alert when a user clicks on a phishing link in an email. This threat can then be correlated and investigated in MDE by looking at the device event timeline, using advanced hunting, or reviewing any relevant alerts to understand the potential impact. Security teams can easily add any malicious domains that have been identified to the IOC list, thus blocking connections from the endpoints and automatically purge emails targeting other users using MDO. By analyzing near-real-time telemetry data, MDE can further correlate similar activity seen across multiple endpoints and group alerts into an incident, should the phishing email get delivered and clicked on by multiple users. Through automation and remediation, connections from the endpoint can automatically be blocked and the alerts can be resolved without the need for human intervention. The built-in MDE dashboards can easily be incorporated into any Security Operations Center (SOC) workflow or connected to other SIEMs through API connectors.
The capabilities of the MDE solution can be broken down into the following areas:
- Threat and vulnerability management (TVM) discovers vulnerabilities and misconfigurations across your endpoints and prioritizes recommendations based on analysis from the Microsoft Intelligent Security Graph. TVM provides real-time detection and response insights and determines the overall device exposure score of your organization.
- Attack surface reduction (ASR) helps reduce the potential attack surface by using controls that leverage hardware-based security and advanced software protection features such as application control, exploit protection, network protection, and controlled folder access.
- Next-generation antivirus brings machine learning, analytics, and threat-resistance research from the cloud to Defender Antivirus. Next-generation features offer near-real-time protection against new and emerging threats and can detect and block attacks automatically.
- EDR refers to the use of sensors to detect near-real-time events and create alerts based on suspicious activities. EDR correlates alerts across endpoints into incidents that can be tracked and actioned by the SOC or with automation. Through advanced features, security teams can build custom threat detection queries, track progress with remediation requests, and submit files for deep analysis by using a secure sandboxed environment.
- Automated investigation and remediation allows MDE to use automation based on insights from common alerts and known attack techniques to auto-remediate alerts without requiring the security team's interaction.
- Microsoft Threat Experts is an additional managed service offering that allows security teams to consult with a Microsoft security expert directly from the MDE portal.
- Management and APIs allow you to manage security-related features on devices in Intune through Endpoint Security. API connectors allow SIEM solutions to be integrated using the Defender for Endpoint APIs.
Let's review the different dashboards in more detail and see how they can be used for monitoring. To sign into the Microsoft 365 Defender portal, go to https://security.microsoft.com. Most of the dashboards can be found under Endpoints in the left navigation pane.
The Threat analytics dashboard
The Threat analytics dashboard provides an overview of any current and emerging threats and analyzes how devices in your organization could potentially be impacted. Within each threat, you can view if there are active alerts that would indicate an attack, the total number of affected assets, and any misconfigurations that could leave devices vulnerable. Each threat provides an executive summary report from Microsoft threat intelligence and lists any exposures and mitigations that can be correlated from Defender security products. The following screenshot shows the Threat analytics dashboard showing the latest and high-impact threats:

Figure 13.1 – The Threat analytics dashboard in MDATP
More information on Threat analytics can be found at https://docs.microsoft.com/en-us/microsoft-365/security/defender-endpoint/threat-analytics?view=o365-worldwide.
Next, let's review the TVM dashboard.
The TVM dashboard
The TVM dashboard displays an analysis of the collected EDR data and calculates exposure and configuration scores based on recommendations from Microsoft security best practices. The lower the exposure score, the less vulnerable your devices are to security threats. Selecting Show more under Top security recommendations will provide a list of actionable security recommendations to help secure devices and improve your devices' Secure Score. The higher the secure score, the better that devices are protected against security threats. The TVM dashboard also includes a Device exposure distribution pie chart to help you quickly view devices by their associated machine risk level. Risk levels are broken down into high, medium, low, and informational. The Threat & Vulnerability Management dashboard can be found under Endpoints, on the Microsoft 365 Defender portal. The following screenshot shows the overall exposure score of your devices, top security recommendations, and threat awareness pane analyzing devices exposed to a high-impact threat:
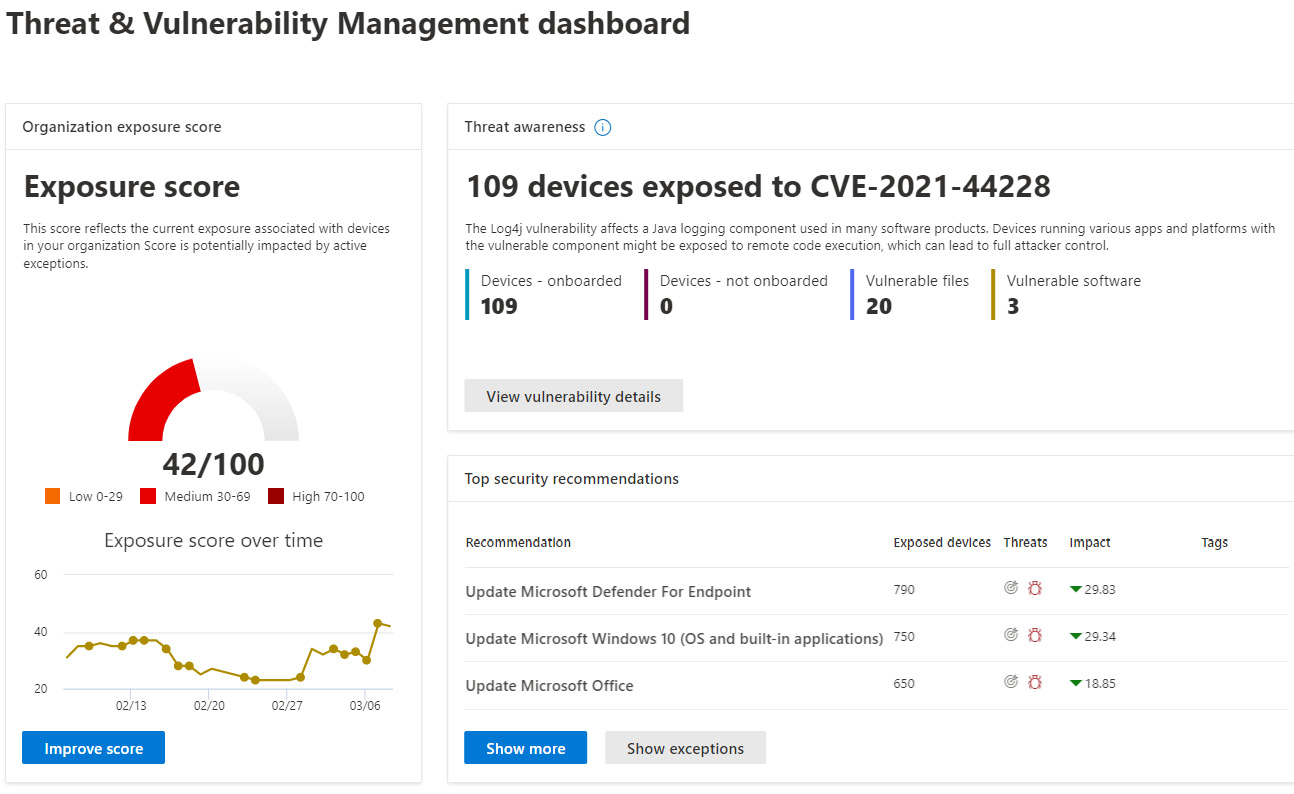
Figure 13.2 – Threat & Vulnerability Management dashboard
The following screenshot of the TVM dashboard shows Microsoft Secure Score for Devices and the Device exposure distribution pie chart, where you can quickly view devices based on their machine risk level:
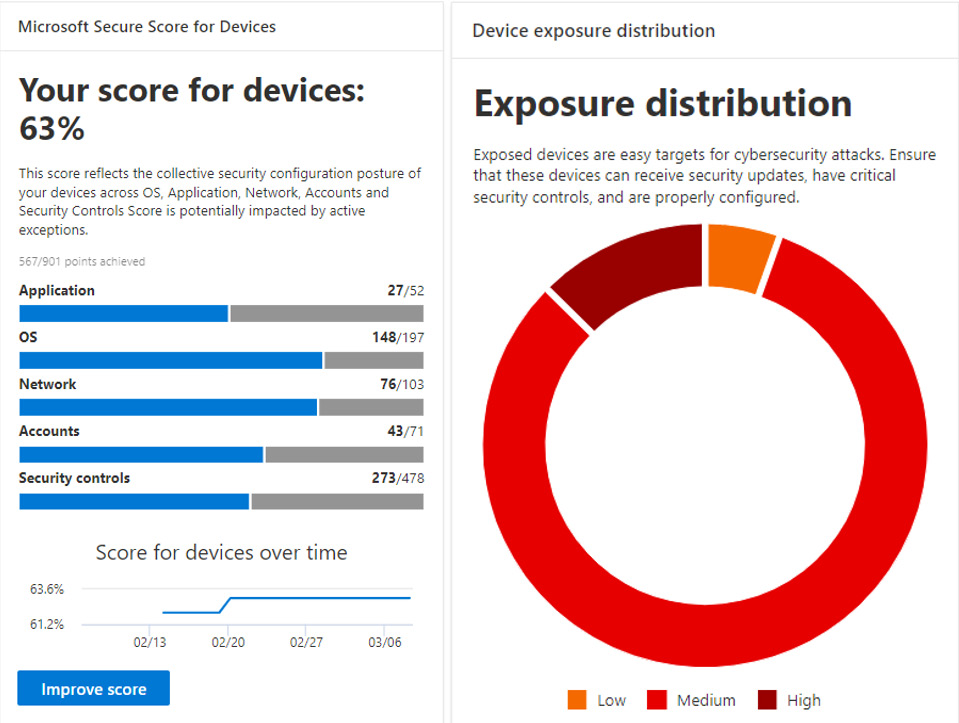
Figure 13.3 – Secure Score and Exposure distribution
To learn more about the Threat & Vulnerability Management dashboard, visit https://docs.microsoft.com/en-us/microsoft-365/security/defender-endpoint/tvm-dashboard-insights?view=o365-worldwide.
Next, let's look at viewing the MDE Device Inventory dashboard.
Device Inventory dashboard
The Device Inventory dashboard lists all devices that have been onboarded into MDE and those discovered through device discovery and network assessment scans. Device discovery leverages active onboarded devices to find unmanaged devices on the same network. There are many filtering options available for sorting the device inventory list, including risk and exposure level, OS platform, Windows version, sensor health, onboarding status, and antivirus status. The following screenshot shows the Device Inventory dashboard, which includes a filter for OS platform on Windows 11 devices:

Figure 13.4 – Device Inventory
Device Inventory can be found under Endpoints in the Microsoft 365 Defender portal. To learn more about Device Inventory, visit https://docs.microsoft.com/en-us/microsoft-365/security/defender-endpoint/machines-view-overview?view=o365-worldwide.
Next, let's review the Device health and compliance report.
Device health and compliance
The Device health and compliance report allows you to visually monitor the health state of your devices and track trends based on sensor activity, antivirus status, and OS platforms and versions. The following screenshot shows Health state information about sensor data activity across all endpoints onboarded into MDE:

Figure 13.5 – Device health and compliance
To view the Device health and compliance report, from the Microsoft 365 Defender portal, choose Reports, and click Device health and compliance.
For more information, visit https://docs.microsoft.com/en-us/microsoft-365/security/defender-endpoint/machine-reports?view=o365-worldwide.
Next, let's look at the Software inventory report.
Software inventory report
MDE includes an inventory report of software that has been identified on onboarded devices. The report includes details identifying the software by name and version, as well as reports on any detected vulnerabilities or known weaknesses. For any identified weakness, you can quickly view the count of exposed devices and export a list if needed. Selecting a software title from the list will pull up additional details, including a link to the software page, where you can track security recommendations, version distributions, known vulnerabilities, and an inventory of devices with the software installed. The Software inventory report leverages the EDR data as its discovery source. The following screenshot shows an example of the Software inventory report in MDE. By default, it's sorted by the software with the highest impact score, which affects the Device exposure and Secure Scores parts of the TVM dashboard:

Figure 13.6 – Software inventory
For more information about how the Software inventory report works, visit https://docs.microsoft.com/en-us/microsoft-365/security/defender-endpoint/tvm-software-inventory?view=o365-worldwide.
Next, let's look at the Security recommendations dashboard.
Security recommendations
The Security recommendations dashboard helps by prioritizing security misconfigurations by assigning an impact score and provides actionable steps to remediate the weakness. By default, the recommendations are sorted by highest to lowest impact rating, and resolving them will help increase your secure score and reduce the overall exposure score. Clicking each recommendation offers more details, including a general overview with a short description, any associated CVEs, and a list of exposed devices:

Figure 13.7 – Security recommendations
From this dashboard, you can use filters to sort by remediation types to help narrow down the list of recommendations. For example, by selecting Configuration change, you can view recommendations that advise implementing additional security controls that can help harden your endpoints.
Security recommendations can be found in the M365 Defender portal under Endpoints by clicking on Recommendations. The list of top security recommendations is also listed in the TVM dashboard.
Identifying weakness
The Weaknesses dashboard provides an overview of the latest emerging threats and vulnerabilities known to Microsoft security intelligence. It's another method of gaining insights into active threat types and assessing the exposure risk to your devices based on the weaknesses these vulnerabilities use to achieve the exploit. The dashboard provides the CVE name, a severity rating, CVSS score, the impacted software, threat published date, and the number of exposed devices. Clicking on each CVE will provide a short description of the vulnerability and additional threat insights, such as if a publicly known exploit is available. From the CVE overview, clicking on Go to related security recommendation will link back to the Security recommendations dashboard and filter the list of software affected by the CVE:

Figure 13.8 – The Weaknesses dashboard
The filters in the Weaknesses dashboard can help narrow down results that are important to focus on first. For example, you can show only critical severity threats, weaknesses that have open active alerts in MDE, or exploits that are known to be publicly available and verified in the wild. The Weaknesses dashboard can be found under the Endpoints section on the M365 Defender portal home page.
Reviewing advanced features
MDE is frequently adding new features to enhance the protection capabilities of the product. Often, they are not enabled by default once generally available. These features include configuring connections to other third-party security solutions and configuring service connections to enable telemetry data in other Microsoft products. We recommended reviewing the Advanced features area of MDE regularly to check for newly added functionality that could help enhance the EDR protection capabilities. To view the options in the Microsoft 365 Defender portal, go to https://security.microsoft.com, choose Settings, click on Endpoints, and select Advanced features under General.
To learn more about Advanced features, visit https://docs.microsoft.com/en-us/microsoft-365/security/defender-endpoint/advanced-features?view=o365-worldwide.
Next, let's look at configuring API connectors for programmatic access to MDE.
Configuring API connectors
MDE allows access to its data and control management actions by connecting partner applications through programmatic APIs. This flexibility allows other security solutions to analyze and aggregate MDE security event data, help orchestrate and automate actions based on threats, and cross-analyze telemetry for enhanced threat intelligence not limited to Microsoft. To view the list of approved partner applications, including links to the integration documentation, log in to the Microsoft 365 Defender portal and click on Partner applications under Partners and APIs within the Endpoints section. A few of the available providers are as follows:
- Splunk
- HP ArcSight
- IBM QRadar
- Demisto
- ServiceNow
- BETTER Mobile
- Palo Alto Networks
Access to the APIs is configured securely through Azure AD app registration using the OAuth 2.0 authorization code flow and is granted consent with both user and application context, depending on the API endpoints you wish to make available. After the connection has been configured with a partner application, you can view the connectivity status from the Microsoft 365 Defender portal by clicking on Partners and APIs under Endpoints and then clicking on Connected applications. The following screenshot shows a list of connected applications and request trends over the last 30 days:
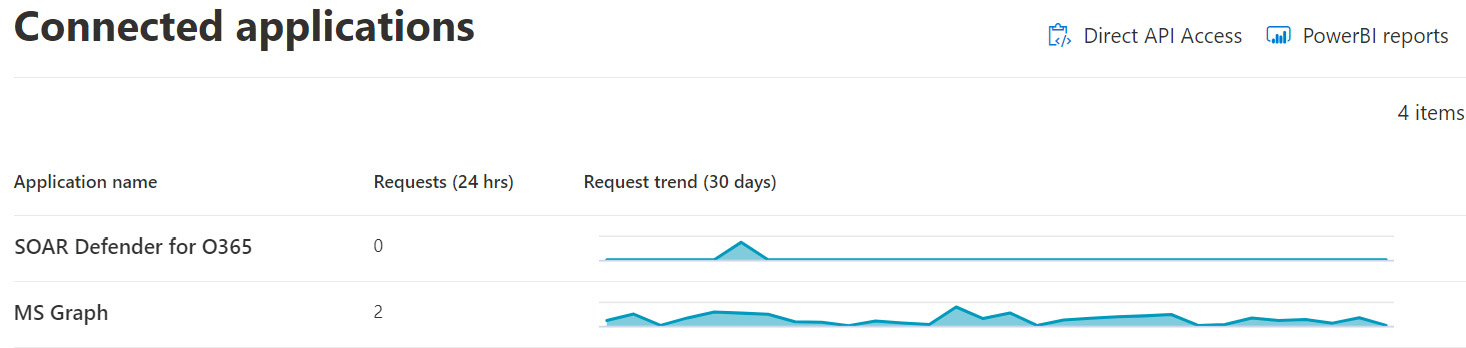
Figure 13.9 – Connected applications in MDE
For additional information about the API schema for Defender for Endpoint, visit https://docs.microsoft.com/en-us/microsoft-365/security/defender-endpoint/exposed-apis-list?view=o365-worldwide.
Next, we will discuss onboarding Windows clients into MDE using Intune.
Onboarding Windows clients into MDE
To get value out of MDE and configure many of its advanced protection capabilities, clients must be onboarded to an instance of MDE. There are several ways to achieve this, and they are determined by how your devices are managed and the architecture of your network. Most methods to onboard clients require deploying an onboarding package that can be distributed using any of the following methods:
- Local script or Group Policy
- Microsoft Endpoint Configuration Manager
- Mobile Device Management (Intune or other MDM providers)
- VDI onboarding script for non-persistent devices
The onboarding package can be obtained in the Microsoft 365 Defender portal by logging into https://security.microsoft.com and choosing Settings | Endpoints | Onboarding under the Device management section. However, if you're using Intune and a cloud-native architecture, clients can be onboarded automatically by enabling Microsoft Intune Connection from MDE and assigning an Endpoint detection and response policy in Intune Endpoint Security. To review the available MDE onboarding deployment strategies, and to determine what may work best for your architecture, review the following PDF:
In the next example, we will be using the Intune method based on a cloud-native architecture. For details about using other methods, visit the official Microsoft docs page at https://docs.microsoft.com/en-us/microsoft-365/security/defender-endpoint/onboard-configure?view=o365-worldwide.
Let's start by configuring the Microsoft Intune connection to establish a service connection from MDE to MEM.
Configuring the Microsoft Intune connection
The Microsoft Intune connection allows you to share device information between MDE and MEM, enables enhanced compliance policy enforcement, and helps power the device's secure score in MDE. Enabling the connector is the first step to automating onboarding for Windows clients. Once the services begin to sync, assigning an EDR policy using Endpoint Security will automatically onboard new clients into MDE without the need to deploy the onboarding package. To enable the Microsoft Intune connection, follow these steps:
- Log in to the Microsoft 365 Defender portal at https://security.microsoft.com.
- Go to Settings, click on Endpoints, and choose Advanced features. Switch the slider to On next to Microsoft Intune connection and choose Save Preferences.
- Log in to Microsoft Endpoint Manager at https://endpoint.microsoft.com.
- Choose Endpoint Security and select Microsoft Defender for Endpoint under the Setup menu.
- Turn Connect Windows devices to Microsoft Defender for Endpoint to the On setting. Click on Save.
Synchronization between the two services occurs at least once every 24 hours. The connection status and last synchronized date can be monitored in the MDE setup, as shown in the following screenshot:
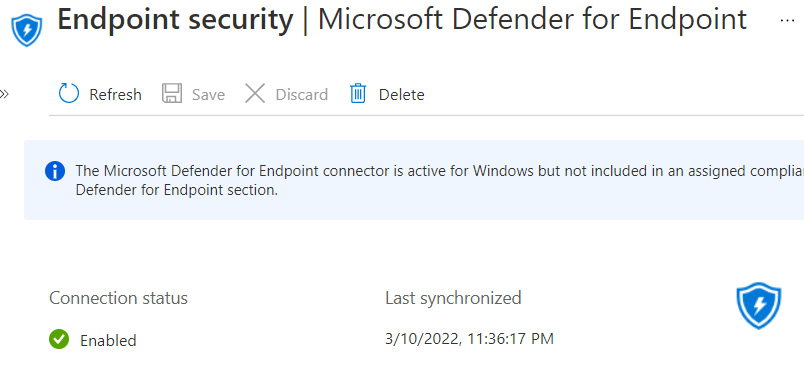
Figure 13.10 – Microsoft Intune connection
Once the service connection has been established, Intune automatically becomes aware of the onboarding package, and an EDR profile can be assigned to automatically onboard Intune-managed clients.
Creating an EDR policy
An EDR policy can be created by using the Endpoint detection and response template type in Endpoint Security. This method also works for MDM-managed Intune devices and with tenant-attached devices if you are using co-management with Configuration Manager. To deploy an EDR policy, follow these steps:
- Sign into Microsoft Endpoint Manager at https://endpoint.microsoft.com.
- Click on Endpoint Security and choose Endpoint detection and response. Click on Create Policy.
- Choose Windows 10 and later for Platform type. Select Endpoint detection and response for Profile and click Create.
- Give the policy a name and description and click Next.
- On the Settings page, keep Block sample sharing for all files set to Not Configured and set Expedite telemetry reporting frequency to Yes.
- Click Next to assign a scope tag if needed, and Next again to assign the policy to groups of users or devices. Click Next to Review + Create and finally Create to finish building the policy.
Tip
If the policy is assigned to groups of users, the policy will not apply until a user signs in, which may cause a slight delay before devices appear in MDE.
Windows clients will typically begin showing up in the portal within 24 to 48 hours after receiving the policy. To confirm that endpoints have been onboarded and are healthy, go to the Microsoft 365 Defender portal at https://security.microsoft.com and choose Device inventory under Endpoints. The endpoint's sensor health state should be active and its onboarding status should show as onboarded.
Next, let's look at enhanced policy enforcement by using the MDE machine risk score as a condition in a device-based compliance policy.
Creating a machine risk compliance policy
Adding a compliance policy condition to evaluate the MDE machine risk score adds zero-trust protection capabilities to your access controls. For example, any client that has a machine risk score of high will be immediately marked as a non-compliant device. Using Azure AD Conditional Access, policies can be configured to block access to certain cloud apps, such as Exchange Online, or require the use of multi-factor authentication for extra verification. To create a compliance policy based on the MDE machine risk score, follow these steps:
- Log in to MEM, go to Devices, and choose Compliance Policy under Policy. Then, click on Create Policy.
- Choose Windows 10 and Later for Platform and click Create.
- Enter a friendly name, such as Windows Device Security Compliance, and give it a description. Click Next.
- Under Compliance settings, choose Microsoft Defender for Endpoint. Click on the dropdown and choose Medium for Require the device to be at or under the machine risk score. Click Next and leave Mark device noncompliant set to Immediately. Click Next and assign the policy to a user or device group. Click Next to review the settings and click Create to finish.
To track the progress of the compliance policy, choose Device status under Monitor from within the compliance policy overview. We can also confirm the status of the evaluation directly on a device in Intune. In the following screenshot, we can see that the device is Compliant based on the machine risk score evaluation:
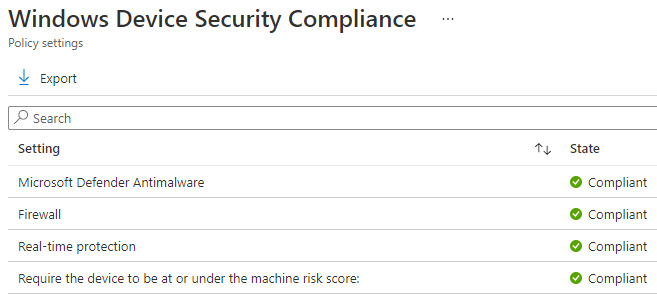
Figure 13.11 – Compliance policy evaluation on a device
In the preceding screenshot, the Windows Device Security Compliance policy also included checks to ensure that the Microsoft Defender Antimalware service, Firewall, and Real-time protection are all enabled. We provided an overview of recommended device-based compliance policies in Chapter 6, Administration and Policy Management, which should be considered as part of implementing a zero-trust access strategy.
MDE's monitoring and reporting features greatly enhance the built-in protection capabilities provided by Windows Defender. By analyzing and aggregating telemetry data from endpoints into easy-to-read dashboards, security teams can quickly analyze threats and prioritize top security tasks. Taking a proactive approach, in addition to normal reactionary measures, will greatly enhance your organization's cyber defenses. We encourage incorporating MDE's threat and vulnerability reporting into the normal operating procedures of the security program to help remediate the known risks and threats.
Next, let's learn how to monitor Windows systems by configuring data collection using Azure Monitor Logs in Azure.
Collecting telemetry with Azure Monitor Logs
Azure Monitor Logs, also known as Azure Log Analytics, is a data collection repository and analysis tool that supports Windows systems and many other resources and services running in Azure. The log data that is collected is stored in a repository known as a Log Analytics workspace, where it can be parsed and analyzed using the Kusto Query Language (KQL). Log Analytics workspaces are used to power dashboards in Azure Workbooks, feed Azure Monitor to aggregate performance data, and provide many other telemetry-driven solutions. Log Analytics workspaces are also used to source data for analysis in security solutions such as Defender for Cloud, Azure Sentinel, and other SIEMs through API connections. A few examples of the data that can be sent into Log Analytics from Windows systems are as follows:
- Windows event logs such as application, system, and security event logs
- Windows performance counters such as memory and processor usage, as well as disk space
This wide dataset allows for a lot of flexibility in building reporting dashboards and configuring alerts.
To get started with Azure Monitor Logs, you will need to deploy a Log Analytics workspace in Azure by following these steps:
- Log in to https://portal.azure.com and search for Log Analytics workspaces.
- Click Create and enter details for Subscription and Resource Group. Enter a name for the workspace and choose a region under Instance details.
- Click Review + Create to complete the setup.
Once the workspace has been configured, telemetry data is collected from Windows servers by installing the Microsoft Monitoring Agent (MMA). For Windows clients, a device configuration profile is configured with a commercial ID of the workspace and deployed to managed devices.
Tip
Azure Monitor agent will be replacing MMA in the future. If you already have MMA deployed, you can visit the following link to learn about the migration path to AMA: https://docs.microsoft.com/en-us/azure/azure-monitor/agents/azure-monitor-agent-migration.
Now, let's look at the methods for onboarding Windows servers into Log Analytics.
Onboarding Windows Servers to Log Analytics
To connect Windows Servers to Log Analytics, the Log Analytics agent or MMA can be installed directly onto the server, or through an extension on Azure virtual machines. Although the Log Analytics agent is on a deprecation path for August 31, 2024, it remains fully supported, but it's recommended to plan a migration to the Azure Monitor Agent (AMA) in the future. Microsoft is frequently adding new supported services to the AMA to bring it as close to feature parity with the MMA and make it compatible with many solutions that rely on MMA today. AMA can also coexist with other agents if you're considering starting the migration path. To find more information about the supported services and features of the Azure Monitor agents, visit https://docs.microsoft.com/en-us/azure/azure-monitor/agents/agents-overview.
The following methods can be used to install the Log Analytics agent on Windows Server:
- Auto-provision of Azure VMs through Defender for Cloud
- Directly on a VM from the Azure portal
- Software deployment tools such as Configuration Manager for Azure Arc-enabled or on-premises servers
- Azure Resource Manager (ARM) templates
- Manually with the UI or through the command line
Most of the installation types will require the workspace ID and key of the Log Analytics workspace to complete the onboarding setup. These can be found by going to the workspace and choosing Agents management under Settings. The Windows agent is also located here for use with the manual installation method. For detailed instructions on the available deployment methods, visit https://docs.microsoft.com/en-us/azure/azure-monitor/agents/agent-windows.
In addition to deploying the agent, data collectors will need to be configured to determine the type of data that is being sent into the workspace. These collectors can be configured automatically by installing solutions available in the Azure Marketplace and by enabling them manually by going to Agents configuration under Settings in the Log Analytics workspace. To keep track of the overall health and responsiveness of the deployed agents, we recommended installing the Azure Log Analytics Agent Health solution from the marketplace directly onto the workspace. This can monitor the number of agents that have been deployed, their geolocation, and the overall count of unresponsive agents, should an issue occur.
If you decide to deploy Azure Monitor Agent instead of MMA, this can be accomplished interactively or at scale using the same methods outlined in the preceding bulleted list. To support on-premises servers, the Azure Connected Machine agent must also be installed, in addition to AMA. For additional information about the Azure Connected Machine Agent, visit https://docs.microsoft.com/en-us/azure/azure-arc/servers/agent-overview#installation-and-configuration.
Once you have decided on the deployment method, data collection can be configured using Data Collection Rules (DCRs) in Azure Monitor. This is a fundamental change compared to the Log Analytics agent, as this was previously handled using the Agent Configuration settings directly in the Log Analytics workspace. DCR rules include similar datasets, including Windows event logs and performance counters, and can be configured through the Azure Monitor UI, REST API, or with the Azure CLI or PowerShell.
For more information about installing and managing servers using AMA, visit https://docs.microsoft.com/en-us/azure/azure-monitor/agents/azure-monitor-agent-overview?tabs=PowerShellWindows.
Next, let's look at configuring Windows clients to send telemetry data into Log Analytics for use with the Update Compliance solution.
Onboarding Windows clients to Log Analytics
Window clients can be configured to send telemetry data into Log Analytics to support solutions such as Update Compliance to monitor and track Windows Update deployments. In addition to collecting data from clients, Intune diagnostic data such as auditing, operational logs, and compliance data can also be sent into Log Analytics as additional datasets. Clients that meet the prerequisites are already compatible and can send data into Log Analytics without requiring an additional agent. All that is needed are telemetry policies that have been configured with MDM or Group Policy to tell the client where to send the data and what it's allowed to send. When the Update Compliance solution is installed, the data collection set is automatically configured and sent to the workspace. It's recommended to review the prerequisites before deploying policies to ensure your devices are supported. You can find these at https://docs.microsoft.com/en-us/windows/deployment/update/update-compliance-get-started#update-compliance-prerequisites.
First, we will create a device configuration profile in Intune to configure telemetry settings for the clients:
- Log in to Microsoft Endpoint Manager at https://endpoint.microsoft.com.
- Click Devices and choose Configuration Profile. Click Create profile.
- Choose Windows 10 and later under Platform and Settings catalog under Profile type.
- Give the profile a name, such as Windows Data Collection and Telemetry, and a description. Click Next.
- In Configuration settings, click on Add settings to open the Settings picker area.
- Search for System and select it. Add and configure the following policies:
- Allow device name to be sent in Windows diagnostic data to Allowed
- Allow Telemetry to Full
- Allow Update Compliance Processing to Enabled
- Configure Telemetry Opt in Change Notification to Disable Telemetry change notifications
- Configure Telemetry Opt in Settings Ux to Disable Telemetry opt-in Setting
- Click Next and add user or device groups to the assignment. Click Next, then Next again, and finally Create to finish the policy.
To finish the setup, the commercial ID of the Log Analytics workspace is still needed so that the clients know where to send the telemetry data. This will be covered in the Update compliance section. Now that we have reviewed methods to onboard Windows servers and clients into Log Analytics, let's look at using monitoring solutions and Azure Workbooks to aggregate the data to build dashboards and create reports.
Monitoring solutions and Azure Workbooks
Monitoring solutions can be added from the Azure marketplace to a Log Analytics workspace to help configure the data collectors, where it is aggregated in the workspace and parsed into pre-built visualizations. Solutions are typically free to install but enabling them could incur data consumption and storage costs, depending on the workspace tier. To view any currently installed solutions in your Azure subscription, log in to the Azure portal and search for Solutions. To add a new solution, click Create to browse through the Azure Marketplace. In the following screenshot, the updatemanagement solution has been added to a Log Analytics workspace to monitor security updates for servers:

Figure 13.12 – The updatemanagement solution
Let's look at a few solutions that are applicable for Windows servers and clients as there are many options available in the marketplace.
Update Compliance
The Update Compliance solution in Azure is specifically designed to track Windows servicing statistics for Windows clients. Using the collected dataset, it parses the data to provide update deployment reports, configuration details for Windows Update for Business (WUfB) settings, and statistics around Delivery Optimization usage and settings. Update Compliance can analyze and report on the following information:
- Feature and quality update installation status for Windows servicing
- Update issues during feature and quality updates
- WUfB configurations such as feature and update deferral windows
- Delivery Optimization stats such as content distribution and bandwidth utilization for updates and apps
- Windows 11 readiness report
The following screenshot shows sample data that's been analyzed by the WaaSUpdateInsights solution overview page:

Figure 13.13 – Update Compliance solution in Log Analytics
Clicking each informational blade in the overview will provide greater details, along with a deeper analysis of the status of your devices. The Update Compliance (WaasUpdateInsights) solution can be installed on an existing Log Analytics workspace by following these steps:
- Log in to the Azure portal at https://portal.azure.com.
- Search for Solutions and click on Create. In the Marketplace area, search for Update Compliance. Click the solution and click Create.
- Choose the subscription and resource group, and select an Azure Log Analytics workspace. Click Next: Review + create. Then, click Create to finish.
Now that the deployment has finished, let's gather the commercial ID from the solution settings by going to Log Analytics workspace | Solutions | WaasUpdateInsights and choosing Update Compliance Settings. Next, let's update the Device Configuration profile that we created earlier in the Onboarding Windows clients to Log Analytics section with the commercial ID by following these steps:
- Go back to Microsoft Endpoint Manager at https://endpoint.microsoft.com.
- Click on Devices, choose Configuration profiles, and open the Windows Data Collection and Telemetry profile we created earlier.
- Click Edit under Configuration settings. Click Add settings to open the Settings picker area. Search for Commercial ID.
- Click on Administrative TemplateWindows ComponentsData Collection and Preview Builds. Then, click on Configure the Commercial ID to add it to the Configuration settings area.
- Change the setting to Enabled and paste the Commercial ID from the Update Compliance solution settings. Click Review + Save to commit the changes.
Once the profile has been updated, devices will start to send data into the Log Analytics workspace and data will appear in Update Compliance. Generally, devices that are active and frequently connected to the internet will begin sending telemetry data within 72 hours.
Next, let's look at enabling a solution for tracking configuration changes on Windows servers called Change Tracking and Inventory.
Enabling Change Tracking and Inventory
The Change Tracking and Inventory solution for Azure Automation is useful for identifying and tracking configuration changes to software, files, and Windows services. Having the ability to identify when changes occur is useful from both an operational and security perspective. To use the Change Tracking solution, a Log Analytics workspace must be connected to an Azure Automation account, such as the Update Management solution for managing updates on servers. The Change Tracking solution can be enabled through the automation account, on the virtual machine directly, or added as a solution using the Azure Marketplace. To open the solution once it's been enabled, open the Azure Automation account and choose Change tracking underneath Configuration Management. The following screenshot shows an overview of Change tracking showing software changes over the last 7 days:

Figure 13.14 – The Change tracking solution
To view additional details about the change, click on Resource Name to view the flyout menu details. The solution can also be customized if you need to modify the changes that are tracked by default. To view the options, click on Edit Settings in the top toolbar from the solution overview. Here, you can enable and disable paths in the Windows registry, add Windows files, and adjust the collection frequency of which to capture Windows service changes.
More information about the Change Tracking and Inventory solution can be found at https://docs.microsoft.com/en-us/azure/automation/change-tracking.
Next, let's look at using Service Map to enable a visualized map of how applications communicate between services and networks.
Using Service Map
The Service Map solution helps you visually conceptualize your systems as a network of connected services, processes, and connections. It can help identify application and system dependencies for both inbound and outbound connections across all connected systems through a holistic view of their interconnectivity with each other. Service Map is a great troubleshooting tool for diagnosing communication problems that historically required many different monitoring solutions to gain these insights. Having the ability to identify active communications protocols allows security teams to lock down connectivity to servers, as well as only allow the necessary protocols for applications to function. The following screenshot of the Service Map solution shows an example of connections that have been established by the source system:
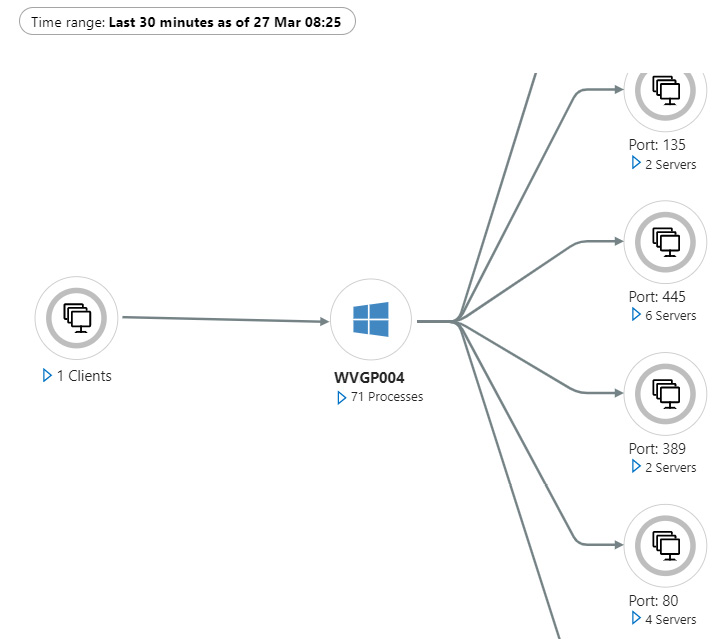
Figure 13.15 – Service Map solution
To enable the Service Map solution, Windows servers require Dependency agent to be installed on the system to collect the required data. After satisfying the prerequisite installation requirements, the Service Map solution can be viewed by clicking on Insights under Monitoring in the virtual machine overview or through Azure Monitor by clicking on Virtual Machines under Insights and finding the VM you wish to view.
More information about the Service Map solution can be found on the documentation page at https://docs.microsoft.com/en-us/azure/azure-monitor/insights/service-map.
Next, let's look at using Azure Monitor to analyze the telemetry data stored in Azure Monitor Logs.
Monitoring with Azure Monitor and activity logs
The Azure Monitor solution provides a centralized location for monitoring resources and services across many different workloads. Using telemetry data collected from a variety of sources, Azure Monitor provides insights into different aspects of the IT infrastructure, ranging from applications, networks, and virtual machines to other Azure resources such as storage accounts, SQL databases, Kubernetes containers, and more. The analysis tools that are used for Windows Server are largely driven by the log data that's collected in Azure Monitor Logs from AMA or MMA. Azure Monitor provides pre-built visualizations to help understand the data that's been collected through the built-in features, such as the solutions that are added to Log Analytics workspaces. Because the incoming data is near-real-time, alerts can be triggered in Azure Monitor based on data thresholds, including the configuration of notifications, which can be sent to interested parties using something called action groups.
An action group defines a series of events that are executed due to an alert being triggered. These actions include notifications in the form of sending emails, text messages, or push notifications to mobile phones or using custom webhooks. Using Azure Logic apps, automation can be triggered from alerts for advanced actions. For example, you can use thresholds to automatically scale up resources during periods of high demand and scale them back during low activity to reduce costs.
Azure Monitor's built-in dashboards are already preconfigured to transform log sources into rich visualizations. The following screenshot is from VM Insights in Azure Monitor showing the processor utilization of a virtual machine. VM Insights monitors the performance and health of virtual machines, including their integration with Service Map, all in one dashboard:

Figure 13.16 – VM Insights in Azure Monitor
The data in Azure Monitor can be tailored further using Azure Workbooks, by only displaying the relevant information for a specific workload and sharing it with the appropriate operational teams without exposing too much data. Next, let's look at using role-based access control (RBAC) to secure access to Azure Monitor.
Secure access to Azure Monitor
Monitoring data contains sensitive information about the IT infrastructure, systems, and processes. It's necessary to restrict access to only the appropriate teams to safeguard against its exposure. Azure Monitor allows for RBAC to the resource-level assignable scope using two built-in roles:
- Monitoring Reader can read all monitoring data in the scope of the assignment.
- Monitoring Contributor can read, create, or modify the monitoring settings or resources in the scope of the assignment.
Custom RBAC can also be configured through various monitoring permissions if the built-in roles are not fine-grained enough. For further information about the custom permissions and ways to secure monitoring data, visit https://docs.microsoft.com/en-us/azure/azure-monitor/roles-permissions-security.
For example, you can store telemetry data from different workloads in different resource groups, storage accounts, or workspaces, and then apply RBAC at those scopes to restrict what data can be viewed. Next, let's look at monitoring operations against resources in Azure using activity logs.
Monitoring Azure activity logs
Azure activity logs monitor operations that have been carried out on resources hosted in the Azure subscription. These logs are important for auditing and tracking from an operational and forensic security perspective, should an incident occur. Events stored in the activity log are broken down into different categories to help identify the types of events that occurred. Some examples include administrative events (create, update, and delete) that have been performed against resources, triggered alerts, security events, and changes to the policy. With the increase of cloud-hosted infrastructure, having an audit trail of activities is critical in any security investigation. Azure activity logs include detailed information about the who, what, and when of activities running in the cloud. For more information about the event schema, visit https://docs.microsoft.com/en-us/azure/azure-monitor/essentials/activity-log-schema.
By default, activity logs are stored for up to 90 days within your subscription for free. Long-term retention and archiving can be achieved by configuring diagnostics settings to send logs into Azure Monitor Logs, storage accounts, or to select Microsoft partners. Using Event Hubs or through API connections, activity logs can be forwarded to a SIEM solution outside of Azure for further analysis and automation. Power BI content packs are also available so that you can build business intelligence reporting dashboards that can be easily shared with IT and the business.
To access Azure activity logs, log into the Azure portal at https://portal.azure.com and search for Activity Log. These activity logs can also be accessed from Azure Monitor, under the Overview blade. The following screenshot shows an example of the operations that are stored in Azure activity logs. It includes details about the operation's name, status, time stamp, and who initiated the event:
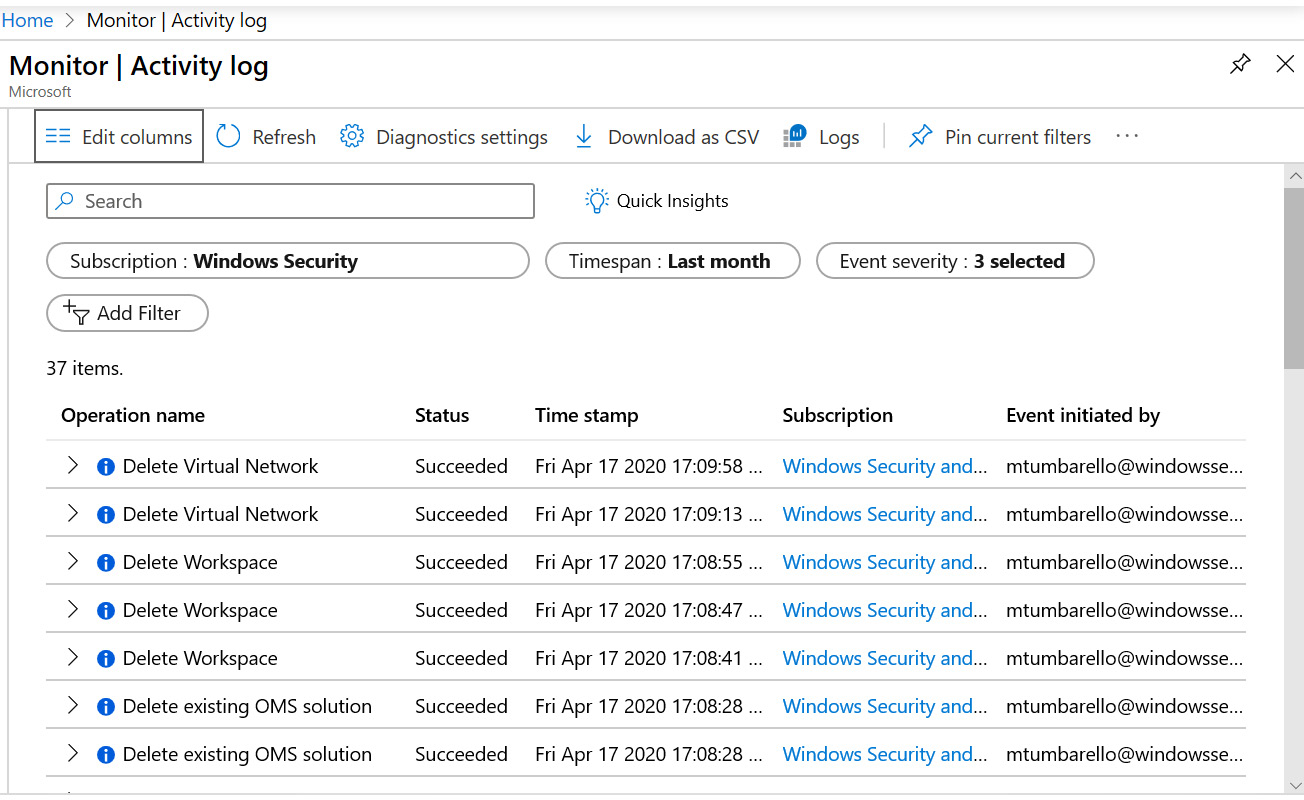
Figure 13.17 – An Azure activity log
Clicking an operational event will provide a detailed summary that includes a JSON formatting of the request and a change history that correlates changes on the same resource 30 minutes before and after the time of the operational event. Alerts can be created directly from the summary pane by clicking New alert rule. Activity logs can also be retrieved by downloading a CSV file from the portal, using the Azure Monitor PowerShell or CLI commands, or through REST APIs. Next, let's look at Azure Workbooks.
Creating Azure Workbooks
Azure Workbooks allow you to aggregate and perform data analysis from various data sources and data types, to create customized dashboards in a single integrated view. Some of the data sources that can be analyzed from within workbooks include Azure Monitor Logs, Azure Monitor data and metrics, Azure resource metadata, resource health, and more. This data can be collated and visualized using many of the available visualizations and graphs and saved as templates for reuse later. This customization allows for different perspectives on underlying datasets. To access Azure Workbooks, you can search for it in the Azure portal or click Workbooks under the Overview pane in Azure Monitor. There are many preconfigured Public Templates to choose from to help you get started or use as a reference when creating a blank workbook. An example of an available template can be seen in the Azure Virtual Desktop Insights dashboard, as shown in the following screenshot. The graphs show two perspectives regarding the volume of connection attempts by their result:
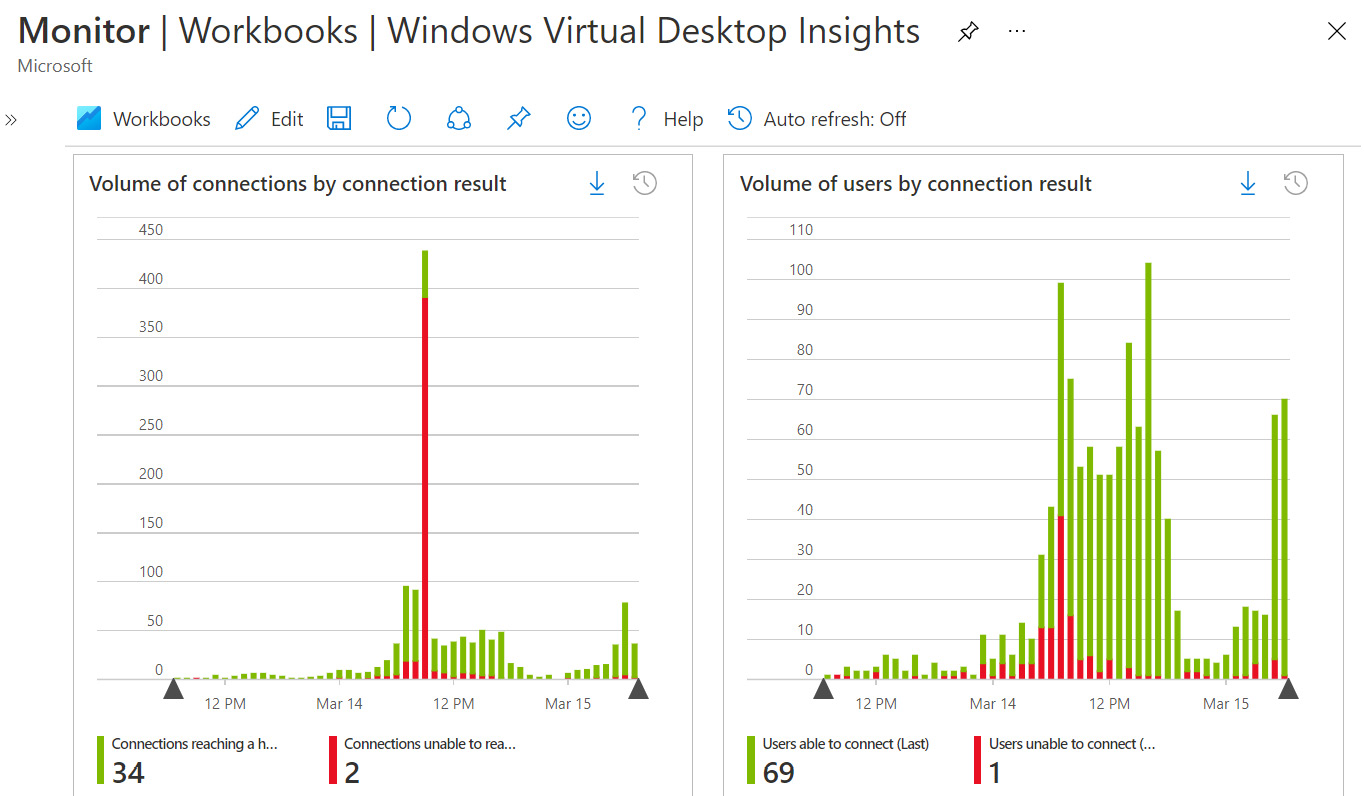
Figure 13.18 – Azure Workbooks
Workbooks can easily be shared between teams, but users will need to be granted read access to the underlying data directly to view the analysis.
For additional information about using Azure Workbooks, visit https://docs.microsoft.com/en-us/azure/azure-monitor/visualize/workbooks-overview.
Next, let's look at how to check for service issues and incidents in Azure using Service Health.
Azure Service Health
Hosting resources in any cloud environment makes them susceptible to service provider outages and any required maintenance of the underlying resources that support the cloud infrastructure. Most of the time, these events are out of your control, and can make planning for maintenance or troubleshooting incidents difficult. If your resources are hosted in Azure, Service Health can help you keep track of these events by reporting service issues, planned maintenance, and health and security advisories through the Service Health dashboard. Customizable dashboards can be created from the data for proactive monitoring of the applicable cloud resources in your environment. Service Health allows you to create configurable alerts, shareable reports, and view issue updates from Microsoft, including impact reports and downloadable root cause analyses (RCAs).
To open Azure Service Health, search for Service Health in the Azure portal or click Service Health in the Azure Monitor overview pane. The following screenshot shows an example history of service issues over 1 month, with a downloadable RCA summary available:

Figure 13.19 – Azure Service Health
In addition to using Service Health, a few useful resources for checking outages can be found at https://downdetector.com/status/windows-azure/ and https://status.azure.com/en-us/status.
Next, let's look at vulnerability management for Azure resources using Microsoft Defender for Cloud.
Overview of Microsoft Defender for Cloud
Microsoft Defender for Cloud is a next-generation security management service that offers threat protection and vulnerability management for resources running on the cloud, on-premises, and in hybrid environments. Defender for Cloud leverages Microsoft's data ecosystem to process trillions of signals through machine learning algorithms to help detect, identify, and protect against many different types of threats across multiple workloads.
At the time of writing, all Windows and Linux operating systems are supported for versions that are compatible with the Log Analytics agent, as Defender for Cloud uses Azure Monitor Logs for analysis. Defender for Cloud includes two plans – one with enhanced security features off (free) and one with enhanced security features enabled for all plans. Enabling a Defender plan does come with an additional cost but can also be applied by resource type if you wish to selectively turn them off.. Leaving enhanced security off will provide continuous assessments, security recommendations, and access to the secure score. Defender for Cloud does support integration with third-party endpoint protection products from Symantec and McAfee. Additional information about the currently supported platforms can be found at https://docs.microsoft.com/en-us/azure/defender-for-cloud/os-coverage.
Defender for Cloud provides the following capabilities:
- Protects resources using Just-In-Time (JIT) access control policies
- Hardens virtual machines with adaptive application controls and application safe lists
- Investigates security alerts and mitigates threats by following remediation actions or creating automated responses to alerts
- Evaluates resources against industry and regulatory compliance standards such as SOC, PCI, HIPAA, and ISO
- Creates and manages security policies to audit and remediate misconfigured controls – for example, requiring endpoint protection or a vulnerability assessment tool to be installed
- Tracks the overall health of a resource to ensure monitoring is enabled and reviews security recommendations and alerts
For a full list of features for virtual machines and servers, visit https://docs.microsoft.com/en-us/azure/defender-for-cloud/supported-machines-endpoint-solutions-clouds-servers?tabs=features-windows.
To access the Defender for Cloud console in Azure, follow these steps:
- Log in to https://portal.azure.com.
- Search for Microsoft Defender for Cloud and open it.
The following screenshot shows the Overview pane of Microsoft Defender for Cloud:
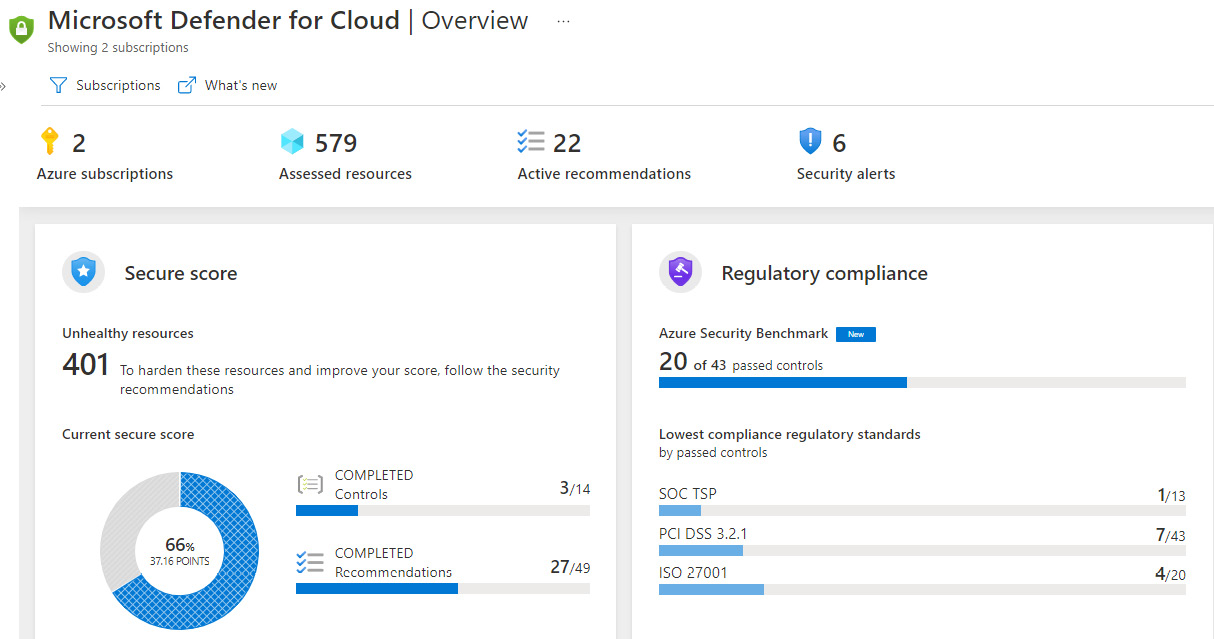
Figure 13.20 – The Defender for Cloud console
A significant benefit of Defender for Cloud is its ease of use. By default, it's enabled in your Azure subscription, and you can begin to receive many of its benefits immediately for free. Enabling the enhanced security option in Defender plans adds additional features that include JIT VM access, regulatory compliance dashboard and reports, adaptive application controls, threat protection and EDR for servers, and threat protection for PaaS services. To enable enhanced security within your subscription, follow these steps:
- From the Overview pane of Microsoft Defender for Cloud, click on Environment settings.
- Click on your subscription to open the settings for Defender Plans.
- Click on Enable all and then click Save to enable the enhanced security features.
The following screenshot shows all the features in the On state for enhanced security.
By default, all Defender for Cloud plans will be enabled. To toggle individual resource plans on or off, scroll down on the same page and change their statuses so that they fit your coverage needs:

Figure 13.21 – Defender for Cloud plans
The pricing shown in the preceding screenshot may change, but the most updated pricing is available on the Azure pricing website at https://azure.microsoft.com/en-us/pricing/details/defender-for-cloud/.
Back on the Settings page, there are several other options for configuring Defender for Cloud to review:
- Auto provisioning allows you to automatically configure the Azure extensions needed to auto-onboard virtual machines into Log Analytics and enable EDR and threat protection. We mentioned this option earlier in the Collecting telemetry with Azure Monitor Logs section.
- Email notifications is where you can configure who should receive email notifications for alerts.
- Integrations allows Defender for Cloud to integrate with other Microsoft security services such as Defender for Cloud Apps and Defender for Endpoint.
- Workflow automation is where you can configure automation workflows based on event triggers. For example, you can customize notifications to specific users and schedule remediation actions.
- Continuous export allows data from Defender for Cloud to be exported or forwarded into Azure Event Hub or a Log Analytics workspace.
To onboard non-Azure Windows and Linux servers, you will need to install the Log Analytics agent or AMA through another method other than auto-provisioning. We covered different methods of onboarding servers in the Onboarding Windows servers to Log Analytics section of this chapter.
Once the server endpoints have been onboarded, the dashboards will begin to populate with data. To view the security recommendations and potential impact on the secure score, click on Recommendations on the Microsoft Defender for Cloud overview page under the General menu. Examples of some of the recommended controls can be seen in the following screenshot:

Figure 13.22 – Defender for Cloud recommendations
Any threats that Defender for Cloud detects will trigger an alert and assign a severity rating. To view any active alerts, click on Security alerts under the General menu:

Figure 13.23 – Security alerts
To review a reference of the different types of security alerts, visit https://docs.microsoft.com/en-us/azure/defender-for-cloud/alerts-reference.
Microsoft Defender for Cloud categorizes security alerts by assigning them a MITRE ATT&CK tactic. Understanding these tactics can help you correlate events during a security incident when you're putting an attack timeline together.
Next, let's review the available report types in MEM for Windows systems managed with Intune or Configuration Manager co-management.
Reporting in MEM
MEM is the unified endpoint management solution that brings Intune and Configuration Manager together. Using the power of Microsoft cloud analytics, MEM provides unified reporting views to gain insights into device compliance, security updates, encryption status, and the overall health of managed endpoints. For security operations, having these views is a key component for monitoring endpoints and maintaining a good device security posture. With the increased adoption of remote work, admins also need to be able to collect logs from endpoints to help troubleshoot operational issues or for forensic security investigations.
In the next few sections, we will cover the different service-side reports available in MEM and where to collect client-side logs on managed devices. We will review how to enable device health telemetry collection, monitor software update deployments, and use Endpoint analytics to provide proactive reporting.
Security-focused reports in MEM
A great feature in MEM includes the built-in reporting that is available by default with the service. There is no immediate need to set up additional infrastructure to host data log collection, although retention past 90 days can be configured by changing the diagnostic settings to export platform logs into a Log Analytics workspace, storage account, or event hub. There are four main category report types in MEM, as follows:
- Operational reports include details about the status of individual devices. For example, you can check a Device Configuration profile assignment status, the encryption status report, or details about certificate issuance using the Intune certificate connector. These reports are most useful for reviewing or troubleshooting individual devices. To view these reports in MEM, choose Devices and click on Monitor.
- Organizational reports provide higher-level details about the ecosystem of endpoints and the overall status of the Intune service. Examples include device compliance reports and the status of endpoint security features such as Defender Antivirus and Firewall. To view these reports, choose Reports from the MEM home page.
- Historical reports allow you to view insights regarding past trends in your MEM environment, such as the trend of compliant devices over an amount of time. To collect and report on historical data, Microsoft Intune Data Warehouse can be used to connect MEM data to Power BI for reporting. To configure the Intune Data Warehouse, choose Reports and find Data warehouse in the navigation pane.
- Specialist reports include custom dashboards built by system admins and engineers using Azure workbooks from client data and MEM diagnostic data stored in Azure Monitor Logs. To configure diagnostic settings, choose Reports and click on Diagnostic settings.
Let's look at where to find the security-focused reports in MEM.
Device compliance reports
Device compliance reports help show if devices meet the criteria outlined in the conditions defined to access company resources. Device compliance is a key zero-trust component for protecting organization data by ensuring the devices accessing the resources meet both the safety and security standards that are outlined. Device compliance reports are available at both an operational and organizational level and can be found in the following locations in MEM:
- Operational reports can be found at Devices | Monitor under Compliance.
- Organizational reports can be found at Reports | Device compliance under Device management.
The following screenshot shows an example of an organizational report for Device compliance:

Figure 13.24 – Device compliance summary report
Within the summary overview page, choose Reports to view reports about the compliance status of individual devices and to view trends over the past 60 days.
Next, let's look at unhealthy endpoints and malware reports.
Unhealthy endpoints and active malware reports
The unhealthy endpoints report is an operational report that shows the status of the Defender Antivirus services running on endpoints that are reporting issues. You can use this report to find devices that may lack antivirus protection and have features such as the malware protection service disabled, real-time protection turned off, or are missing signature definition updates. Bulk remediation options are available directly in the reports and include running a quick and full antivirus scan and triggering a signature definition update on selected endpoints.
The active malware report is also an operational report that shows endpoints with unresolved threats detected from MDE. This includes the status of the malware and classifications, including its name, category, and severity. The active malware report also supports the same bulk remediation options as unhealthy endpoints.
To view these reports in MEM, go to Endpoint Security | Antivirus and choose Unhealthy endpoints or Active malware.
Antivirus agent status report
The antivirus agent status report is an organizational report that shows the status of Defender Antivirus features on the managed endpoints. Use this report to get the following details from clients:
- Device state
- Anti-malware version
- Tamper protection
- Real-time protection status (MDE Sense)
- MDE onboarding status
- Defender Engine Version
In addition to the antivirus agent status report is the detected malware report. You can use this report to view any detected malware on your devices, as reported from MDE. The report types can be seen in the following screenshot of the MEM console:
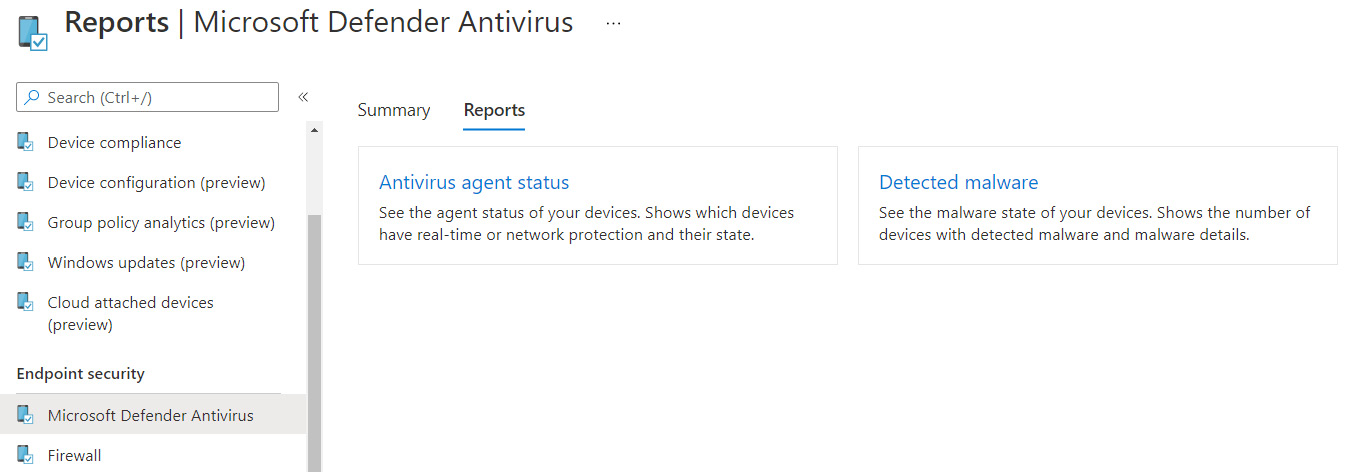
Figure 13.25 – Microsoft Defender Antivirus reports
To view the Antivirus agent status and Detected malware reports, go to Reports, choose Microsoft Defender Antivirus under Endpoint Security, and select Reports.
MDM Firewall status report
The MDM Firewall status for Windows 10 and later report shows details on the state of the Defender firewall on managed devices. The available statuses, as shown in the following screenshot, include Enabled, Disabled, Limited, Temporarily disabled, and Not applicable:
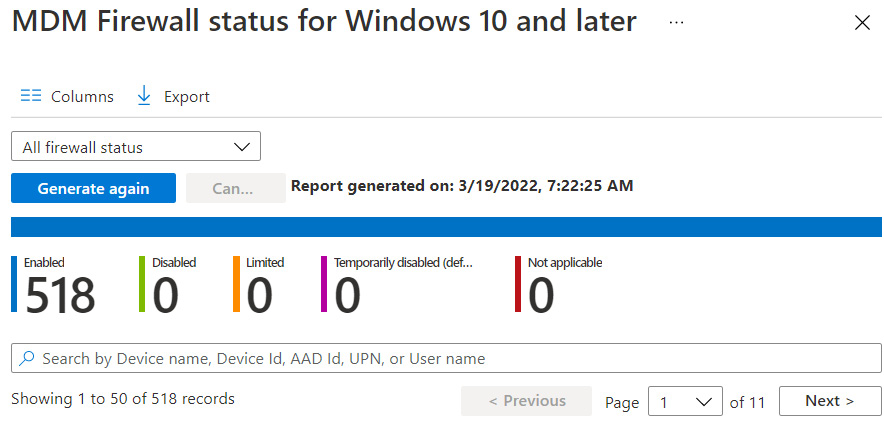
Figure 13.26 – MDM Firewall status
To view the MDM Firewall status report, go to Endpoint Security | Firewall and choose MDM Firewall status for Windows 10 and later.
Encryption report
The encryption report is another operational report that you can use to validate the status of encryption on your devices. The report includes details such as the device's name, operating system, OS version, TPM version, encryption readiness, and encryption status. Within the report, you can click on a device to view additional details, such as the status of an Intune BitLocker profile. The Encryption readiness column shows if the device supports enabling encryption using technology such as BitLocker or FileVault. To view the encryption report, choose Devices | Monitor | Encryption report under Configuration.
Windows Device Health Attestation report
The Windows Device Health Attestation (DHA) report provides insights into hardware-based security features that are enabled on your managed endpoints. The DHA feature in Windows can help ensure that the boot phase of a device remains secure and in a trusted state. The report includes a status for the following security features:
- BitLocker
- Code Integrity
- Early Launch AntiMalware
- Boot Debugging
- Attestation Identity Key (AIK)
- Secure Boot
- Data Execution Prevention Policy
- And more
To view the report in Microsoft Endpoint Manager, go to Devices | Monitoring and choose Windows health attestation report.
To configure devices to send data into the DHA report, deploy an Intune compliance policy that checks for BitLocker, Secure Boot, and Code Integrity. We covered how to deploy this policy in Chapter 8, Keeping Your Windows Clients Secure, in the Configuring a Device Compliance Policy section.
Next, let's look at enabling a profile in Intune to configure additional telemetry data collection for Windows updates and Endpoint analytics.
Enable Windows Health Monitoring
A Windows Health Monitoring profile can be assigned to managed endpoints using MEM, which allows Microsoft to configure the necessary data collectors to power Endpoint analytics reporting and enhanced telemetry analysis by the Windows Update Service. Once the profile has been created and assigned, Endpoint analytics will begin to be populated with insights and provide recommendations by calculating individual device scores. These scores are based on identified issues through slow startup, performance, and application reliability metrics. The Windows Health Monitoring profile also helps to power the Windows 11 readiness report in Endpoint analytics and enables proactive remediation functionality for deploying script packages to detect and fix common issues.
Tip
For co-managed devices, the client app's workload must be set to Intune to use proactive remediation scripts.
To deploy the health monitoring profile, use an Intune Device Configuration profile and select the Windows health monitoring profile type for Windows 10 and later. For the most benefit, select both the Windows updates and Endpoint analytics scopes, as shown in the following screenshot:
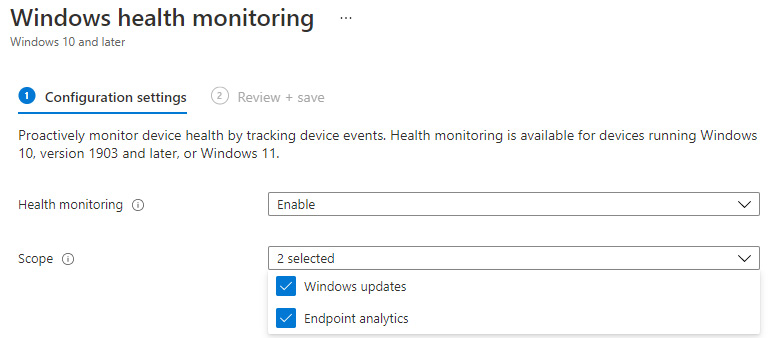
Figure 13.27 – Windows health monitoring profile
Once the profile has been assigned, Endpoint analytics data should begin to populate within 24-48 hours. Next, let's look at how to use Endpoint analytics reporting.
Using Endpoint analytics
Endpoint analytics allows you to create performance baselines and track how devices perform against the overall organizational score over time. Data collected by Endpoint analytics helps to identify issues with hardware, policy configurations, and applications that could be causing reduced performance for your end users. Some of the insights that can be gained by enabling Endpoint analytics are as follows:
- Startup score
- Model performance
- Device performance
- Startup processes
- Restart frequency
- Application reliability score
- App performance
- OS version performance
By tracking these performance metrics, IT staff can triage issues quicker with better insights and help reduce the investigation time, should a user open a support ticket. If trends are observed for multiple devices within the organization, proactive remediation scripts can be deployed to detect and fix common problems to reduce the burden on the support desk. For detailed information about using Endpoint analytics, visit https://docs.microsoft.com/en-us/mem/analytics/overview.
To use Endpoint analytics, devices can be onboarded from both Intune and Configuration Manager. To view the reports in the MEM admin center, click on Reports and choose Endpoint analytics. The following screenshot shows how the combined score of your devices stacks up against all organizations or the custom baseline for the Startup performance, Application reliability, and Work from anywhere metrics:
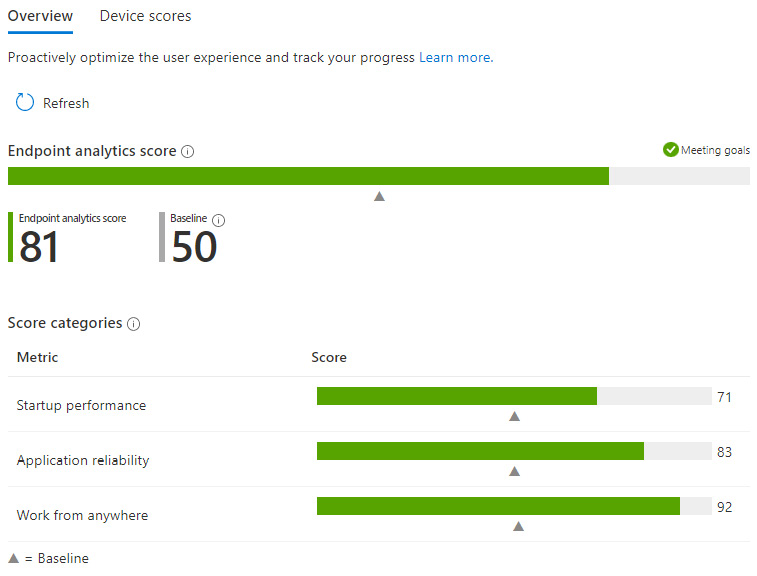
Figure 13.28 – Endpoint analytics
By clicking on Device scores next to Overview, you can dig deeper into the metrics for individual devices to troubleshoot issues. To find out more about the prerequisites to enable Intune on devices, visit https://docs.microsoft.com/en-us/mem/analytics/enroll-intune.
Now that we have reviewed service-side reporting, let's learn where to collect MDM diagnostic logs directly from clients.
Collecting client-side diagnostic logs
When the service-side logs don't provide enough detail for an individual device, sometimes, it's necessary to collect and review client-side logs. Devices managed with Intune create numerous client-side logs, depending on what you're trying to troubleshoot. Let's review what they are and how to gather them from clients.
Remotely collecting diagnostic logs
Windows device logs can be collected remotely by using the bulk device actions in MEM. After the collection action is complete, the diagnostic data is stored for 28 days in Intune until it's deleted by the service. The following screenshot shows the Collect diagnostics bulk device action on the Device overview page:
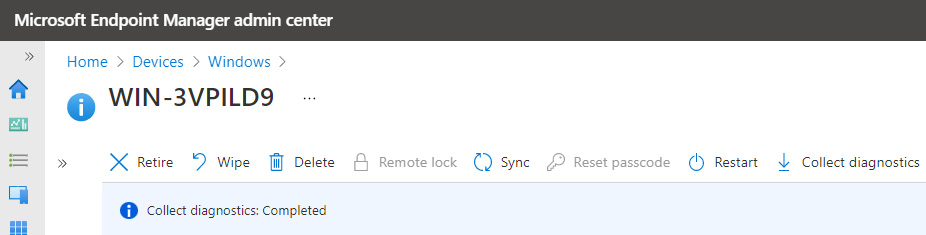
Figure 13.29 – Intune remote actions
The data that's collected includes information about the device's Azure AD status, system information, network configurations, Windows Event Viewer logs, and certificate store details. For detailed information on what data is collected, visit https://docs.microsoft.com/en-us/mem/intune/remote-actions/collect-diagnostics.
Next, let's look at collecting logs directly from a client.
Generating an MDM diagnostic report
An MDM diagnostic report can be generated directly on the client by going to Settings | Access Work or School | Connected to Azure AD tenant | Info. Then, choose Create report under Advanced Diagnostic Report. The exported report will be saved to the C:UsersPublicPublic DocumentsMDMDiagnostics folder and contains an HTML-formatted file that shows general information about the device, connection information to MDM, managed certificates, and the profiles and policies that have been applied by Intune. To generate a full MDM diagnostic report, go back to Access work or School and choose Export your management log files. This will collect all possible MDM diagnostic logs, such as the remote diagnostic collection from Intune.
Intune Management Extension logs
The Intune Management Extension (IME) logs are used to review PowerShell scripts and Win32 app deployments that have been assigned to devices in Intune. To view the logs, navigate to C:ProgramDataMicrosoftIntuneManagementExtensionLogs. These logs can help you troubleshoot both script and Win32 app deployments as you can review any output or error codes.
To view the registry parameter information for Win32 apps from the IME, navigate to HKLM:SoftwareMicrosoftIntuneManagementExtensionWin32Apps<GUID><App GUID>. To correlate the app in MEM, the app GUID will match the end of the URL in the browser when opening the overview pane of a Win32 app from the MEM portal. Some of the available information includes exit codes and the download start times of the app deployment.
Line-of-business or MSI app logs
To troubleshoot an MSI app deployment, you can review the following logs, depending on if the app was targeted at users or devices:
- Device targeted MSI deployment logs are written to %windows% emp<MSIProductCode>.msi.log.
- User targeted MSI deployment logs are written to %temp%<MSIProductCode>.msi.log.
To view the registry information for MSI app deployments, including information about error codes, product version, and deployment status codes, visit the following locations:
- For Device targeted app deployments, go to HKLM:SoftwareMicrosoftEnterpriseDesktopAppManagement<SID>MSI<MSIProductCode>.
- For User targeted app deployments, go to HKLM:SoftwareMicrosoftEnterpriseDesktopAppManagement<UserSID>MSI<MSIProductCode>.
Next, let's look at where to check MDM logs in Event Viewer.
Event Viewer logs
The following location can be used to view information about MDM policy enforcement and device check-in details about the Intune service:
Event Viewer | Applications and Services Logs | Microsoft | Windows | Device Management-Enterprise-Diagnostics-Provider
Viewing applied policies
To view the settings that have been applied by the policy providers shown in the DeviceManagement-Enterprise-Diagnostics-Provider logs, go to HKLM:SoftwareMicrosoftPolicyManagercurrentdevice under Registry Editor. Here, you can view all the CSP-backed policies and the settings that have been applied to the client. To view the blocked group policies from the Group Policy engine because MDM has configured an equivalent policy, look for the Blocked Group Policies section in the MDMDiagReport.html file that was generated from the MDM diagnostic report.
Next, let's review the available reporting in MEM for Windows updates deployments to managed endpoints.
Monitoring update deployments
Monitoring the status of security updates is another key process to include in any security operations program. Ensuring updates are deployed timely is one of the best ways to keep devices secure against the latest threats. In Chapter 8, Keeping Your Windows Client Secure, we covered how to assign Windows Update for Business policies using update ring deployment profiles to managed devices. We can leverage those same deployment profiles to track the update statuses of clients that have been assigned to a deployment ring natively in MEM.
In MEM, choose Devices | Update rings for Windows 10 and later and select a deployment ring to view the overview. Under the Monitoring section, select End User update status to view details about the current device's Quality Update Version, Feature Update Version, Last Scan Time, and Last Check-in Time. While the report provides an overview of quality and feature updates, it doesn't provide much in-depth information about the overall compliance of your endpoints, nor any diagnostic details for failed or delayed update installations. For a better overview, we recommended using the Update Compliance solution in a Log Analytics workspace or building a custom Azure workbook. We discussed the Update Compliance solution earlier in the Monitoring solutions and Azure workbooks section of this chapter. The following screenshot shows the latest security update deployment status, sorted by OS build, as reported from the Update Compliance solution:
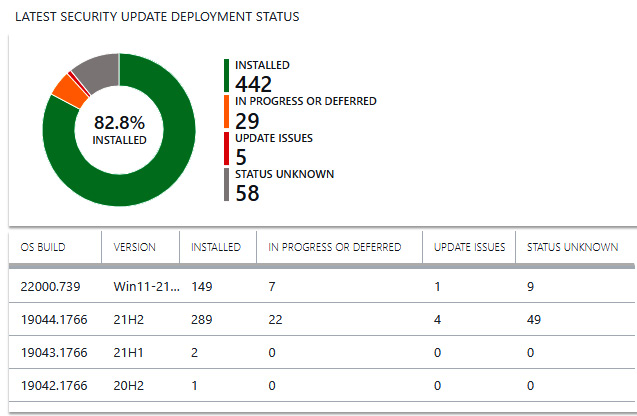
Figure 13.30 – Update Compliance
If the reporting from Update Compliance doesn't meet your reporting needs, the log data can be used to create different views in an Azure workbook. The following screenshot shows an example of what this looks like:

Figure 13.31 – Update Compliance report in an Azure workbook
Additional options for reporting the status of Windows updates are available in MEM if you're using the Feature updates for Windows 10 and later or Quality updates for Windows 10 and later deployment type. To view these reports in MEM, click on Reports and choose Windows Updates under Device management to view a summary or get a detailed report of an update deployment. Only devices that have been assigned either a feature update or expedited quality update policy will be available in the report.
Reports can also be created manually by exporting all Windows devices from MEM into a CSV file and comparing their current builds to the latest release builds from the Windows update release history website. Windows 11 update release history can be found at https://support.microsoft.com/en-us/topic/windows-11-update-history-a19cd327-b57f-44b9-84e0-26ced7109ba9.
Next, let's look at the reporting capabilities available in Microsoft Endpoint Configuration Manager.
Reporting in Microsoft Endpoint Configuration Manager
Configuration Manager has a wide variety of reports available from the data that's been collected from managed endpoints, including 500 pre-configured reports. Much of the data that populates these device reports has been collected from software and hardware inventory classes that are defined in the client settings. These reports leverage the capabilities of SQL Server Reporting Services and can be viewed directly in the Configuration Manager console. They are organized into subfolders based on category. A few examples of the categories that are available include hardware, asset intelligence, network, operating system, software, and users. If the built-in reports don't fit your needs, Configuration Manager supports building custom reports using Microsoft SQL Server Report Builder or with Power BI. If you use Configuration Manager and have not configured reporting, we recommend going to the following link to review the planning for reporting guide: https://docs.microsoft.com/en-us/mem/configmgr/core/servers/manage/introduction-to-reporting.
To access the reports in the management console, navigate to Monitoring | Reporting | Reports. The following are some of the security-related reports in Configuration Manager that can be reviewed against known vulnerabilities:
- Lifecycle 05A – Product lifecycle dashboard shows information about the Windows version distribution of your managed clients.
- Details of firmware states on devices shows the status of SecureBoot, UEFI, TPM version, and TPM state.
- Hardware 01A – Summary of computers in a specific collection shows details about managed device hardware such as the manufacturer, model, memory, processor, and disk space.
- Summary compliance by configuration baseline shows the overall compliance of deployed configuration baselines. You can drill into the report to get more details about the baselines, view the status of individual configuration items, and report on devices with non-compliant rules.
- Count of all instances of software registered with Add or Remove Programs provides a detailed software inventory of all managed devices.
- Services – Services information for a specific computer displays summary information about all the services running on a single computer.
This is only a very small sample of the reporting capabilities within Configuration Manager and many additional reports are available, depending on the enabled features and software and hardware inventory classes that have been set in the client settings within MECM. For a detailed list of the available reports, visit https://docs.microsoft.com/en-us/mem/configmgr/core/servers/manage/list-of-reports.
Next, let's use the Microsoft 365 Apps admin center to monitor the health and update status of Office apps.
Monitoring the health and update status of Office apps
The modern Microsoft 365 apps suite runs on a servicing channel that is independent of Windows and Windows Update. As a result, Office product updates are not delivered through the typical Windows updates servicing cycle. Office apps consistently remain a popular target for attackers who wish to exploit software bugs or security policy misconfigurations to launch malicious code, so it's important to have insight into the health and update status of Office apps. This helps ensure effective servicing and that you remain protected against the latest vulnerabilities. In Chapter 9, Advanced Hardening for Windows Clients, we covered deploying a security baseline for Office apps using the Microsoft 365 Apps admin center, also known as the Office Cloud Policy service. The admin center also includes dashboards that can monitor app health and security update status. To log in to the Office Cloud Policy service, go to https://config.office.com. Let's review the available dashboards in the Microsoft 365 Apps admin center.
Microsoft 365 Apps health dashboard
The Microsoft 365 Apps health dashboard provides insights into the overall health of the entire suite of Office apps in your organization by analyzing performance metrics across the different servicing channels. The metrics that are collected include details about crash rates, boot times, and measuring time delays in opening files to calculate a reliability metric. The Overview dashboard can help inform you of any deteriorations across app types, and then sorts them by app or impacted channel. The Advisories tab lists the latest performance advisories sorted by impacted application, channel, build, and severity. The following screenshot shows the app session crash rate for Outlook over the last 30 days by channel and build:
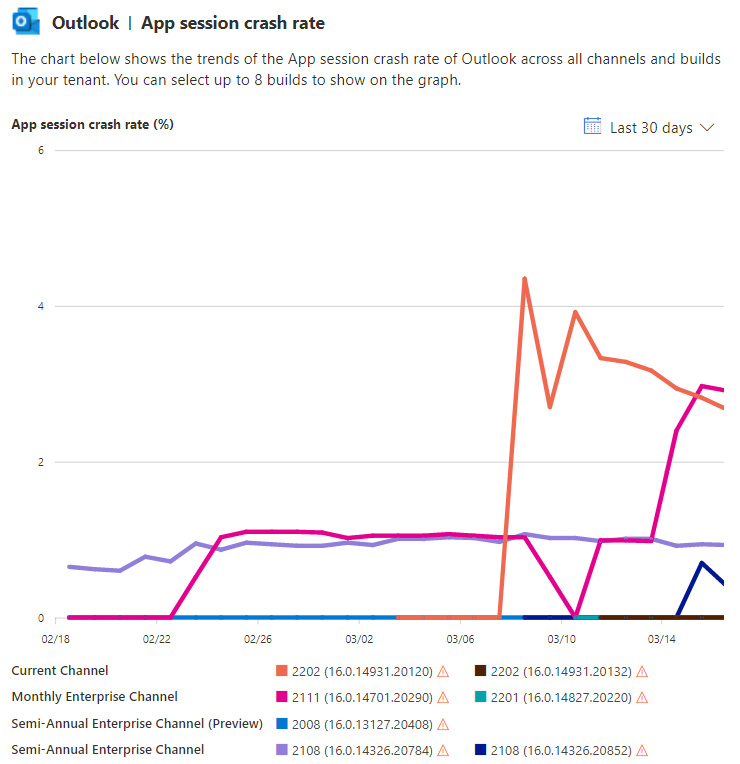
Figure 13.32 – App metrics for Outlook
Using the App metrics tab, you can view each app individually for a more fine-grained view of app health and sort by build or performance metrics such as the crash rate or application boot time.
Monitoring Security Update Status
The Security Update Status provides a dashboard of your security update compliance across all servicing channels by comparing them to the latest security update release date from Microsoft. To view the dashboard, go to Health and choose Security Update Status in the admin center. Here, you can easily track which devices are failing to update and build an action plan to get them fixed. In addition to reporting on security updates, you can use the Goal feature to set a target update goal and timeline to help track and report on update deployments. Creating a goal doesn't schedule update deployments or modify the policy and is only used for reporting purposes. The following screenshot shows the overall update status of all Office installations across all channels and devices compared to the latest release security updates:
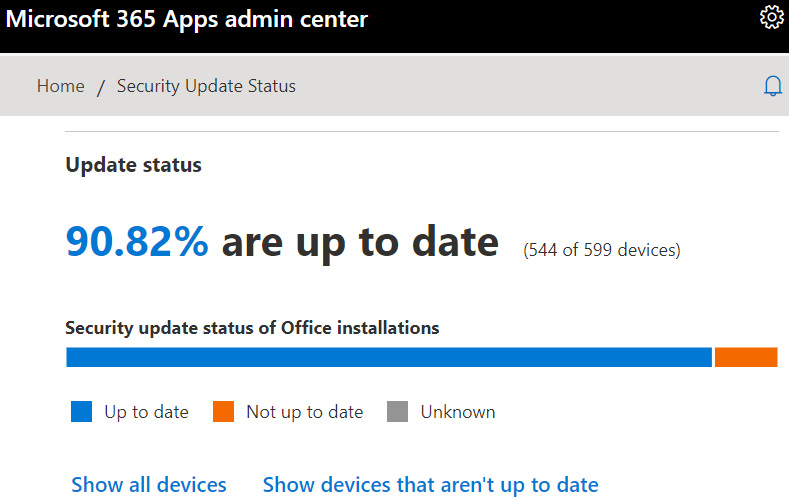
Figure 13.33 – Security Update Status
The dashboard also includes a link to a list of the latest security update releases from Microsoft.
Viewing the Office Inventory report
The Office Inventory dashboard provides reporting on the state of all servicing channels and builds across your environment. Here, you can easily view the build spread to understand the diversity across your environment and check if any devices include versions that are out of support. The Data Insights section reports the total number of devices checking into the Microsoft 365 Apps admin center and the device count by the architecture of the Office installation. The Add-ins section provides a report about the identified add-ins, the number of devices with the add-in installed, and the version numbers across all installations. The following screenshot shows the Office build spread from the Office Inventory dashboard.

Figure 13.34 – Office build spread
Devices are removed from the inventory if they have not sent a heartbeat within 30 days.
Servicing Office apps
The Microsoft 365 Apps admin center also allows you to configure automatic updates for Office apps using servicing profiles. Servicing profiles are used to automatically control and deliver Office updates to your clients and can be assigned to groups of users or devices. Assigning a servicing profile will automatically switch devices to the Monthly Enterprise servicing channel, uses the Office Content Delivery Network (CDN) to download updates, and takes precedence over other management tools for configuring automatic update settings, should there be a conflict. Windows Delivery Optimization policies can be used in conjunction with servicing profiles to help control bandwidth settings for update deployments, including configuring throttling based on network congestion and location. Should an issue arise during a rollout, updates can be paused or rolled back until a fix can be applied. To learn more about using servicing profiles, visit https://docs.microsoft.com/en-us/deployoffice/admincenter/servicing-profile.
Once a profile has been created, active devices will receive the profile within 24 hours.
Starting in June 2022, Microsoft recommends moving all Microsoft 365 app deployments to the Monthly Enterprise update channel to provide the best experience for end users.. If you're ready to switch channels, using a servicing profile is a great way to change the update channel for existing installations.
Summary
In this chapter, we covered different methods that can be used for monitoring and reporting Windows servers and clients. We covered MDE and reviewed the available dashboards that help track vulnerabilities, identify weaknesses, and report on machine health and software inventory. Then, we reviewed how to onboard Windows clients using the Microsoft Intune Connector and how to assign an EDR profile. Next, we learned about collecting telemetry data using Azure Monitor Logs and Log Analytics workspaces. We covered onboarding Windows clients and servers, as well as how solutions from the Azure Marketplace can help you configure data collectors and visualize the data being captured. We also provided an overview of Azure Monitor for viewing performance insights and reviewed the Azure activity logs for auditing resource operations.
In the next section, we discussed enabling Microsoft Defender for Cloud and showed you how to enable enhanced security and auto-provisioning to automatically onboard virtual machines. Then, we covered many of the reporting capabilities available in Microsoft Endpoint Manager, how to collect client-side diagnostic logs, and how to monitor security update deployments. Finally, we discussed the importance of monitoring Microsoft 365 Apps health and security updates using the Microsoft 365 Apps admin center.
In Chapter 14, Security Operations, we will provide an overview of the Security Operations Center (SOC) and its role within an organization. We will explain how organizations can use the different Microsoft 365 security tools to investigate potential security threats. Then, we will discuss the importance of planning for business continuity and disaster recovery using a cyber incident response plan.