
10
Performing Health Checks on Your Services
Maintaining maximum uptime is an important aspect of any system. In the previous chapter, we saw where we can write code in a fault-tolerant manner that will reduce the prevalence of outages in our infrastructure and network. This, however, is not a long-term solution, and things fail regardless of these measures. It then leads to the notion that we need to know when there are failures.
This is where we start thinking about health checks. Health checks exist as a mechanism to inform us of outages in our services and supporting databases and connections in our application. Generally, this can be accomplished with a simple ping request to a resource. The resource is available and operating as expected if we get a response. In the absence of a response, we assume that the resource is down and trigger an alert.
There are statuses between the service’s up and down status, and we will discover those options in this chapter. We will also explore some of the functionality that .NET Core provides to implement these checks.
In this chapter, we will look at various scenarios and countermeasures that we can implement when navigating possible failures in our microservices architecture.
After reading this chapter, we will be able to do the following:
- Understand why health checks are necessary
- Understand how to implement health checks in ASP.NET Core
- Understand how orchestrators monitor and respond to failures
Technical requirements
Code references used in this chapter can be found in the project repository, which is hosted on GitHub at this URL: https://github.com/PacktPublishing/Microservices-Design-Patterns-in-.NET/tree/master/Ch10.
Health checks and microservices
A health check allows us to monitor the health of our services. Frankly, another service or resource that exposes an HTTP endpoint becomes a capable candidate for health checks. We can simply make a request to this endpoint and hope for a response that indicates a successful response. The simplest form of a health check can come from implementing a simple GET request, which returns a 200OK HTTP response. We can add further intelligence to such an endpoint, check connectivity to other key services, and use those to influence the response code returned.
Health checks are useful mechanisms for both monolithic and microservices applications. In the context of microservices, however, we have an increased challenge of monitoring and maintaining several services. Even more so if they are configured to scale on individual levels. Health checks can be used to monitor the health and uptime of interdependent services and carry out some form of corrective action when a service is down.
Using .NET Core, we can return a successful response and include additional information that gives some details on the health of the service. In this case, we cannot simply go by the 200OK response, but we need to interrogate the actual response body to check whether the service is healthy, degraded, or unhealthy.
Figure 10.1 shows a typical health check:
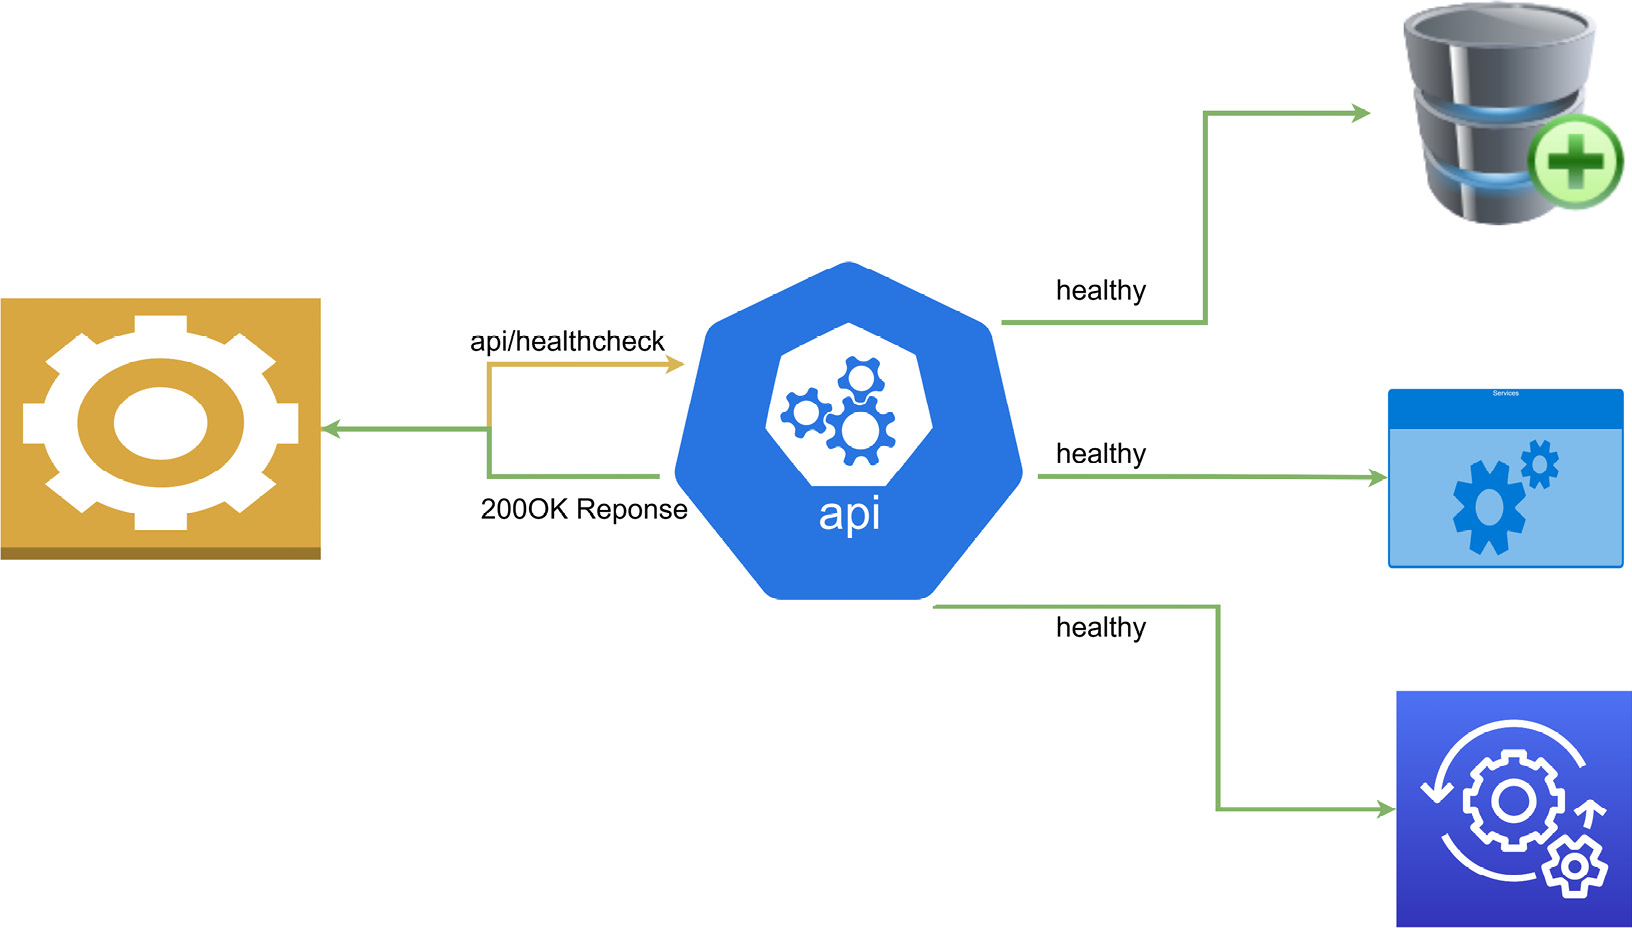
Figure 10.1 – Shows a health check request and healthy response after verifying that all services are available
Let’s break down what each state entails:
- Healthy: This indicates that the service is healthy and the application is operating as expected
- Degraded: This indicates that the service is live, but some functionality may be unavailable
- Unhealthy: This indicates that the service is failing and is not operating as expected
Figure 10.2 shows a failed health check:
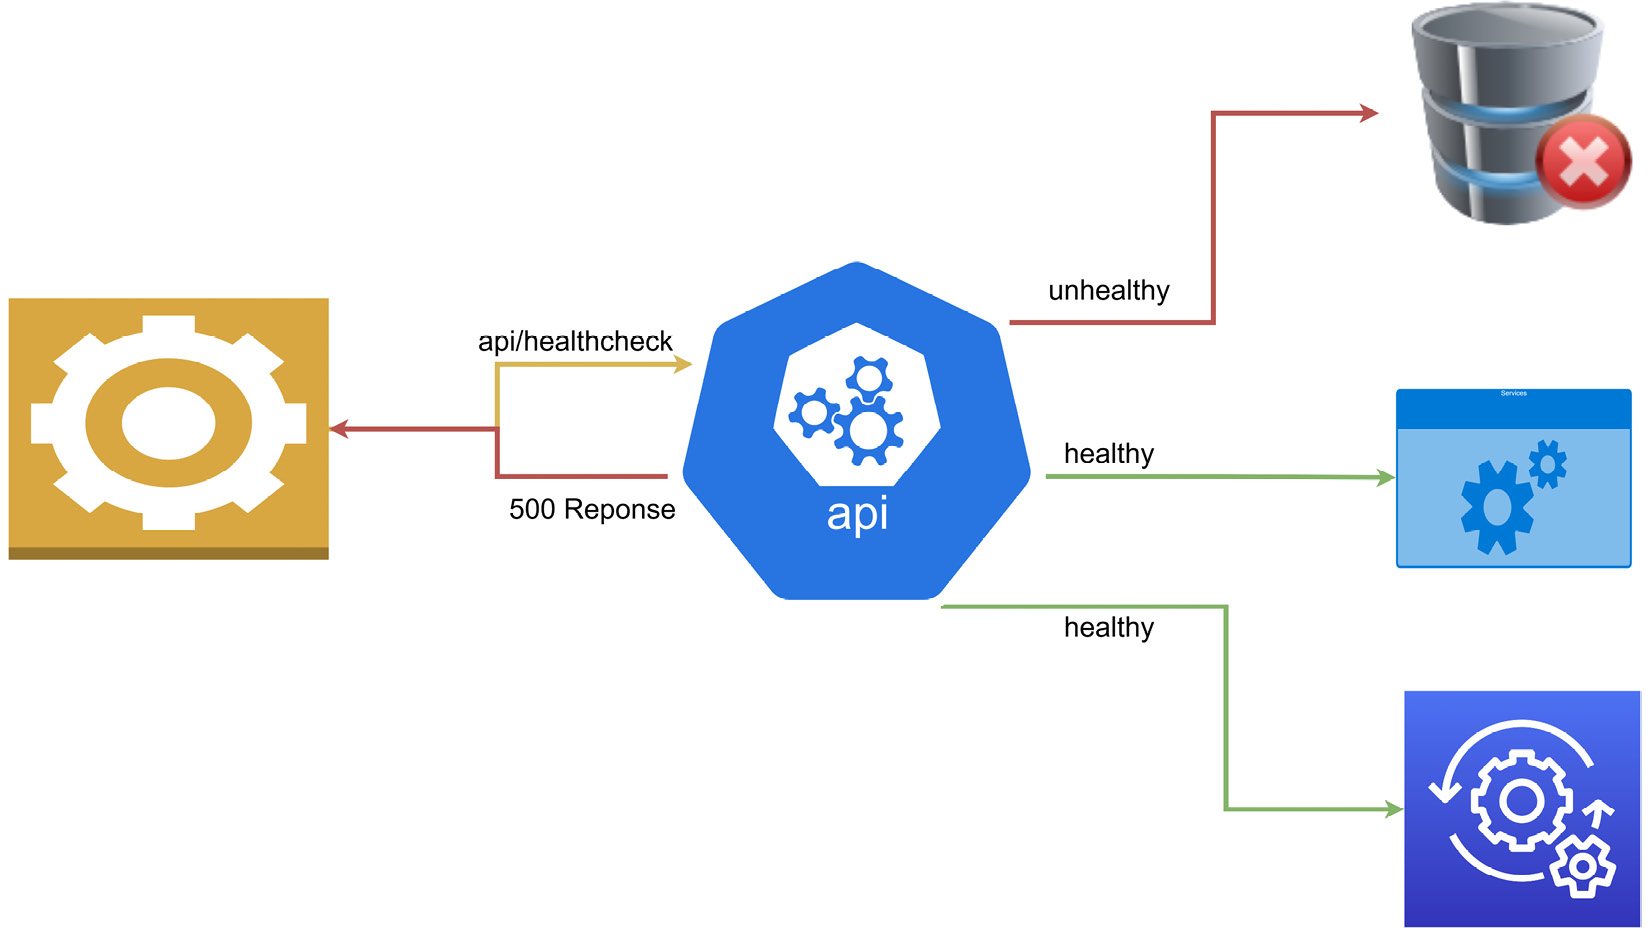
Figure 10.2 – Shows a health check that sent a failure response since one of the services was not available
The health of a service depends on several things, including correct configuration, access to keys and dependencies, the status of the hosting platform and infrastructure, and the connection to the database. They may also be used for external application monitoring and overall application health.
A common deployment model for microservices is using container orchestrators, such as Kubernetes, to deploy and run our services in production. Most orchestrators perform periodical liveness health checks on their pods during runtime and readiness health checks during deployments. Health checks help the orchestrator determine which pods are in a ready state and are capable of handling traffic. It is important to understand the differences between the liveness health check and the readiness health check and when which one is most suitable. The easier one to implement is the liveness health check; we will discuss this next.
The liveness health check
The liveness health check endpoint is a specific endpoint that is implemented for the sole purpose of the health check. In this health probe, the service is considered healthy when it responds to the liveness health check. A failure to respond to this endpoint indicates a serious issue with the application. This issue could be caused by a range of reasons, such as a crash or unplanned application restart. For this reason, restarting an application that has failed this check is a common course of action.
Applications that monitor the infrastructure, such as Kubernetes monitoring Docker containers, use liveness health checks to determine the health of pods and trigger restarts as needed. Cloud providers also offer health probe functionality with load balancers, which can check the availability of the deployed application by periodically sending a request to the liveness check endpoint. This approach is generally sufficient for web applications and services as we do not need a complicated liveness check endpoint. If the service can accept the request and return a response, then we consider it healthy.
Checking whether the application or services is alive is simple enough, but we may also need to mitigate false positives after application deployments and/or upgrades. This can occur when the application might not be completely ready for usage, yet we are getting positive responses from the liveness checks. At this point, we need to consider implementing readiness health checks.
Readiness health checks
Readiness health checks are used in situations where we need to verify more than just an HTTP response. An application with several third-party dependencies might take longer to be ready for use. So, while it is operational and able to respond to a simple HTTP request, the databases or message bus services, for instance, might not yet be ready. We want to ensure that we have a full picture of the status of the application from a startup perspective before proceeding to use it or continuing with the deployment activity.
A readiness health check will generally only return a healthy status once the startup task has been completed. These checks will then take a bit longer to return a healthy status than a liveness health check will. With readiness health checks in place, an orchestrator will not attempt to restart the application, but it will not route request traffic. Kubernetes can perform readiness probes periodically during the application’s runtime, but it can also be configured to only perform this probe during the startup of the application. Once the application reports that it is healthy, then this probe will not be executed again for the lifetime of the application.
This readiness health check is best used for applications where there are long-running tasks that must finish before the application can be considered ready and operational. Recall that with microservices, we introduce several additional infrastructure dependencies, and we need to monitor and confirm the overall health of the system to ensure that only the healthiest pods get traffic directed to them. Therefore, properly configuring health checks is essential to ensuring that we have the best representation of our application’s health.
Now that we have explored how health checks work and how orchestrators and monitoring systems use them, we can explore implementing health checks in our ASP.NET Core API.
Implementing ASP.NET Core health checks
ASP.NET Core has a built-in health check middleware that allows us to natively implement very robust health checks. This middleware is not limited to API projects, and it comes in handy to help us to monitor the health of our application. Both readiness and liveness health checks can be created natively, and there is support for a UI dashboard. Using the liveness health check, which is relatively simple to implement, we can implement a simple API endpoint that returns a simple response, as expected. We can also check on the health of the dependencies of the app using a more comprehensive readiness health check.
For this example, we will be adding liveness and readiness health checks to our appointment booking service. This service has several dependencies and is integral to several operations in our application. We need to ensure that it is always healthy and react quickly if it degrades.
Let us start off by exploring how we can outfit an ASP.NET Core API with a liveness health check.
Adding liveness health checks
As discussed, a liveness check is the most basic health check that can be implemented. The basic configuration needed for this in our ASP.NET Core application is to register the AddHealthChecks service and the addition of the health check middleware, where we define a URL.
We make the following changes to the Program.cs file:
var builder = WebApplication.CreateBuilder(args);
// code omitted for brevity
builder.Services.AddHealthChecks();
var app = builder.Build();
// code omitted for brevity
app.MapHealthChecks("/healthcheck ");
app.Run();
Any attempt to navigate to the /healthcheck endpoint will yield a simple plain text response as HealthStatus. The possible HealthStatus values are HealthStatus.Healthy, HealthStatus.Degraded, or HealthStatus.Unhealthy.
Health checks are created using the IHeathCheck interface. This interface allows us to extend the default health checks and add more logic to our health check and further customize the possible response values. We can create a health check extension using the following code block:
 public class HealthCheck : IHealthCheck
{
    public Task<HealthCheckResult> CheckHealthAsync(
        HealthCheckContext context, CancellationToken =
            default)
    {
        var healthy = true;
        if (healthy)
        {
            // additional custom logic when the health is
            confirmed.
            return Task.FromResult(
                HealthCheckResult.Healthy("Service is
                    healthy"));
        }
        // additional custom logic when the api is not
           healthy
        return Task.FromResult(
            new HealthCheckResult(
                context.Registration.FailureStatus,
                    "Service is unhealthy"));
    }
}
This inheriting from IHeathCheck forces us to implement the CheckHealthAsync method. This method gets called when a health check is triggered, and we can include additional code to check other factors and determine whether we deem our application to be healthy or not. Based on the value of healthy, we can return a custom message.
Now to add HealthCheack to our services, we modify the AddHealthChecks service registration like this:
builder.Services.AddHealthChecks()
    .AddCheck<HealthCheack>("ApiHealth");
Here, we add our new health check logic and give it a name for a specific reference in other parts of the application. This AddCheck method allows us to define a name for the health check, a default failure status value, tags to map to custom health check endpoints, and a default timeout value.
Now building on the notion that our orchestrators and load balancers that are performing health checks will also prefer to see appropriate responses relative to the health status, we can extend the app.MapHealthChecks middleware code to return a specific HTTP response relative to the health status. While we are at it, we can also disable cached responses:
app.MapHealthChecks("/healthcheck", new HealthCheckOptions
{
    AllowCachingRepsonses = false,
    ResultStatusCodes =
    {
          [HealthStatus.Unhealthy] =
                 StatusCodes.Status503ServiceUnavailable,
        [HealthStatus.Healthy] = StatusCodes.Status200OK,
        [HealthStatus.Degraded] = StatusCodes.Status200OK,
    }
});
The next thing we may want to investigate is returning details in our response. As it stands, we are only returning the plain text response with the status. We can use methods found in the System.Text.Json library to create a custom delegate method that can be implemented as follows.
We first need to indicate to the middleware that we have a custom ResponseWriter called WriteJsonResponse. We need to add this to the list of HealthCheckOptions, using the following:
app.MapHealthChecks("/healthcheck", new HealthCheckOptions
{
    // code omitted for brevity
    ResponseWriter = JsonResponse
});
We then define the WriteJsonResponse writer with the following:
private static Task JsonResponse(HttpContext context,
    HealthReport healthReport)
{
    context.Response.ContentType = "application/json;
        charset=utf-8";
   var options = new JsonWriterOptions { Indented = true };
    using var memoryStream = new MemoryStream();
    using (var jsonWriter = new Utf8JsonWriter
        (memoryStream, options))
    {
        jsonWriter.WriteStartObject();
        jsonWriter.WriteString("status",
            healthReport.Status.ToString());
        jsonWriter.WriteStartObject("results");
        foreach (var healthReportEntry in
           healthReport.Entries)
        {
            jsonWriter.WriteStartObject
                (healthReportEntry.Key);
            jsonWriter.WriteString("status",
                healthReportEntry.Value.Status.ToString());
            jsonWriter.WriteString("description",
                healthReportEntry.Value.Description);
            jsonWriter.WriteStartObject("data");
            foreach (var item in
                healthReportEntry.Value.Data)
            {
                jsonWriter.WritePropertyName(item.Key);
                JsonSerializer.Serialize(jsonWriter,
                    item.Value,
                    item.Value?.GetType() ??
                        typeof(object));
            }
            jsonWriter.WriteEndObject();
            jsonWriter.WriteEndObject();
        }
        jsonWriter.WriteEndObject();
        jsonWriter.WriteEndObject();
    }
    return context.Response.WriteAsync(
        Encoding.UTF8.GetString(memoryStream.ToArray()));
}
Figure 10.3 shows the results of a health check:
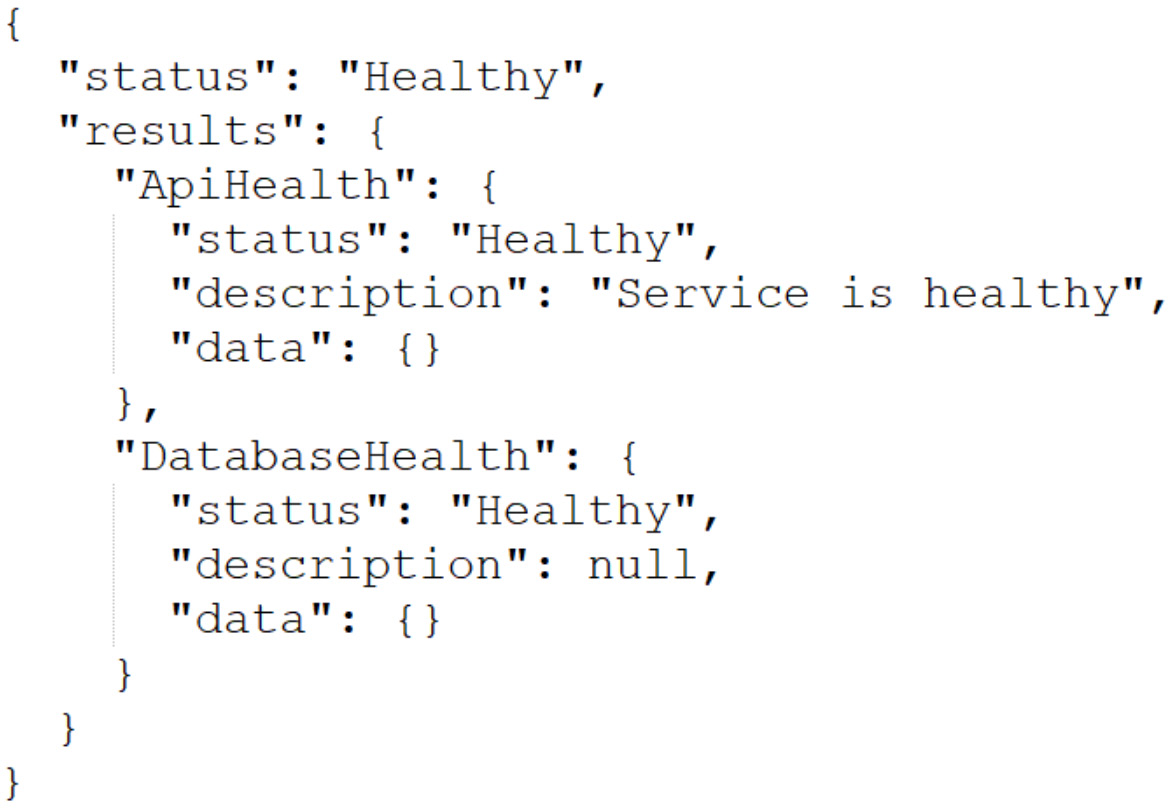
Figure 10.3 – Shows a health check response where both the service and database are available and in good health
Now we can include details about the health status if the API reports an unhealthy or degraded status. Furthermore, when we add more health checks, the content of this JSON response will be populated with each check’s details.
Figure 10.4 shows the results of an unhealthy check:
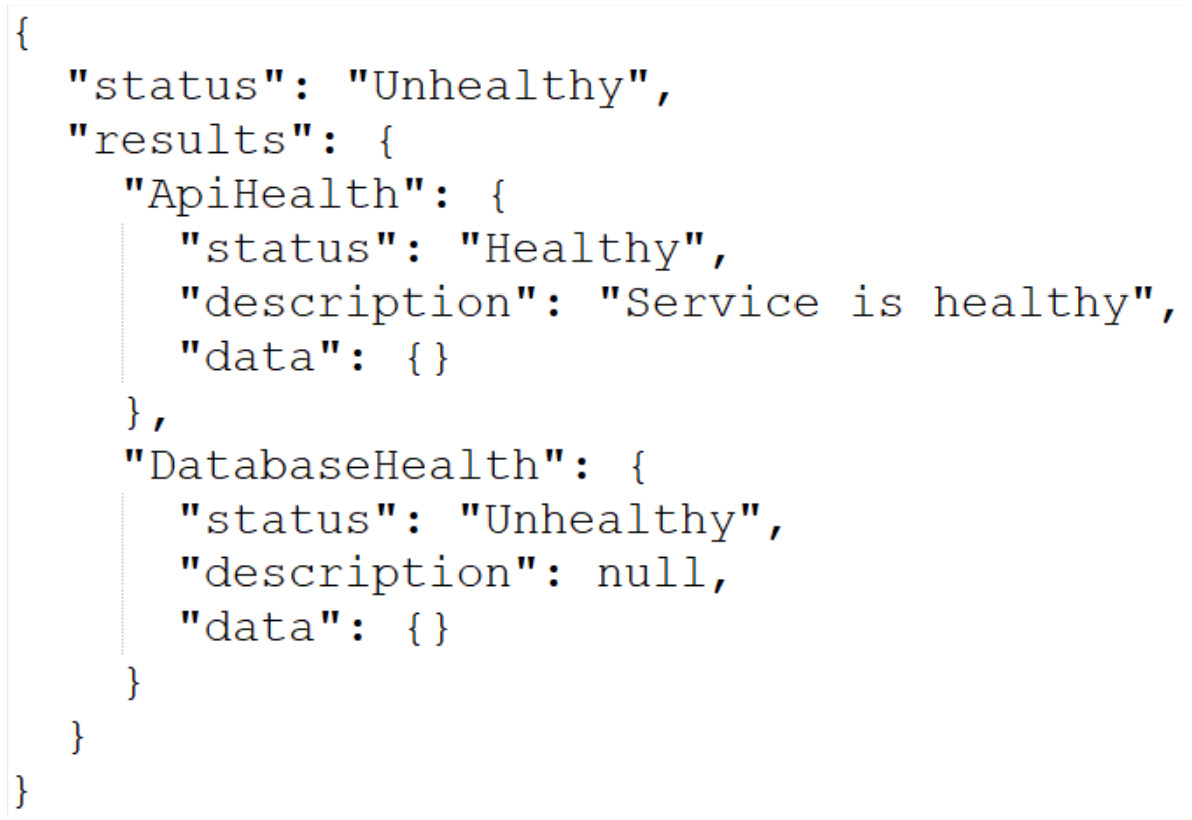
Figure 10.4 – Shows a health check response where the database is not available
Now that we have more detailed responses, we can add more detailed checks, such as a database probe. This will serve as a check to verify that the API can communicate with the database through the configured database. By extension, since we are using Entity Framework for this connection, we can implement a DbContext check. We start with the Microsoft.Extensions.Diagnostics.HealthChecks.EntityFrameworkCore NuGet package. We then modify the AddHealthChecks method registration using the following piece of code:
builder.Services.AddHealthChecks()
    .AddCheck<HealthCheack>("ApiHealth")
      .AddDbContextCheck<ApplicationDbContext>
        ("DatabaseHealth");
This context health calls Entity Framework Core’s built-in CanConnectAsync method and uses that response to infer the database connectivity health.
Now that we can check on the health of our service and its connectivity to our database let us configure it for readiness checks.
Adding readiness health checks
As we have discussed, the readiness check indicates when the application and its dependencies have started successfully and are ready to begin receiving requests. We can define a separate endpoint for the readiness check and further customize the checks that should be performed based on the URL used.
To implement liveness and readiness checks on different URLs, we can add a tags parameter to the extensions to the AddHealthChecks method. This allows us to pass in an array of tag names. We can tag our health checks like this:
builder.Services.AddHealthChecks()
    .AddCheck<HealthCheack>("ApiHealth", tags: new[] {
      "live"})
 .AddDbContextCheck<ApplicationDbContext>("DatabaseHealth",
    tags: new[] { "ready" });
Now that we have tagged our health checks, we can proceed to create our specific check endpoints and associate them with the tags:
app.MapHealthChecks("/healthcheck/ready", new
    HealthCheckOptions
{
    Predicate = healthCheck =>
        healthCheck.Tags.Contains("ready"),
    // code omitted for brevity
});
app.MapHealthChecks("/healthcheck/live", new
    HealthCheckOptions
{
    Predicate = healthCheck => false;
    // code omitted for brevity
});
With this new code, the /healthcheck/ready endpoint will filter only health checks that are tagged as ready. In the /health/live endpoint, we set the predicate value to false to ignore all tags and conduct all health checks.
While we will not be exploring Kubernetes or other orchestrators in detail, we want to look at how orchestrators interact with our health check endpoints.
Configuring health probes in orchestrators
Monitoring is not unique to orchestrators, as we have already established. There are services that offer monitoring services for our applications and allow us to configure probes into our applications. These services generally allow us to add alerts and configure response time thresholds. These alerts can come in handy in helping us to respond to failures or situations of concern based on our configured thresholds.
In a microservices application, we need a way of monitoring many services as efficiently as possible. The fewer unique configurations we need to do, the better. We have several deployment models that can be used, and most predominantly, containers managed by orchestrators. Microsoft Azure has several web application deployment models, including Web App for Containers (WAC), Azure Container Instances (ACI), and Azure Kubernetes Service (AKS).
WAC is a part of App Service, so the health check works the same way as it would for an Azure web app. It allows you to specify a health check endpoint that will return a response within the 2xx and 3xx HTTP response range. It should also return this health check response within a minute for the service to be considered healthy.
The next option is the ACI, where health checks are called health probes. These probes are configured with a check period, which determines the frequency with which checks are made. When the health check is completed successfully, then the container is considered healthy, and if not, then it is unhealthy or just unavailable. With the ACI, we can configure both liveness and readiness health checks. Our probes can either execute a command on the container or perform an HTTP GET request. When we perform a liveness probe, we verify that our container is healthy, and if not, the ACI might proceed to shut down the container and spin up a new instance. The readiness probe is designed to confirm whether a container is available for request processing, which, as we discussed, is more important during the application startup process.
In the Azure Kubernetes Service of AKS, we have a very similar approach to health checks and probes, as we saw in the ACI. Out of the box, Kubernetes supports both liveness and readiness probes; as seen before, the major difference is that Kubernetes suggests that you have a separate probe for checking the application’s health at startup, separate from the readiness probe that is continuous during the application runtime. We can also implement HTTP GET request probes as well as TCP probes to check on our containers.
Kubernetes is configured using a markup language called YAML Ain’t Markup Language (YAML), which is a human-friendly scripting language. Kubernetes administrators use YAML to define configurations called a manifest. This manifest is then used to infer Kubernetes objects. A Kubernetes deployment specifies the configuration for a deployment object, which then creates pods. Each governs the running of specific containers as outlined in the spec.template field of the YAML configuration.
The following is an example of a YAML configuration that creates a deployment object that performs startup, liveness, and readiness health checks on a container:
apiVersion: v1
kind: Pod
metadata:
  labels:
    test: liveness-api
  name: liveness-http
spec:
  ports:
  - name: api-port
    containerPort: 8080
    hostPort: 8080
  containers:
  - name: liveness-api
    image: registry.k8s.io/liveness
    args:
    - /server
    livenessProbe:
      httpGet:
        path: /healthcheck/live
        port: api-port
      initialDelaySeconds: 3
      failureThreshold: 1
      periodSeconds: 3
    startupProbe:
      httpGet:
        path: /healthcheck/ready
        port: api-port
      failureThreshold: 30
      periodSeconds: 10
    readinessProbe:
      httpGet:
        path: /healthcheck/ready
        port: api-port
      failureThreshold: 30
      periodSeconds: 10
The sections of the YAML file that outline the health checks are livenessProbe, startupProbe, and readinessProbe. The probe definition with the major difference is the readiness probe, which executes a command as opposed to making a call to an endpoint.
With this, we have gained some fundamental knowledge of health checks, how they work, and why we need them.
Summary
Health checks are simple yet powerful constructs that aid us in ensuring that our applications are running at maximum efficiency. We see where it is important for us to not only monitor and report on the uptime of the service but also the dependencies, such as the database and other services that may be needed for the application to operate properly.
Using ASP.NET Core, we have access to a built-in health check mechanism that can be customized and extended to implement specific checks and associate them with different endpoints. This is especially useful when we need to separate the types of tests that are conducted relative to the endpoint being called.
We have also explored how orchestrators can be configured to poll our health check endpoints. Orchestrators make monitoring and responding to failures easier since they will handle the routing of traffic to healthy instances and restart instances as needed.
Health checks help us not only monitor the target web service, but we can also configure health checks to report on downstream services as well. This will come in handy, especially when we implement dependencies between our microservices through patterns like the API gateway pattern. We will investigate implementing this pattern in the next chapter.