
14
Implementing Centralized Logging for Microservices
One of the biggest challenges with APIs is the fact that we rarely get actual feedback on what is happening in our service. We do our best to design our services in a way that our HTTP responses indicate the success or failure of each operation, but this is not always enough. The most concerning types of responses are those in the 5xx range, without any useful information behind them.
For this reason, we need to employ logging in our microservices application. Logging produces real-time information on the operations and events occurring in the service. Each log message helps us to understand the behavior of the application and aids with our investigations when things go wrong. So, the logs are the first line of defense against the ambiguous 5xx HTTP responses.
During development, logs help us to contextualize some of the issues that we face and give us, when implemented well, a play-by-play sequence of the functions being called and their output. This will help us to more easily discern where our code might be breaking or why a function’s output is less than desired.
In the case of a distributed application, we need to implement special measures that help us to centralize the logs being produced by the individual services. Yes, we are promoting autonomy in this kind of architecture, but all the components still combine to produce one application. This makes the point of failure more difficult to find if we need to sift through several log files and sources.
After reading this chapter, we will be able to do the following:
- Understand the use of log aggregation
- Know how to implement performance monitoring
- Know how to implement distributed tracing
Technical requirements
The code references used in this chapter can be found in this project’s repository, which is hosted on GitHub at https://github.com/PacktPublishing/Microservices-Design-Patterns-in-.NET/tree/master/Ch14.
Logging and its importance
Logs are blocks of text that most applications produce during runtime. They are designed to be human-readable mini-reports about what is happening in the application, and they should allow us to be able to track and trace errors that occur in our applications.
In a monolithic application, we typically write logs to a log file or a database. In fact, in .NET Core, we have access to powerful logging providers and third-party libraries that allow us to integrate with several log output destinations. There is no real best destination and while some work better than ours, it is a matter of project preference and overall comfort. Our monolithic logs contain information about everything happening in one application.
In a distributed system, this becomes more complex since we have activities happening across several applications. The first inclination is to create logs per service, which might result in several log files, each containing bits of the overall information that we need to see for the application. Imagine needing to visit several log files to investigate a failure that occurred at 5:00 P.M. To understand this failure, we will need to review several sources to piece together anything sensible, which can be a difficult task.
This investigation gets even more difficult if our logs are too verbose. A verbose log reports everything that occurs in the application. Even if we don’t report everything, we need to be pointed with what we log to reduce the noise and better highlight the key events that need to be captured.
We will then need a clean way to centralize the logs that are generated across the services. A centralized database may seem like a good idea, but it may lead to resource and table locking if several services are attempting to write logs frequently. We will review the best centralization techniques later. For now, let us focus on deciding what are the best bits of information to log and how that can be achieved in .NET Core.
Choosing what to log
An important decision while implementing logging is what we want to log. Do we want to log a play-by-play sequence of everything that happens in our application, or do we only want to make note of the errors? Different systems have different requirements, and the correct choices depend on how crucial the service is to the overall running of the application.
Now that we have determined the most essential services that need to be monitored more through logs, we need to determine what information will be logged. Recall that we don’t want our logs to be too chatty, but we don’t want to neglect to place pertinent information in the logs. Too much information can lead to large useless logs and high storage costs, and too little information will give us useless files.
Useful information would include, but is not limited to the following:
- The ID of a resource that is being accessed through an API request
- The different functions being invoked during a request cycle
What we want to avoid is logging sensitive information. We do not want to log the following, for example:
- User credentials during an authentication flow
- Payment information
- Personally identifiable information
Despite our best security efforts, logs remain a source of truth about our system, and a security breach on log files that contain sensitive information could prove to be a detrimental event. There are legislations and data protection laws that govern how we should store and secure our logs. Therefore, it is better to log just IDs that can be looked up on demand, without giving any information away upfront.
We also have the concept of log levels, which are a categorization of the severity of a log message. These levels are split into information, debug, warning, error, and critical. There might be other categories in between, but these are the most used ones. This is what they stand for:
- Information: A standard log level that is used when something has happened as expected. They are generally used to share information about an operation and can be useful in helping to trace the sequence of operations that might have led to an error.
- Debug: A very informational log level that is more than we might need for everyday use. It is mostly useful for development and helps us to track more intricate operations in the code. Production systems generally do not produce debug logs.
- Warning: This log level indicates that something has happened that isn’t an error but isn’t normal. Think of it as an amber light that suggests that some attention should be given to a situation, but it might not be mission critical.
- Error: An error is an error. This type of log entry is usually created when an exception is encountered. This can be paired with the exception and stack trace and proves to be a critical type of log to have when debugging issues.
- Critical: This indicates that we encountered an error that we cannot recover from. This kind of log entry can be used when the application fails to start or fails to connect to a critical data source or dependency.
Log levels are a universal language, and we should ensure that we accurately represent the situation being logged with the appropriate log level. We also want to avoid misclassifying our events and logging misleading information about what has happened in our system.
Once again, the ultimate decision on what is logged is relative to the application, developer’s, and organization’s needs and we need to ensure that we are thorough enough to capture the essential bits about the application’s runtime. Now, let us review how we implement logging in to a .NET Core application.
Using the .NET logging API
.NET has a built-in logging mechanism that is baked into our application startup operation. We get an out-of-the-box logging library that produces logs on all the happenings of our application as soon as it is started. This mechanism works with several third-party logging providers, making it extensible and powerful just the same. With our providers, we can determine the target destinations for our logs.
We will start with the ILogger interface. This interface is an abstraction of the logging API that ships with .NET. It is made available to us through the Microsoft.Extensions.Logging NuGet package. This library provides us with the necessary classes, interfaces, and functionality for application logging and has providers for logging to Console, Debug, Azure Log Stream, EventSource, and Windows Event Log:
- Console: This provider outputs logs to the console. A console window appears when debugging and most IDEs (contextually, Visual Studio and Visual Studio Code) provide a debugging console window for runtime logs.
- Debug: This provider writes log entries using the System.Diagnostics.Debug class.
- EventSource: A cross-platform provider that can act as an event source with the name Microsoft-Extensions-Logging.
- Windows Event Log: A Windows-only provider that sends log output to the Windows Event Log. It will only log Warning level messages by default but can be configured as needed.
- Azure Log Stream: Azure Log Stream supports viewing logs from the Azure portal during application runtime. We can easily write logs to this provider.
To get our .NET application to begin writing logs, we can simply inject ILogger<T> into the class from which logs should originate. T represents the name of the class that we are injecting the service into. This helps with log categorization and filtering later because the logs will automatically indicate the class name when they are generated. ILogger<T> is usually used by application code, which may exist in several places. Because the class name is being used as a category, it makes it easy for us to link the log entries back to the class that produced them. In the following code, we are injecting ILogger<T> into our appointments service controller:
public class AppointmentsController : ControllerBase
    {
        /* Other fields */
        private readonly ILogger<AppointmentsController>
            logger;
        public AppointmentsController(/* Other Services */,
            ILogger<AppointmentsController> logger)
        {
            this.logger = logger;
        }
    }
Injecting ILogger<T> is standard compared to how we inject other services. The benefit of now having this logger present is that we can write logs to inform of the activities and errors in our API. If we need to log each time a list of appointments is retrieved through an API call, we can modify our GET method like this:
// GET: api/Appointments
        [HttpGet]
        public async Task<ActionResult<Ienumerable
            <Appointment>>> GetAppointments()
        {
            Logger.LogInformation("Returning
                Appointments");
            return await _context.Appointments
               .ToListAsync();
        }
Now, when we make requests to the GET method for this service, we will see a message that looks like this appear in our console. Here, “console” refers to the console window that launches and shows us startup messages about the running .NET application, as well as the debug output in the IDE we are using:
HealthCare.Appointments.Api.Controllers.AppointmentsController: Information: Retrieving appointments
Note that we can see not only the source calls but its namespace, which also plays a big role in helping us to determine which exact class is producing the log. We also get a log-level flag so that we can tell the severity at first glance. You will also notice that there are many other default log entries that we didn’t orchestrate. We can control the global levels and sources of logs that we wish to have in our application through the appsettings.json file. By default, it will have the following configuration:
"Logging": {
    "LogLevel": {
      "Default": "Information",
      "Microsoft.AspNetCore": "Warning"
    }
  },
This specifies that the minimum default level that should be output to the destinations is Information for the default logging source. Anything related to the inner workings of our application should only surface when it is a Warning. If we modified and placed them both at Information, then our logs would become far more chatty from the get-go.
Our LogLevel methods have a standard layout that allows us to easily include additional information as needed. The possible parameters are as follows:
- eventId: A numeric value that you would associate with an action in your application. There is no predefined standard for this, and you can assign your own values based on your organization and needs. This is an optional parameter but can be useful when we need to associate logs with a particular action.
- Exception: This is most useful when we are logging an error or critical message and wish to include the details of the exception in the log. It is optional, but it is strongly suggested that you include it whenever an exception object is available, such as after catching an exception in a try/catch block.
- Message: Message is a straightforward text field. It is arguably the most important one as it allows us to express our custom thoughts on the event being logged. It is a parameterized string that allows us to use placeholders and provide variable values, without needing to concatenate or interpolate the string. An example of such a text looks like “Logging request from {username}”. The value of {username} should then be provided in messageArgs.
- messageArgs: This is an array of objects that will bind to placeholders that are outlined in the message string. The binding will occur in the order that the parameters appear, so the values should be provided in that order as well. If a value is not provided, the placeholder will be printed out in the string.
An example that uses all the parameters could look something like this:
public async Task<ActionResult<AppointmentDetailsDto>>
    GetAppointment(Guid id)
        {
            try
            {
                var appointment = await
                    _context.Appointments.FindAsync(id);
                if (appointment == null)
                {
                    return NotFound();
                }
                // Other service calls
                var patient = await _patientsApiRepository
                    .GetPatient(appointment
                        .PatientId.ToString());
                var appointmentDto = _mapper.Map
                   <AppointmentDetailsDto>(appointment);
                appointmentDto.Patient =
                    _mapper.Map<PatientDto>(patient);
                return appointmentDto;
            }
            catch (Exception ex)
            {
                logger.LogError(100, ex, "Failure
                    retrieving apointment with Id: {id}",
                        id);
                throw;
            }
        }
Here, we added exception handling to our endpoint, which gets the appointment record by ID. If there is an exception in carrying out any of the operations, we catch it and log it. We are using 100 as the eventId property for this operation, and we are logging the exception and including a custom message with some more information to help us contextualize the nature of the exception. We also included the ID of the record that caused the failure; notice the {id} placeholder that will map to the id argument. Giving your parameters the same name is not necessary, but it does help to reduce any confusion with the value bindings.
If we want to extend the number of providers that should be used for each log message, we can configure the logging settings in the Program.cs file of our application. In a standard boilerplate ASP.NET Core project, we can add code that looks like this:
builder.Logging.ClearProviders();
builder.Logging.AddConsole()
    .AddEventLog(new EventLogSettings { SourceName =
        "Appointments Service" })
    .AddDebug()
    .AddEventSourceLogger();
First, we must clear any preconfigured providers and then add all the providers that we wish to support. Now, one log message will be written to several destinations. This can be a convenient way to fan out our log messages and have different monitoring methods attached to each destination. Remember that you should always be aware of the information security rules that govern your country and company and try not to expose too much information in too many places. We can also provide specific configurations per provider by modifying the logging configuration in the appsettings.json file, like this:
{
  "Logging": {
    "LogLevel": {
      "Default": "Error",
      "Microsoft": "Warning",
      "Microsoft.Hosting.Lifetime": "Warning"
    },
    "Debug": {
      "LogLevel": {
        "Default": "Trace"
      }
    },
    "Console": {
      "LogLevel": {
        "Default": "Information"
      }
    },
    "EventSource": {
      "LogLevel": {
        "Microsoft": "Information"
      }
    },
    "EventLog": {
      "LogLevel": {
        "Microsoft": "Information"
      }
    },
  }
}
We retain our default LogLevel for each log source, but then provide overrides per provider. If the log source is not defined underneath the provider’s configuration, then it will retain the default behaviors, but we do reserve the right to control what type of log each provider should prioritize.
If we need to extend support to Azure systems, we could make use of the Azure application’s file storage and/or blob storage. We can start by including Microsoft.Extensions.Logging.AzureAppServices via the NuGet package manager and then we can configure the logging services with code like this:
builder.Logging.AddAzureWebAppDiagnostics();
builder.Services.Configure<AzureFileLoggerOptions>
    (options =>
{
    options.FileName = "azure-log-filename";
    options.FileSizeLimit = 5 * 2048;
    options.RetainedFileCountLimit = 15;
});
builder.Services.Configure<AzureBlobLoggerOptions>
    (options =>
{
    options.BlobName = "appLog.log";
});
This will configure the app to use the filesystem as well as Blob storage in Azure. Based on App Services logs settings, there are some defaults that we can look for in terms of log output locations. Similarly, we can override the default logs that are being outputted by this provider by adding sections to the appsettings.json file with the aliases AzureAppServicesBlob and AzureAppServicesFile. We can also define ApplicationInsights if we intend to use that service for our application. To support ApplicationInsights, we need the Microsoft.Extensions.Logging.ApplicationInsights NuGet package. Azure Application Insights is a powerful log aggregation platform provided by Microsoft Azure and is an excellent choice for an Azure-hosted solution.
Several third-party frameworks extend the capabilities of the built-in logging API of .NET. We will explore how to integrate a popular one called Serilog in the next section.
Adding Serilog
Several third-party frameworks exist that extend the logging capabilities and options available to us in our .NET applications. Popular options include Serilog, Loggr, Elmah.io, and NLog to name a few. Each one has its pros and cons, but in this section, we will be exploring Serilog, how we can integrate it into our application, and what options it introduces to us.
Serilog extends Microsoft.Extensions.Logging and provides quick and fairly easy ways to override the default settings while retaining the full power and flexibility of the original framework. To get started, we need to install the Serilog.AspNetCore package. For non-web .NET Core projects, we need to use Serilog.Extensions.Hosting:
Install-package Serilog.AspNetCore
Serilog has the concept of using sinks. A sink is like a logging provider in concept and represents an output channel for the logs being written by the framework. We need to add additional packages per sink that we wish to support. Popularly used sinks include Console, File, Seq, SQL Server, and Azure Application Insights, just to name a few. You can get a complete list from their GitHub wiki page: https://github.com/serilog/serilog/wiki/Provided-Sinks.
For this exercise, we will be configuring Serilog to use the file and console sinks. We will also be adding parameters to our appsettings.json file. We will need the expressions extension to the base library to support parsing the JSON text into the required settings:
Install-package Serilog.Expressions
Now, we can remove the Logging section from our appsettings.json file and replace it with the following JSON text:
  "Serilog": {
    "MinimumLevel": {
      "Default": "Information",
      "Override": {
        "Microsoft": "Warning",
        "Microsoft.Hosting.Lifetime": "Information"
      }
    },
    "WriteTo": [
      {
        "Name": "File",
        "Args": { "path":  "./logs/log-.txt",
           "rollingInterval": "Day" }
      }
    ]
  },
Now, we have a similar structure where we can define logging defaults for the application, but we also have a WriteTo section that allows us to list the different channels that we want to support. We have only included the settings for File writes, and we have specified the target location to be a local folder called logs. Files will be created daily and automatically be given a name that is a combination of the log- expression and a date. This will make it easy for us to source the relevant files by day and each log will indicate a timestamp, making it easier to review the events.
Now, we can remove the builder.Logging(…) configuration and replace it with this:
  builder.Host.UseSerilog((ctx, lc) => lc
        .WriteTo.Console()
        .ReadFrom.Configuration(ctx.Configuration));
This will initialize our logger to use the Console sink and read the configuration object for the Serilog section defined previously. This will initialize the Console and File sinks. We can now look forward to seeing text files getting created and populated daily for each microservice that has implemented the file logging configuration for Serilog. The code that is needed to write the logs remains the same. We only need to repeat the injection steps outlined for ILogger<T>; Serilog will do the rest.
Now, we have solved one issue where we are no longer blind to what is happening in our application. We can easily integrate logging into our services and review a more persistent output in the form of log files. However, we still have the challenge of needing to review several disparate logs across different systems to properly track what may have led to a failure at some point.
This is where we need to explore methods of aggregating the logs and having them visible and searchable from one interface. We will explore how this can be done in the next section.
Log aggregation and its uses
Log aggregation is the concept of capturing and consolidating logs from different sources into a centralized platform. This comes in handy in a distributed system where logs are generated from several sources, and we need a comprehensive view of all the messages and need to correlate and analyze the logs efficiently.
This log aggregation acts as a single source of truth when we need to troubleshoot application performance and errors or identify bottlenecks and points of failure or vulnerability. Several platforms allow us to aggregate our logs and they range from free to paid to cloud-hosted solutions. Some popular ones are Azure Application Insights, Seq, DataDog, and ELK (Elasticsearch, Logstash, and Kibana), to name a few. In selecting a platform, we must consider the following:
- Efficiency: We all love and want efficient systems. The platform that we choose needs to feed into this narrative and make it as easy as possible to integrate logging, export log information in various formats, and sift and sort through log information as quickly as possible. Most log aggregators allow us to author queries that can intelligently sift through the logging noise and give us more pointed data.
- Processing power: The platform needs to allow for comfortable throughput from several sources and be able to index, compress, and efficiently store these logs. We may not necessarily know their techniques to achieve this, but we can assess the accuracy of the indexing functions through our queries and the overall presentation of the data.
- Real-time features: Real-time monitoring is very important since we generally need log aggregation to monitor what is happening in our application. The more quickly the information is made available to us, the more quickly we can respond to a failure.
- Scalability: The platform needs to be capable of handling varied periods of traffic and not breaking when there is a sudden shift in volume. We need to ensure that the performance of the system does not degrade under increased load.
- Alerting mechanisms: Some platforms have the built-in functionality to alert us to certain types of log events. Even if this is not built-in, we should have integration options through APIs and WebHooks that allow us to integrate with our third-party applications, which is where we spend most of our time.
- Security: Security is very important for our logging information, as we have mentioned previously. An ideal platform will encrypt data while it is at rest and while it is in transit. This is often a given, but we need to make sure. We may also need to be able to control user access.
- Cost: We all love free and cheap solutions. We cannot always have the best of both worlds but we can be sure that the platform offers a good return on the investment, relative to the features that we are being offered. Ensure that you do a proper cost-benefit analysis.
The easier way to integrate with a log aggregation platform is through tools and packages that are optimized for that kind of integration. We need to employ the services of libraries that are tuned to efficiently integrate with these platforms. In the next section, we will see how we can leverage Serilog and integrate with Seq.
Integrating with Seq
Seq, pronounced seek, is a sleek (see what I did there?) log aggregation developed and maintained by Datalust. This platform has been developed to support log messaging templates output by ASP.NET Core, Serilog, and Nlog. It can also be extended to support other development frameworks as needed.
It gives us access to a powerful dashboard with leading data presentation and querying features. Seq can be installed on a local machine for free for individual development but will attract some costs as we look to use it in a more enterprise setting. It also offers a hosted solution, which removes the need for users to set it up locally.
For this activity, we will use it locally and for free on our machine. We now have two options; we can use a Docker image and spin up a container for the application or install it on our local machine. It is available for Windows and Linux operating systems, so we will use the Docker option to cater to all scenarios.
We will start by downloading the Docker image with this command:
docker pull datalust/seq
Now that we have the latest Seq image, we will create our container with this command:
docker run -–name seq -d --restart unless-stopped -e
ACCEPT_EULA=Y -p 5341:80 datalust/seq:latest
Now, we have a container that hosts an instance of Seq and can be accessed through port 5431, which is Seq’s default port. We can now navigate to http://localhost:5341/#/events to see our user interface for the aggregator. It will be empty, so now, we need to integrate our API with this new logging channel.
Now that we have Seq up and running, we can modify our service to begin sending logs to this platform. We already have Serilog installed, so we can add the Seq sink to our project by adding this package:
Install-Package Serilog.Sinks.Seq
With this new package, we can modify our appsettings.json Serilog section and add a new object block to the WriteTo section of the configuration. It will now look like this:
"WriteTo": [
      {
        //  File Configuration
      },
      {
        "Name": "Seq",
        "Args": { "serverUrl": "http://localhost:5341" }
      }
    ]
We already have the configuration section being read at application startup, so the next time that the application starts up, all the default logs will be written to our local file as expected, but now also the Seq platform.
Figure 14.1 shows the Seq interface:

Figure 14.1 – The Seq interface receiving logs from a microservice
Here, we can see the user interface outlining the default logs that get produced at application startup. What appears in this interface is relative to the logging configurations that we have added, as well as the log entries that we make as we go along. You will also notice some color-coded dots, which indicate the log level for the log entry. We can click on a line and expand it to see the details of the log message.
Now, these code modifications can be made to all services that we wish to add to the log aggregation initiative, and we can use this unified platform to interrogate logs as needed. With this in place, we need to understand the concept of log tracing in a distributed setting. We will discuss this next.
Distributed log tracing
Distributed tracing is the method of monitoring logs and tracing issues in a microservices application. Developers and DevOps engineers both rely on logs to follow the path of a request as it travels through the various systems and checkpoints and then attempts to ascertain the point of failure. The more robust the logging, the easier it will be for them to pinpoint weak points, bugs, and bottlenecks in the application.
Because microservices are designed to be autonomous and scale independently, it is common to have multiple instances of the service running simultaneously, which further complicates the request tracing process. We now need to backtrack which instance of the service handled the request, leading to even more complex tracing situations.
Distributed tracing is a technique that is geared toward solving these problems. It refers to a diagnostic methodology behind observing requests as they make their way through distributed systems. Each trace shows the activity of an individual user in the application. In an aggregated logging system, we will end up with a collection of traces that highlight the backend service and dependencies that have the biggest impact on performance. In distributed tracing, we have three main factors that help us to find our way around:
- Trace: Represents an end-to-end request from user activity.
- Span: Represents work done by a single service in a specific period. Spans combine to form a trace.
- Tags: Metadata about the span that helps us to properly categorize and contextualize the logs.
Each span is a step in the entire journey of the request and is encoded with important data relating to the process that is carried out in the operation. This information can include things such as the following:
- The service’s name and address
- Tags that can be used in queries and filters, such as the HTTP method, database host, and session ID, to name a few
- Stack traces and details error messages
.NET has evolved over the years to provide top-notch support for producing logs with these details as seamlessly as possible, through integrations with OpenTelemetry. Microsoft Azure also provides an excellent distributed tracing platform in Azure Application Insights, which is a platform that we mentioned previously. There are many other paid and open source solutions that can support our distributed tracing needs. For this chapter, we will use a free and simple platform called Jaeger. Let us explore how we can add telemetry enhancements to our services and visualize them with Jaeger.
Enhanced logging for distributed tracing
OpenTelemetry is a popular open source project that is at the helm of standardizing logging standards for distributed and cloud-native applications. It helps us to generate and collect detailed logs, also called telemetry data, that contain traces and metrics. Given that it is an open standard, we are at liberty to choose a suitable visualization and analysis tool.
To install OpenTelemetry in our ASP.NET Core application, we need to execute the following commands in dotnet cli:
dotnet add package --prerelease
    OpenTelemetry.Instrumentation.AspNetCore
dotnet add package OpenTelemetry.Exporter.Jaeger
dotnet add package --prerelease
    OpenTelemetry.Extensions.Hosting
Between these three packages, we are installing ASP.NET Core OpenTelemetry support and support for exporting our telemetry data to a distributed tracing analysis platform called Jaeger. Jaeger is free and can be downloaded in ZIP format or set up as a Docker container. You can learn more here: https://www.jaegertracing.io/download/.
Now that we have the packages, we can make the following adjustments to our Program.cs file:
builder.Services.AddOpenTelemetryTracing((builder) =>
    builder
        .AddAspNetCoreInstrumentation(o =>
        {
            o.EnrichWithHttpRequest = (activity,
                httpRequest) =>
            {
                activity.SetTag("requestProtocol",
                    httpRequest.Protocol);
            };
            o.EnrichWithHttpResponse = (activity,
                httpResponse) =>
            {
                activity.SetTag("responseLength",
                    httpResponse.ContentLength);
            };
            o.EnrichWithException = (activity,
                exception) =>
            {
                activity.SetTag("exceptionType",
                    exception.GetType().ToString());
            };
        })
        .AddJaegerExporter()
    );
With this configuration, we are adding OpenTelemetry support to our application’s startup and then outlining various enrichments that we wish to include with each message that is sent to Jaeger. Note that OpenTelemetry has support for a few platforms, and you are at liberty to choose the one that best suits your needs. With this configuration, all traffic to our API endpoints will be logged with as many enrichment data points as we specified.
Figure 14.2 shows the Jaeger interface:
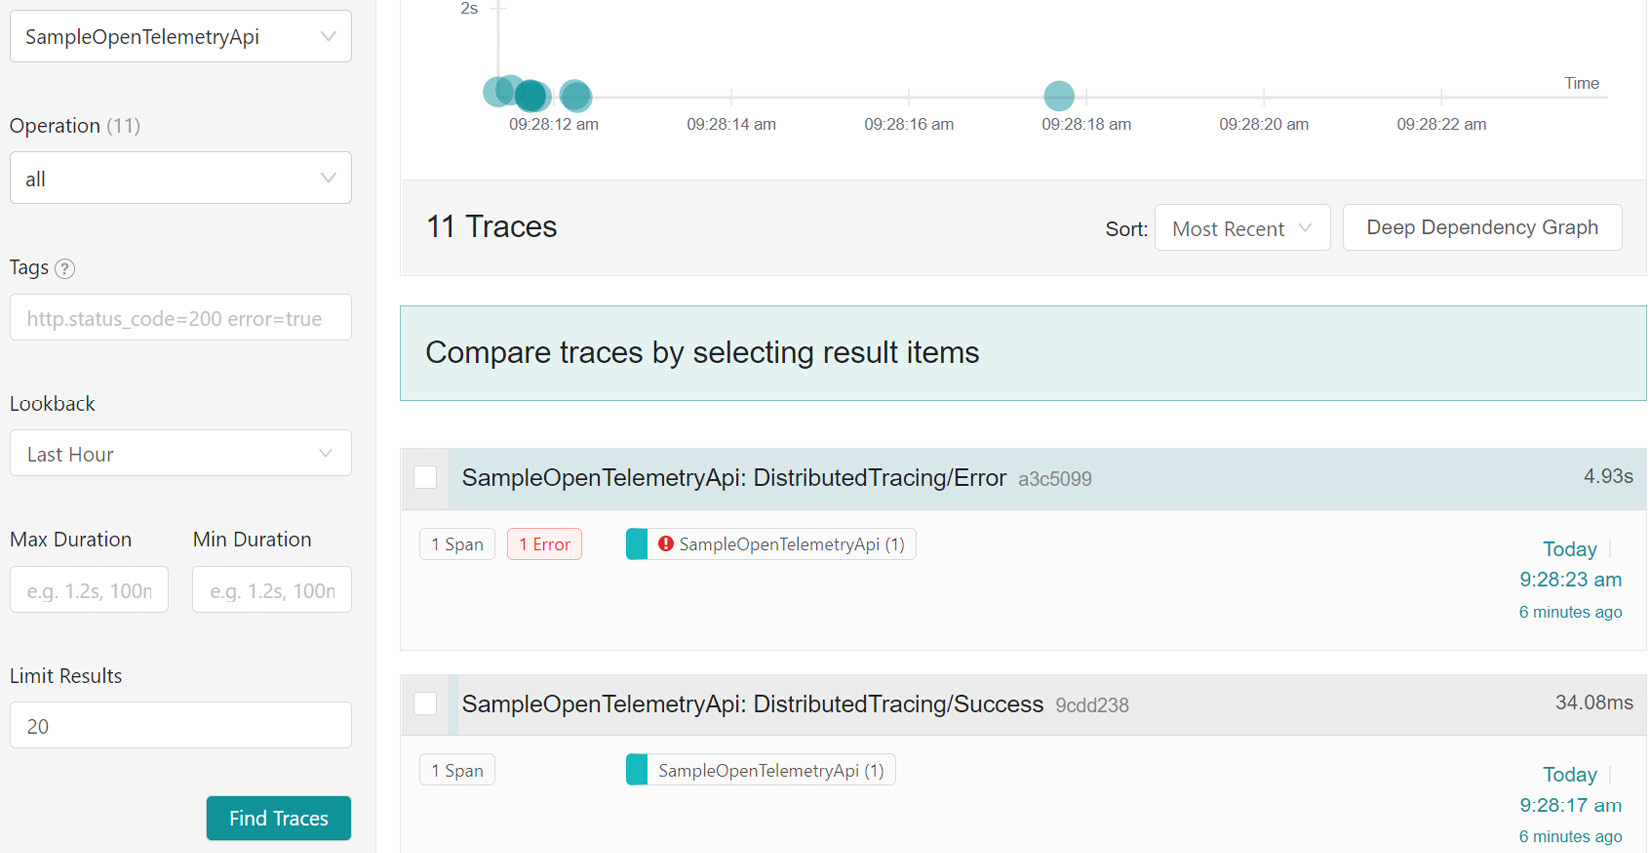
Figure 14.2 – Telemetry data that has been generated and deposited in the Jaeger aggregation platform
Jaeger is simple enough for us to get started and, as depicted in Figure 14.2, we can view all the services that send telemetry data, filter based on the operations we need to see, and review data across a specified timeline. These are general features of distributed tracing platforms and, once again, we need to ensure that we choose one that gives us the best value for our needs.
Now that we have explored logging and distributed tracing, let us wrap up this chapter.
Summary
Logging is a simple concept that can save us a lot of time and trouble when reviewing our applications. The ability to write logs ships with .NET Core and we can easily leverage the native capabilities to begin producing log information about the operations of our applications.
We need to ensure that we do not log sensitive information and we must be aware of company and security policies when authoring our logs. We also need to ensure that our logs are stored securely both in transit and at rest. We also can log to multiple channels, but we should be careful when choosing these channels, relative to our security guidelines.
Several .NET Core frameworks enhance the natural capabilities of the built-in API and introduce even more integrations. A popular choice is Serilog, which has many extensions called sinks, which offer us a wide range of simultaneous log channel options. With it, we can easily create and manage log files on a rolling interval that we specify.
Ideally, we will have multiple services writing logs and it will be tedious having each one log to its own file. This will force us to review multiple files to trace one request that might have spanned many touch points in our distributed application. For this reason, we employ the services of an aggregator, which will give our services a central area to deposit logs and give us and our team one area to focus on when sifting through logs.
Then, we ran into another issue where our logs need to contain certain details that allow us to properly associate them with a request. After, we looked at enriching our logs with unique IDs that help us to associate them to a point of origin and each other. This is called distributed tracing. We also reviewed how to include OpenTelemetry in our service and the use of a visualization tool to assist with the querying activities.
Now we have finished exploring logging activities and best practices in a distributed system, in the next chapter, we will conclude what we have learned so far.