In this chapter, you will learn how to monitor Azure Virtual Desktop by using the Azure Monitor native tool and see all the different components you can monitor. Additionally, you will see some recommendations for how to use Azure Advisor for Azure Virtual Desktop (AVD).
You can customize Azure Monitor workbooks for Azure Virtual Desktop monitoring and create dashboards with the customized view required for your monitoring team.
Let’s get started with Azure Monitor for Azure Virtual Desktop.
Monitor Azure Virtual Desktop by Using Azure Monitor
Azure Monitor is a full-stack monitoring service that provides a complete set of features to monitor your Azure resources, including Azure Virtual Desktop. You don’t need to directly interact with Azure Monitor, though, to perform a variety of monitoring tasks, because its features are integrated with the Azure portal for the Azure services that it monitors.
When you have critical applications and business processes that rely on Azure resources, it’s important to monitor those resources for their availability, performance, and operation. Azure Virtual Desktop is an application used by multiple end users, so you must monitor and set up alerts for Azure Virtual Desktop.
Some services in Azure display customized monitoring experiences in Azure Monitor. These experiences are called insights , and they include prebuilt workbooks and other specialized features for that service. Azure Virtual Desktop also provides a customized experience with insights, and you can customize them per your requirements.
Session host virtual machines
Host pool diagnostic logs.
Let’s see why the session host monitor is important and what you can monitor.
Monitoring Virtual Machine Data
- 1.
Log in to the Azure portal and go to the session host on which you want to enable insights.
- 2.
Click Insights on the left and then the Enable button. See Figure 11-1.

Azure virtual machine insights
Once you enable the Insights option, then you will be able to see the performance, map, and health of the VM on the Insights page.

Azure virtual machine insights, Performance tab

Azure virtual machine insights, Map tab

Azure virtual machine insights, Overview
Analyze Logs
Data in the Azure Monitor logs is stored in a Log Analytics workspace, where it’s separated into tables, each with its own set of unique properties.
VM insights store the collected data in logs, and the insights provide performance and map views that you can use to interactively analyze the data. You can work directly with this data to drill down further or perform custom analyses. To analyze other log data that you collect from your virtual machines, use the log queries in Log Analytics. Several built-in queries for virtual machines are available to use, or you can create your own. You can interactively work with the results of these queries, include them in a workbook to make them available to other users, or generate alerts based on their results.
Alerts
Azure Monitor alerts proactively notify you when important conditions/issues are found in your monitoring data. These alerts can help you identify and address issues in your system before your customers notice them or have a big outage. You can set alerts on metrics, logs, and the activity log.
Create Alerts from the Azure Portal
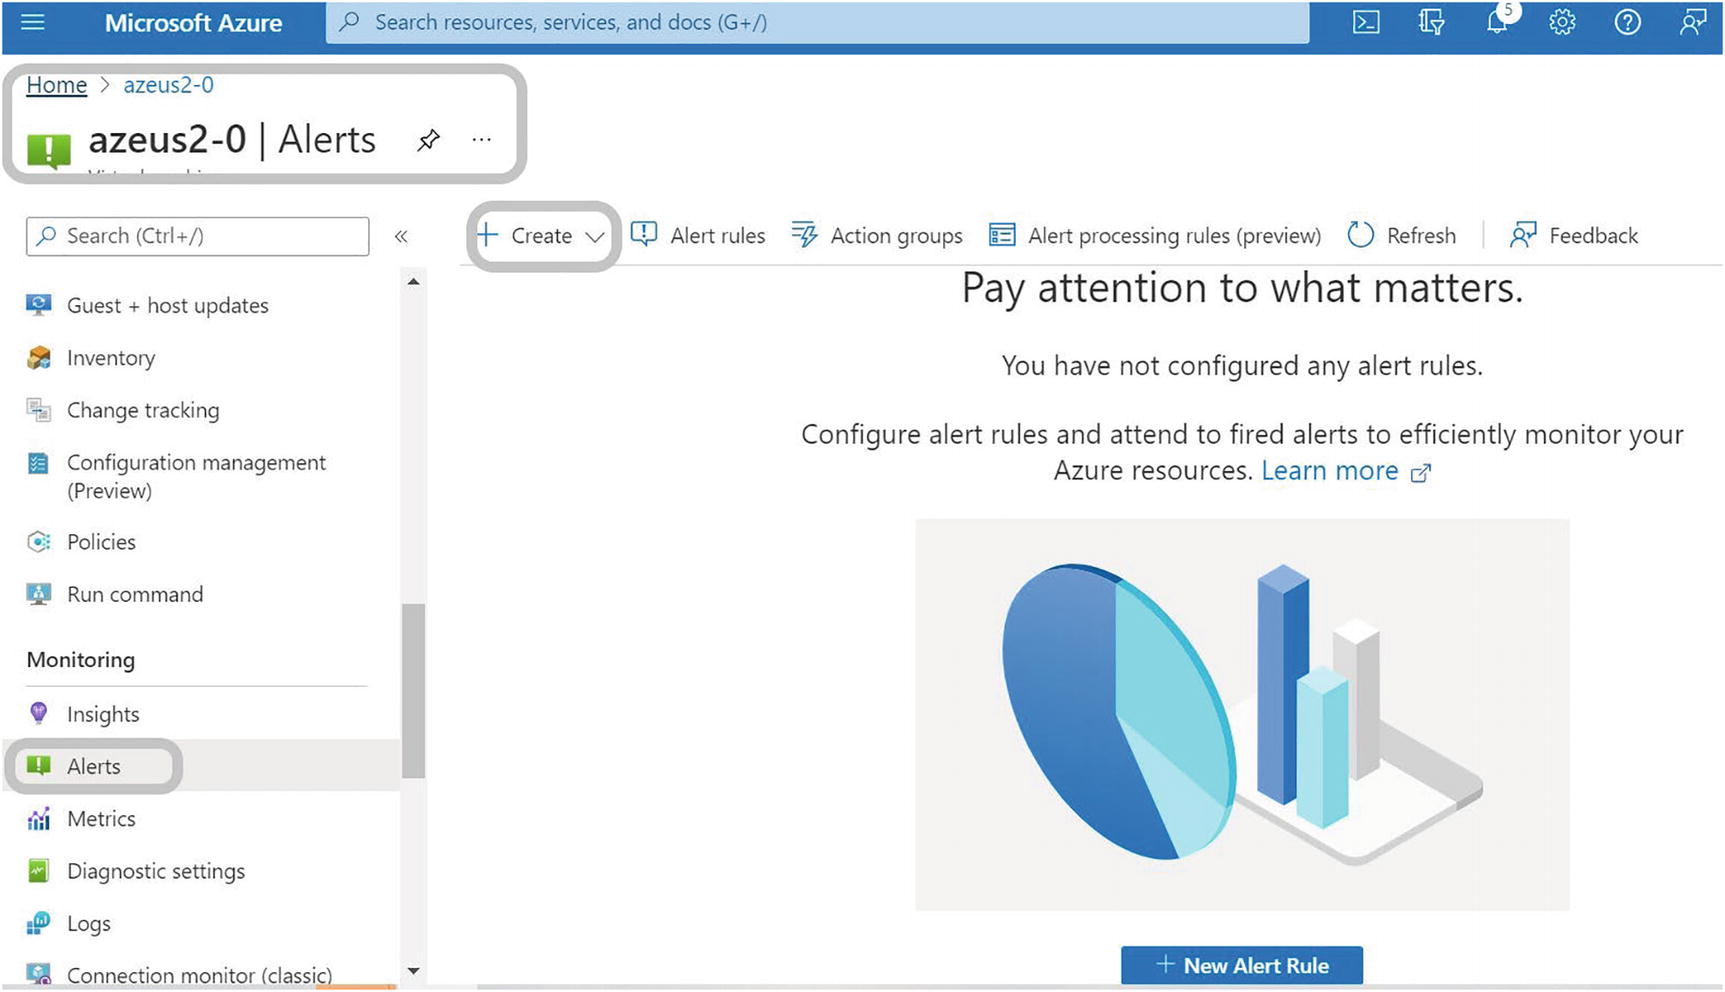
- 1.
Log in to the Azure portal, and go to the session host on which you want to create the alert. Alternately, you can create an alert from Azure Monitor that consolidates all your monitoring settings and data in one view.
- 2.
Click Alerts, expand the “+ Create menu” item, and select “Alert rule.” See Figure 11-5.
Azure Monitor, adding an alert
- 3.
On the next page you will add the scope, condition, and actions. See Figure 11-6.

Azure Monitor, Add Alert page
The alert scope, condition, and action are part of alert creation page, so let’s see what exactly each represent.

Azure Monitor, Scope option

Azure Monitor, Condition option
The displayed dimension values are based on metric data from the previous day.
If the dimension value you’re looking for isn’t displayed, click “Add custom value” to add a custom dimension value.
You can also choose “Select all current and future values” for any of the dimensions. This will dynamically scale the selection to all current and future values for the dimension.
The metric alert rule will evaluate the condition for all combinations of values selected.
If you are using a Static threshold, continue to define a Threshold value. The metric chart can help determine what might be a reasonable threshold.
If you are using a Dynamic threshold, continue to define the Threshold sensitivity. The metric chart will display the calculated thresholds based on recent data.

Azure Monitor, action groups
- 1.
Once you add the scope, condition, and action, then you can proceed further with the Tags tab, where you can set tags on the alert rule you’re creating.
- 2.
Proceed to the “Review + create” tab, where you can review your selections before creating the alert rule. A quick automatic validation will also be performed, notifying you in case any information is missing or needs to be corrected. Once you’re ready to create the alert rule, click Create.
Azure Monitor for Azure Virtual Desktop

Azure Virtual Desktop, insights
Go to aka.ms/azmonwvdi.
Search for and select Azure Virtual Desktop from the Azure portal; then select Insights.
Search for and select Azure Monitor from the Azure portal. Select Insights Hub under Insights; then select Azure Virtual Desktop. Once you have the page open, enter the subscription, resource group, host pool, and time range of the environment you want to monitor.
Log Analytics Settings for AVD
To start using Azure Monitor for Azure Virtual Desktop, you'll need at least one Log Analytics workspace. Use a designated Log Analytics workspace for your Azure Virtual Desktop session hosts to ensure that performance counters and events are only collected from session hosts in your Azure Virtual Desktop deployment. If you already have a workspace set up, skip ahead to “Set Up the Configuration Workbook.”
Set Up the Configuration Workbook
- 1.
Open Azure Monitor for Azure Virtual Desktop in the Azure portal at aka.ms/azmonwvdi, and select configuration workbook.
- 2.
Select an environment to configure under Subscription, Resource Group, and Host Pool.

Azure Virtual Desktop, Configuration Workbook
Resource Diagnostic Settings
To collect information on your Azure Virtual Desktop infrastructure, you’ll need to enable several diagnostic settings on your Azure Virtual Desktop host pools and workspaces (this is your Azure Virtual Desktop workspace, not your Log Analytics workspace).
- 1.
Select the “Resource diagnostic settings” tab in the configuration workbook.
- 2.
Select the Log Analytics workspace to send Azure Virtual Desktop diagnostics.
Host Pool Diagnostic Settings
- 1.Under “Host pool,” check to see whether Azure Virtual Desktop diagnostics are enabled. If they aren’t, an error message will appear that says, “No existing diagnostic configuration was found for the selected host pool.” You’ll need to enable the following supported diagnostic tables:
Checkpoint
Error
Management
Connection
HostRegistration
AgentHealthStatus
- 2.Select “Configure host pool.” See Figure 11-12.
 Figure 11-12
Azure Virtual Desktop, hostpool diagnostic setting
- 3.
Select Deploy.
- 4.Refresh the configuration workbook. See Figure 11-13.
 Figure 11-13
Azure Virtual Desktop, hostpool diagnostic setting deployment
Workspace Diagnostic Settings
- 1.Under Workspace, check to see whether Azure Virtual Desktop diagnostics are enabled for the Azure Virtual Desktop workspace. If they aren’t, an error message will appear that says “No existing diagnostic configuration was found for the selected workspace.” You’ll need to enable the following supported diagnostics tables:
Checkpoint
Error
Management
Feed
- 2.
Select “Configure workspace.”
- 3.
Select Deploy.
- 4.
Refresh the configuration workbook. See Figure 11-14.

Azure Virtual Desktop, workspace diagnostic setting
Session Host Data Settings
To collect information on your Azure Virtual Desktop session hosts, you’ll need to install the Log Analytics agent on all session hosts in the host pool, make sure the session hosts are sending to a Log Analytics workspace, and configure your Log Analytics agent settings to collect performance data and Windows Event Logs.
The Log Analytics workspace you send session host data to doesn’t have to be the same one you send diagnostic data to. If you have Azure session hosts outside of your Azure Virtual Desktop environment, we recommend having a designated Log Analytics workspace for the Azure Virtual Desktop session hosts.
- 1.
Select the session host data settings tab in the configuration workbook.
- 2.
Select the Log Analytics workspace you want to send session host data to.
Session Hosts
You’ll need to install the Log Analytics agent on all session hosts in the host pool and send data from those hosts to your selected Log Analytics workspace. If Log Analytics isn’t configured for all the session hosts in the host pool, you’ll see a “Session hosts” section at the top of the session host data settings with the message “Some hosts in the host pool are not sending data to the selected Log Analytics workspace.”
- 1.
Select “Add hosts to workspace.”
- 2.
Refresh the configuration workbook.
Optional: Configure Alerts
Azure Monitor for Azure Virtual Desktop allows you to monitor Azure Monitor alerts happening within your selected subscription, in the context of your Azure Virtual Desktop data. Azure Monitor alerts are an optional feature of your Azure subscriptions, and you need to set them up separately from Azure Monitor for Azure Virtual Desktop. You can use the Azure Monitor alerts framework to set custom alerts on Azure Virtual Desktop events, diagnostics, and resources.
Monitor Azure Virtual Desktop by Using Azure Advisor
Here’s how to use Azure Advisor.
Use Azure Advisor with Azure Virtual Desktop
Azure Advisor can help users resolve common issues on their own, without having to file support cases. The recommendations reduce the need to submit help requests, saving you time and costs.
Let’s see how to set up Azure Advisor in your Azure Virtual Desktop deployment to help your users.
What Is Azure Advisor?
Azure Advisor analyzes your configurations and telemetry to offer personalized recommendations to solve common problems. With these recommendations, you can optimize your Azure resources for reliability, security, operational excellence, performance, and cost.
How to Start Using Azure Advisor

Azure Virtual Desktop, Advisor
Cost
Security
Reliability
Operational Excellence
Performance

Azure Virtual Desktop, Advisor overview

Azure Virtual Desktop, Advisor recommendation
Additional Tips for Azure Advisor
Make sure to check your recommendations frequently, at least more than once a week. Azure Advisor updates its active recommendations multiple times per day. Checking for new recommendations can prevent larger issues by helping you spot and solve smaller ones.
Always try to solve the issues with the highest priority level in Azure Advisor. High-priority issues are marked with red. Leaving high-priority recommendations unresolved can lead to problems down the line.
If a recommendation seems less important, you can dismiss it or postpone it. To dismiss or postpone a recommendation, go to the Action column, and change the item’s state.
Don’t dismiss recommendations until you know why they’re appearing and are sure it won’t have a negative impact on you or your users. Always select “Learn more” to see what the issue is. If you resolve an issue by following the instructions in Azure Advisor, it will automatically disappear from the list. You’re better off resolving issues than postponing them repeatedly.
Whenever you come across an issue in Azure Virtual Desktop, always check Azure Advisor first. Azure Advisor will give you directions for how to solve the problem, or at least point you toward a resource that can help.
Summary
In this chapter, you learned about monitoring Azure Virtual Desktop resources such as the session host, host pool, and workspace. You also learned about setting up alerts for different resources with different conditions.
You checked how to use Azure Advisor and how it can help you to improve your AVD environment by providing recommendations.
Now you know everything about Azure Virtual Desktop, so you are good to design and set up the AVD environment and optimize it based on your requirements. If you are preparing for AZ-140, then good luck for the exam, and if you want to implement the AVD service in production, then I recommend you set up a lab to test Azure Virtual Desktop and verify all the options. Microsoft always keeps updating the cloud services, so check the recent changes in the service and test them before you implement them in production.