
Managing projects is much more about communicating with people than tweaking Gantt Charts. Project planning is a collaborative effort between you, the stakeholders, and the rest of the project team. For the duration of the project, people communicate continuously as they complete work, identify and resolve problems, and report status.
As you’ve already seen, Microsoft Project isn’t the only program you need for managing projects, especially when it comes to communicating aspects of your projects: Word documents, Excel spreadsheets, PowerPoint presentations, and other types of files often have better tools. For example, tracking issues and risks is easier in a spreadsheet or a database. PowerPoint is ideal for presenting different views of project information at a status meeting.
Information flows in both directions—from other programs to Project and vice versa. For example, after you hammer out costs and estimates in Excel, you can bring them into your Project schedule. Similarly, looking at change request documents or earned value graphs from within Project can save the time it takes to open other files in other programs.
In this chapter, you’ll learn how to copy and paste data and pictures between files—the most straightforward way to exchange information. For example, you can copy task names as text from a Project Gantt Chart table into an Excel spreadsheet, or vice versa.
Exporting and importing information from one program to another is yet another way to exchange data. For instance, in Chapter 4, you learned how to import a WBS from a Word document into a Project file. This chapter explains the basics of importing and exporting, no matter which programs you use to create and receive the data.
Project 2010 offers a new way to exchange Project information with your team, although it’s helpful only for small and informal projects, as you’ll learn on Publishing Project tasks to SharePoint. You can synchronize tasks in a Project file with a SharePoint Tasks list and vice versa (without using Project Server). That way, you can share task information with your team and update your schedule with the progress they report.
Copying and pasting moves small amounts of data quickly and easily. Copying and pasting is the way to go for reusing boilerplate text in a new proposal, copying a picture into a report, or borrowing from a colleague’s invincible resume. You can copy task data from a Project table, and then paste it into Word to create an agenda for a team meeting. Copying numbers from an Excel column into Project table cells works equally well.
Copying data from Project tables to another program is blissfully easy; it’s like a simple form of exporting. You select the table cells you want in Project, and then paste them into the destination file. Copying and pasting between Project 2010 and other Office 2010 programs brings formatting along with your data, which makes your job easier. For example, if you copy task data from Project to an Outlook email message to show task status, the tasks appear in the email message in a table with the same indenting, highlighting, grouping, and other formatting as the Project table, as shown in Figure 20-1.
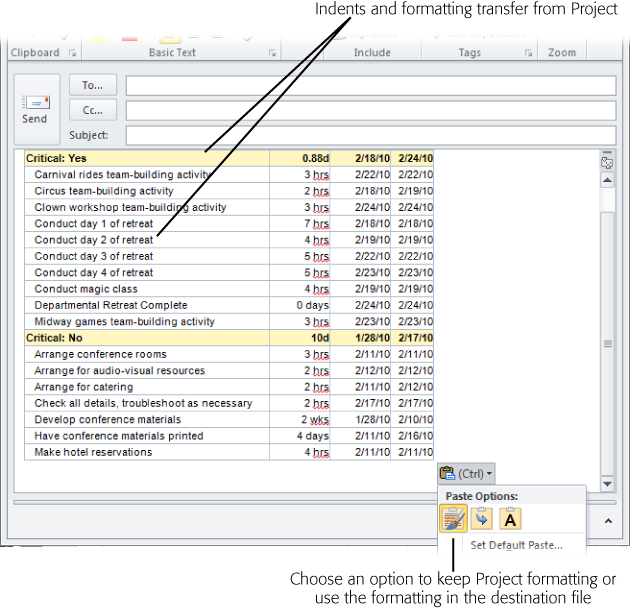
Figure 20-1. Office 2010 programs can retain formatting from the source file (Project, say) or apply the formatting present in the destination file. In addition, if you paste content from a Word document or Outlook email message, Project 2010 can transform indents into outline levels in Project, so lines of text automatically turn into summary tasks and subtasks.
Here are the steps for copying data from a Project table, using Excel as an example destination program:
In Project, display the view and table that contains the fields you want to copy.
To copy tasks and their costs to an Excel spreadsheet (or other table-oriented file), display the Gantt Chart view. Then choose View→Data→Tables→Cost to display columns of cost-related fields. (You can also apply a table by right-clicking the Select All cell above the ID column and then, from the drop-down list, choosing the table.)
In the table, select the data you want to copy.
You can select specific cells or entire columns. If the cells are adjacent, drag from the upper-left cell to the bottom-right cell. To select nonadjacent cells, for instance when you don’t want all the columns in the table, Ctrl-drag over each set of cells (hold the Ctrl key down as you drag over nonadjacent sets of cells). Select entire columns by dragging across the column headings.
Press Ctrl+C or choose Task→Clipboard→Copy to copy the selected cells to the Clipboard.
If you click the Copy down arrow, you can choose Copy to copy data, or Copy Picture to copy an image of the selection.
In the destination spreadsheet, click the top-left cell of the destination cells.
The cell you click is the starting point for the data you copy. The data copies from there into cells to the right and below. Even data that’s nonadjacent in Project pours into adjacent cells in the destination file.
To paste data in Excel 2010, press Ctrl+V or choose Home→Clipboard→Paste.
The data copies into the destination cells. With Office 2010, column headers paste into Excel, even if you don’t select them in the Project table.
Copying data into Project requires more finesse because Project is fussy about the type of data that goes into its fields. For example, if you try to copy plain numbers into a Start date cell, Project complains about the mismatch in an error message. To copy data into Project without that kind of drama, take the time to match up the data. For example, you may have to rearrange columns so they’re the same in both files. Where you rearrange columns doesn’t matter; you can rearrange the columns in the Project table or in the external file. Perhaps the simplest approach is to copy each column individually into its Project cousin.
Copying data between Project files works the same way, as the box on Copying Data Between Project Files explains. Otherwise, copying to Project is the same as copying from it:
In the source program (Word, for example), open the file, and then select the data you want to copy.
You can copy data from a Word document, an Excel spreadsheet, or a table in an Access database. If necessary, rearrange the columns of data to match the columns in the destination Project table.
Press Ctrl+C or choose Home→Clipboard→Copy.
Ctrl+C works whether you use Excel 2003, 2007, or 2010.
In Project, open the Project file, and then apply the view and table you want.
If you didn’t rearrange the data before you copied it to the Clipboard, then you can insert, hide, or drag columns in the Project table (Changing Table Contents) to match the source file’s column order.
In the Project table area, click the top-left cell where you want to paste the data, and then press Ctrl+V or choose Task→Clipboard→Paste.
Pasting data into a Project table doesn’t insert new blank rows, so the values you paste overwrite values in the Project cells, starting from the cell you click to the right and down. If you don’t want to overwrite data, then insert enough blank rows to hold the data you’re pasting—or paste the data in blank rows at the bottom of the table.
If the data from the source file doesn’t match the data type in Project, then you see an error message like the one shown in Figure 20-2.

Figure 20-2. Project displays an error message for every cell with the wrong type of data. The fastest way to resolve the problem is to click Cancel to stop the paste. Correct the mismatch by rearranging either the Project columns or the columns in your source file. Then repeat the copy and paste.
Tip
Project is happy as long as you paste data into a field with the correct data type. For example, you can paste any kind of text into a text-based field like Task Name. However, values you paste into Start cells had better be dates if tasks are auto-scheduled. You can also paste data into custom fields, as long as the data types match. For example, values you copy into a custom Project field like Duration1 must be a length of time like 2d.
From the time you initiate a project until you put the last tasks to bed, you communicate project information to stakeholders and team members. A picture of a project schedule shows where a project stands better than row after row of data. The Copy Picture command captures all or part of the current view and can create an image fine-tuned for displaying on a computer screen, printing, or publishing on the web. For example, you can create an image of the high-level schedule to publish on your Intranet or a Resource Graph to email to a functional manager (that is, the resources’ manager outside the project). After you create the image, you can paste it into any destination you want.
To create a picture of a view, follow these steps:
Display the view you want to take a picture of.
If you want to see specific rows in the view, then select them before you start the Copy Picture command. Adjust the timescale to show the date range you want in the picture. Partially hidden columns in the view don’t appear in the picture; make sure the last column you want in the picture is displayed completely in the view.
Choose Task→Clipboard. Click the Copy down arrow, and then choose Copy Picture.
The Copy Picture dialog box opens, as shown in Figure 20-3.
In the “Render image” section, choose the option for how you’re going to use the picture.
Project automatically selects “For screen”, which is perfect for a picture you’re copying into a program like Excel. Select “For printer” if you’re creating an image for a report most people will read on paper.
Figure 20-3. The options you can select depend on the view that’s displayed. For example, for Gantt Charts and usage views, you can specify the rows and timescale to include. The Resource Graph doesn’t have rows, so the row options are grayed out. The Network Diagram disables the options for rows and timescale.
“For screen” and “For printer” both create an image and place it on the Clipboard. To create an image file, select “To GIF image file”, and then enter the path and filename. (Click Browse to navigate to the folder in which you want to save the file.) For example, a GIF file format is what you need for publishing a picture on a web page.
Choose the option for the rows you want to include.
If you haven’t selected rows in the table, Project automatically selects the “Rows on screen” option, which includes only the visible rows. If you want specific rows or all rows in the project, be sure to select those rows before you start the Copy Picture command. In that case, Project automatically selects the “Selected rows” option.
Choose the option to show the timescale that’s visible in the view or a date range you specify.
“As shown on screen” includes only the dates visible on the screen. To show dates from project start to finish or custom dates, select the From option, and then fill in the From and To boxes with the start and finish dates.
Click OK.
Project copies the picture to the Clipboard if you selected the “For screen” or “For printer” option. Project creates the file for the “To GIF image file” option.
In the destination file, click the location where you want to paste the picture, and then press Ctrl+V or choose Home→Clipboard→Paste.
For a GIF file, use the destination program’s command for inserting a picture. For example, with Microsoft programs, choose either Insert→Picture or Insert→Object.

Arranging columns in the right order, selecting data, and copying it to the right place can be tedious and error-prone. A more dependable way to get data from one place to another is importing or exporting, depending on which direction the data is headed. In this book, importing means pulling data into Project from another program, for instance importing data from an Excel spreadsheet or an Access database. Exporting pushes data out of your Project file to another file format like Excel or XML. Unlike linking and embedding (Saving a Project File to a SharePoint Site), importing and exporting convert data from one file format to another, so the data is the same as what you enter directly in the destination program.

Figure 20-4. Drag a picture to reposition it. To resize a picture, select it, and then drag one of the resize handles at the corners or on the sides. You can’t edit pictures or open their source files.
The great thing about importing and exporting is the control you have over the data you transfer and where it goes. Because you map fields in one program to fields in the other, you can make sure the right types of data go where you want.
Project provides wizards for importing and exporting data to and from your Project files. The wizards (as the box on File Formats for Importing and Exporting explains) start automatically when you open a file in another format or save to another format. For example, if you open an Excel spreadsheet in Project, then the Import Wizard starts up. Saving a Project file as a text file launches the Export Wizard.
Maps are sets of settings that match up Project fields with fields or columns in the other program. Project comes with several built-in maps, for example to export cost data, earned value, or basic task information. Because Excel is second only to Project as a project management tool, Excel comes with special templates for transferring data to and from Project. For example, one template places all the information about tasks, resources, and assignments on separate worksheets within an Excel spreadsheet. Visio has special features for exchanging data with Project, as you’ll learn on Working with Project and Visio.
Bringing data from other programs into Project is as easy as opening that file in Project. The Import Wizard guides you through mapping the data to the right Project fields, and takes care of transferring the data. Although Project includes a few special tools for importing Excel data, the basic steps for importing any kind of data are the same:
In Project, choose File→Open.
The Open dialog box automatically sets the “Files of type” box to Microsoft Project Files, so you have to tell Project which type of file you want to import.
In the Microsoft Project Files box, click the down arrow, and then choose the file format you want to import, for instance Microsoft Access Databases, Excel Workbook, or “CSV (Comma delimited)”.
As you navigate to the folder that contains the file to import, the list shows only the files of the type you selected. So if the file you want is conspicuously absent, it might be a different format than you think.
In the file list, double-click the name of the file (or click the filename, and then click Open).
The Import Wizard starts. Click Next to bypass the welcome screen, which does nothing but explain the process.
On the Import Wizard—Map page, keep the “New map” option selected. Click Next.
If an existing map (either a Project built-in map or one you’ve saved) matches fields the way you want, then select “Use existing map”. This option shortens the import process by several steps, as explained on Using an Existing Map.
On the Import Wizard—Import Mode page, select an option to tell Project where you want to import the data. Click Next.
Project automatically selects the “As a new project” option, which creates a brand new Project file from the data you’re importing. The “Append the data to the active project” option is ideal when you want to import several files into the same project, for instance when you receive WBSs from several team leaders. Appended data appears in the current Project table after the existing rows.
Selecting the “Merge the data into the active project” option is perfect when you want to import values into existing tasks, like importing estimates into your Project file (Importing Estimates into Project). To import values into existing tasks, Project needs a way to match the tasks in each file, as the box on Importing Data into Existing Rows explains.
On the Import Wizard—Map Options page, select the types of data you want to import, as shown in Figure 20-5. Click Next.
First, you have to specify the type of data you want to import: tasks, resources, or assignments. The Tasks and Resources options import data specifically for tasks or resources. Selecting the Assignments option imports information about tasks, and who’s assigned to them. (When you exchange data with an Excel spreadsheet, these options turn into checkboxes so you can exchange more than one type of data at a time, as you’ll learn on Exporting Project data to Excel.)
If the first line or row of the source file includes column names, make sure the “Import includes headers” checkbox is turned on. The “Include Assignment rows in output” checkbox stubbornly remains grayed out no matter what you do, because this checkbox only applies to exporting.
On the mapping page, map the import fields to their corresponding Project fields, as shown in Figure 20-6.
The mapping page that appears depends on the data you selected to import: Task Mapping, Resource Mapping, or Assignments Mapping page.
Figure 20-5. Project automatically sets the other options on the Import Wizard—Map Options screen depending on the type of file you’re importing. For example, importing a text file sets the “Text delimiter” checkbox to a comma, and “File origin” to Windows (ANSI). You can specify a comma, a tab, or a space as the delimiter.
Figure 20-6. You don’t have to import every field in an import file. Beneath the field table, click Delete Row to remove a mapping pair. Click Clear All to delete all the rows and start from scratch. Add All reads the import file and inserts rows for each import file field. Insert Row inserts a blank row.
The “From: <source> Field” column (where <source> is Text File if you’re importing a text file, Excel if you’re importing from Excel, and so on) displays column headings from your import file, if they’re present. Otherwise, the first cell in the From: Text File Field column displays the number 1.
For each field you want to import, choose the corresponding Project field in the To: Microsoft Project Field cell. Project makes educated guesses about mappings based on the imported column heading name. For example, Project maps a Name field in the import file to the Name field in Project.
The value “(not mapped)” in the To: Microsoft Project Field cell is Project’s way of saying that you need to tell it which Project field you want. To choose a field, click the down arrow in the To: Microsoft Project Field cell, and then choose the field. Leaving the value as “(not mapped)” is how you tell Project not to import the field.
The Preview area shows a sample of the import. The first row in the preview shows the names of the selected source fields. The Project row identifies the fields into which the imported data goes. And the Preview rows show several values from that field in the import file, for example, Identifying Requirements as one task name.
Optionally, to save the map you’ve defined, click Next.
The Import Wizard—End of Map Definition page appears with the Save Map button sitting by itself mid–dialog box. Click Save Map to open the Save Map dialog box. In the “Map name” box, type a short but meaningful name for the map, like Import WBS Tasks. Clicking Save adds the map to your global template and closes the dialog box.
Click Finish.
You may see a warning message if you’re importing an older file format. Click Yes to continue opening the file. Project imports the tasks into your Project file.


Most often, you export data from Project so you can work with the data in ways that Project doesn’t handle well. For example, financial analysis is Excel’s strong suit, not Project’s. Exporting data is also useful when colleagues don’t have Project, or just want to see the data in another format.
The steps in the Export Wizard bear a strong resemblance to those in the Import Wizard, but there are a few key differences. Here’s how you export Project data to another format:
Open the Project file you want to export and choose File→Save As.
The Save As dialog box opens.
In the “Save as type” drop-down list, choose the file format you want to use.
If you save to one of the Project file formats (Project, Microsoft Project 2007, Microsoft Project 2000-2003, Project Template, or Microsoft Project 2007 Templates), Project opens the Save As dialog box, not the Export Wizard. However, saving to an Excel workbook, a text file, a comma-delimited file, or the XML format all start the Export Wizard.
In the “File name” box, type the name for the file and click Save.
Project fills in the “File name” box with the Project file’s name, but you can rename the export file to whatever you want. Project sets the file extension based on the file format you choose. If you choose an older file format, such as Excel 97-2003 Workbook or CSV (Comma delimited), when you click Save, a message box tells you that the older file format may be less secure than a new file format. If you want to save the file to that format, simply click Yes. To quit, click No, and then repeat steps 1 and 2 to choose a different format.
Project starts the Export Wizard. Click Next to bypass the welcome screen.
On the Export Wizard—Map page, select the “New map” option and click Next.
To use an existing map to match up fields (Using an Existing Map), select the “Use existing map” option.
On the Export Wizard—Map Options page, select the types of data you want to import. Click Next.
Your choices are the same as the ones on the Import Wizard—Map Options page, with one exception; the “Include Assignment rows in output” checkbox is now active but turned off. If you want to export all the assignment rows for tasks, then turn on this checkbox.
On the mapping page, specify the fields you want to export.
You see the mapping page (Map Tasks Data, Map Resources Data, or Map Assignments Data) corresponding to the type of data you’re exporting. The Export Wizard mapping pages have a few additional options, as you can see in Figure 20-7.
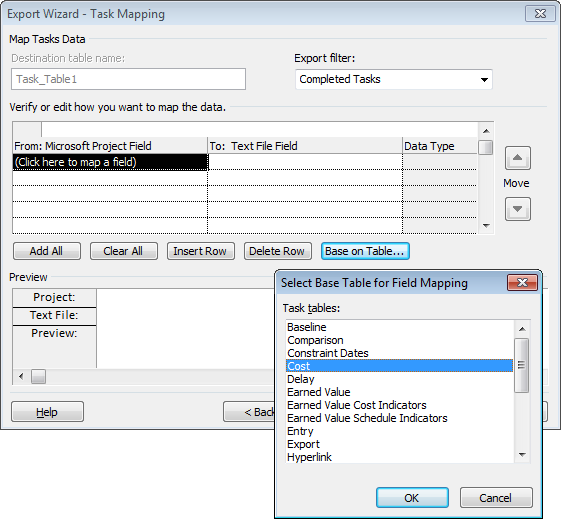
Figure 20-7. The “Export filter” box lets you choose the items you want to export. For example, you might choose the Completed Tasks filter to export the final costs for tasks that are done. Click “Base on Table” below the mapping grid to jump-start field mappings with a Project table.
Because you’re exporting to a blank file, Project doesn’t fill in the field table for you. Instead of selecting field after field, you can use a Project table like Entry, Cost, or a custom table you create to fill in the field cells. Underneath the field table, click Base on Table. The Select Base Table for Field Mapping dialog box opens, and you can select any table in your project. The granddaddy of all tables is the Export table, which fills in a whopping 83 fields. (If you’re exporting tasks, the dialog box displays all the task tables; it lists resource tables if you’re exporting resources.) Remember, you can edit the field names in the To: column to specify the headings you want in the export file.
Tip
To export exactly the fields you want, use the Add All, Clear All, Insert Row, and Delete Row buttons to build a collection of fields.
The Preview area shows values in your Project by field. The Project and <destination> field names (where <destination> is the destination file format you choose) are initially identical. To define the field names in your export file to match the needs of a destination program, change the field name in the To: <destination> Field cells.
Optionally, to save the map you’ve defined, click Next.
The Export Wizard—End of Map Definition page presents the Save Map button, which saves a map exactly like the Import Wizard does.
Click Finish.
Project exports the data to the file format you selected, but it doesn’t open the file for you.
If clicking Finish displays a message about trying to save a file in an older file format, then Project isn’t playing nicely with older Microsoft file formats (as well as other file formats that Project doesn’t recognize initially). To correct these poor manners, choose File→Options. In the Project Options dialog box, choose Trust Center, and then click Trust Center Settings. Choose Legacy Formats, select the “Allow loading files with legacy or non default file formats” option, and then click OK.
There’s no reason to map the same fields every time you import or export them, for things like monthly reports you produce. Saving a map and reusing it in future imports and exports is a real timesaver. Bear in mind, using an existing map doesn’t bypass any of the pages in the Import or Export Wizard, but you don’t have to match fields on the mapping page. Moreover, after you apply an existing map, you can tweak the mapping if it isn’t quite right.
Here’s how to use an existing map:
When you start either the Import or Export Wizard, follow the steps until you get to the Import Wizard—Map page or the Export Wizard—Map page.
The wizard pages vary depending on what you’re importing or exporting.
On the Import Wizard—Map page or the Export Wizard—Map page, select the “Use existing map” option and then click Next.
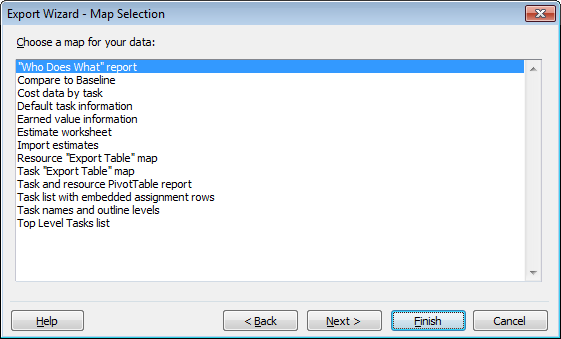
The Map Selection page appears, as shown in Figure 20-8.
Select the map you want and click Next.
If you want to review your settings or make minor adjustments to the map, clicking Next steps you through the remaining wizard pages as described in the previous sections on importing (Importing Data into Project) and exporting (Exporting Data from Project).
Because Excel spreadsheets can contain more than one worksheet, the settings in the Import and Export Wizards are slightly different from the ones you see when you work with text files. For example, you can import and export tasks, resources, and assignments all at once. Moreover, when you have both Project and Excel installed on your computer, Excel includes two templates to jump-start your data exchange. When you create an Excel file using either of these templates, the column headings are set up to map to Project fields. To export without a hitch, see Saving Projects to Other File Formats to learn how to make Project work with older file formats.
Tip
You can also exchange data between Project and Excel using visual reports. See Chapter 17 for the full scoop on visual reports.
When you want to export specific portions of your Project file to Excel, you can save the Project file as an Excel workbook and use the Export Wizard to specify what’s exported. The steps are similar to exporting to other types of files. Here’s how exporting to an Excel spreadsheet works:
Open the Project file you want to export to Excel.
Display the view that contains the data you want to export, for instance the Gantt Chart view for tasks, the Resource Sheet for resources, or Task Usage for assignments. You can also export specific rows by selecting them. To export all the data in the table, at the top of the ID column, click the Select All cell.
Choose File→Save As. In the “Save as type” drop-down list, choose Excel Workbook. In the “File name” box, type the name for the file, and then click Save.
Project launches the Export Wizard. Click Next to get going.
On the Export Wizard—Data page, the wizard automatically selects the Selected Data option, which exports the data you selected in the view. Click Next to continue.
The Project Excel Template option takes the reins and exports your entire file, as described on Exporting an entire project to Excel.
On the Export Wizard—Map page, select the “New map” option and click Next.
If you already have a map you want to use, select the “Use existing map” option, and then select the map as described on Using an Existing Map.
On the Export Wizard—Map Options page, turn on the checkboxes for each type of data you want to export and click Next.
Because Excel can handle several types of data on separate worksheets, this page includes checkboxes for Tasks, Resources, and Assignments, as you can see in Figure 20-9.
Figure 20-9. You can turn on any or all of the data checkboxes. Each type of data lands on its own Excel worksheet. If you selected an existing map, then the wizard initially sets the checkboxes to match the map definition. The wizard displays a mapping page for each type of data you export.
The wizard automatically turns on the “Export includes headers” checkbox. This setting exports Project field names to column names in Excel, which is usually what you want. If you want to export all the details about assignments, then turn on the “Include assignment rows in output” checkbox.
On the first mapping page that appears, in the “Destination worksheet name” box, type a name for the Excel worksheet.
The mapping page that appears depends on the checkboxes you selected on the Export Wizard—Map Options page. For example, if you turned on the Tasks checkbox, then the first Mapping page you see is Export Wizard—Task Mapping.
The “Destination worksheet name” box automatically sets the worksheet name to something like "Task_Table1.” You can stick with that or change the name to something else.
Set up the field mapping as you would for any other kind of export.
You can choose a filter to export specific parts of your Project file. The rest of the mapping page is the same as the one that appears for exporting to a text file or another format (Exporting Data from Project). For instance, you can map fields based on an existing Project table or use the buttons below the table to insert and delete rows.
Repeat steps 6 and 7 for each mapping page that appears.
The mapping pages appear in the same order every time: tasks, resources, and then assignments. However, if you aren’t exporting a type of data, that mapping page doesn’t show up. The wizard creates a separate worksheet in the Excel file for each type of data you export.
Click Finish.
Project exports the tasks into a new workbook, but you must start Excel and open the file to see it. After you open the spreadsheet in Excel and try to save it, you may see a message box asking if you want to overwrite the older Excel format (if you exported to Excel 97-2003 format, for example) with the current format. If you click Yes to update the format, Excel saves the spreadsheet to the version of Excel installed on your computer.

Tip
The cells in an Excel export file are set to the General format, which doesn’t apply any specific formatting to the values. To display data the way you want or to calculate values, you can change the data types for cells. For example, you can modify cost cells to the Excel Currency format to show dollar signs. To change the data type in Excel, select the column heading. Choose Home→Cells→Format→Format Cells. Choose the category, such as Number or Currency, and then click OK.
The Export Wizard contains an option for exporting all the task, resource, and assignment data in a Project file with a minimum of effort. Although the resulting export file doesn’t include time-phased data, you can create an Excel spreadsheet with separate worksheets for tasks, resources, and assignments. Here are the steps:
Open the Project file you want to export to Excel, and then choose File→Save As. In the “Save as type” drop-down list, choose Excel Workbook. In the “File name” box, type the name for the file, and then click Save.
Project launches the Export Wizard. Click Next to start the wizard.
On the Export Wizard—Data page, select the Project Excel Template option, and click Finish.
That’s it. Project exports your project data to an Excel file that contains three worksheets: Task_Table, Resource_Table, and Assignment_Table.
Importing data from Excel without a built-in template is almost identical to importing any other kind of data (Importing Data into Project). In fact, you’ll find only two exceptions:
The Import Wizard—Map Options page has checkboxes for each type of data you want to import, because Excel can create separate worksheets for each type of data.
On the Mapping pages, Project fills in the Excel worksheet names in the “Source worksheet name” box. If the spreadsheet contains more than one worksheet for a type of data, then choose the name from the drop-down list.
Suppose you want team leaders and stakeholders to help you build the project task list. Or you want to collect information about tasks, resources, and assignments to load into your Project file. You can use the out-of-the-box importing steps, but Project offers an easier way. If you have both Project and Excel installed on your computer, Excel includes two templates whose worksheets and columns are tailored to work perfectly with Project’s Import Wizard:
The Microsoft Project Task List Import Template is an Excel template with columns for basic task fields. It contains a Task_Table worksheet with columns for ID, Name, Duration, Start, Deadline, Resource Names, and Notes.
The Microsoft Project Plan Import Export Template has four worksheets: Task_Table, Resource_Table, Assignment_Table, and Info_Table. The Task_ Table worksheet includes columns for ID, Duration, Start, Finish, Predecessors, Outline Level, and Notes. The Resource_Table worksheet mimics the field you see in the Project Resource Sheet. The Assignment_Table includes columns for Task Name, Resource, Name, % Work Complete, Work, and Units.
First, you create a new Excel file from either of the templates. Give the Excel files to others to fill out. When your colleagues send the filled-in files back, you import them into Project using the Import Wizard. Here are the steps from start to finish:
In Excel, choose File→New.
The Backstage view opens to the Available Templates page.
Click Sample Templates.
The Available Templates list appears.
Select either Microsoft Project Task List Import Template or Microsoft Project Plan Import Export Template, and then click Create.
The Task List template creates a new file called Tasklist1, which contains a worksheet with basic task columns. The Project Plan template creates a file called Projplan1 with four worksheets for tasks, resources, assignments, and information about the template.
The Info_Table worksheet merely explains what the template can do, not how to fill it in. Tell your team members that they don’t have to enter dates despite the presence of the Start and Finish columns. If tasks have critical finish dates, team members can enter them in the Deadlines column.
Choose File→Save. In the Save As dialog box, navigate to the folder where you want to save the file. In the “File name” box, type the file name; in the “Save as type” drop-down list, choose Excel Workbook. Then click Save.
Excel saves the file.
Distribute the file to team members, so they can open the file and enter data.
The first row in the file displays Project field names, so people know which columns contain which fields. They don’t have to fill in every cell. When team members finish entering data, they simply save the file and send it to you to import into Project.
Note
The Excel files based on these templates don’t apply specific formatting to the columns, so whoever fills in the files must enter the values correctly. For example, duration is a length of time like 5d or 3w. If the values aren’t valid, then the Project Import Wizard displays an error message (Copying Data from Other Programs into Project).
Now you’re ready to import the Excel file into Project. When you import data from an Excel template, the mapping between Excel columns and Project fields is already done. Follow the steps on Importing Data into Project to import the Excel data. When you get to the first mapping page, click Finish to import the data.
Most of the time, your work with Project and Visio revolves around visual reports, which send Project data to Visio pivot diagrams to dynamically display project information. (See Chapter 17 for more on Visio visual reports.) You can also turn to Visio to produce simpler pictures of your project, akin to the weather maps you see on television compared to the ones that meteorologists analyze. Project’s Timeline view (Customizing the Timeline) and Gantt Chart formatting options (Displaying Project data in a Visio Gantt Chart) go a long way toward creating presentation-quality graphics of your project. However, if you can’t get Project’s views to look the way you want, try Visio’s Schedule template category, which includes templates for Gantt Charts, timelines, PERT Charts, and calendars:
Gantt Chart. A Visio Gantt Chart can make task bars look more interesting, and weed out the details that executive audiences don’t want to see. Although most project managers build even the quickest and dirtiest schedules in Project, you can export any information created in Visio Gantt Charts to set up a Project schedule.
Timeline. Project 2010 stole Visio’s thunder by introducing its own timeline view. Now you can produce high-level project views of tasks and milestones along a horizontal bar in Project or Visio. However, if you want to produce a vertical timeline of your project, your only choice is Visio’s Timeline template.
Tip
Although Visio includes a PERT Chart template, you’re better off using the Project Network Diagram view to show PERT boxes. That way, the tasks are available for other views as well. The Visio PERT Chart template doesn’t import or export data automatically, so it’s difficult to display Project data with this type of drawing.
Because data exchange between Visio and Project takes place in Visio, this section switches the meaning of import and export from previous sections. In Visio, import means bringing Project data into a Visio drawing, whereas export means creating a Project file from Visio data.
Every shape on a Visio Gantt Chart or timeline drawing has its own sets of options, so you can make the drawing look just the way you want. To learn more about working with Visio schedule drawings, refer to the Visio 2007 Bible by Bonnie Biafore (Wiley).
A Project Gantt Chart can show a project summary, but it often contains too much information for most reports and presentations. Visio Gantt Charts are simpler renditions of their Project cousins, so they may be more suitable for audiences less versed in project management.
Project doesn’t include the tools for pushing its data to Visio. Importing Project data into a Visio Gantt Chart takes place within Visio. Here’s how to do it:
In Visio, open an existing Gantt Chart drawing or create a new one.
To create a Visio Gantt Chart, choose File→New→Schedule and then double-click Gantt Chart. In the Gantt Chart Options dialog box that appears, click OK to accept the settings as they are. You can modify them after you’ve imported your Project data.
Choose Gantt Chart→Manage→Import Data.
The Import Project Data Wizard starts. As a refreshing change, this wizard gets right to business with options on the very first page.
On the first page, select the “Information that’s already stored in a file” option, and then click Next.
Despite the wizard’s name, you can actually import data from Excel spreadsheets and text files, as well as Project .mpp and .mpx (an older exchange format) files.
On the “Select the format of your project data” page, leave Microsoft Project File selected, and then click Next.
To import from a different type of file, choose the format in the list.
On the “Select the file containing existing project schedule data” page, open the file you want to import, and then click Next.
On the page, click Browse. In the Import Project Data Wizard dialog box that appears, find and select the file you want to import, and then click Open. Back on the wizard page, you see the path and filename filled in.
On the timescale page, choose the major and minor timescale units, as well as the time units you use to enter duration. Click Next.
Less robust than the timescale units in Project, Visio timescale units are days, weeks, months, quarters, and years. The duration units come in several variations. For whole numbers, you can choose Weeks, Days, or Hours. To show fractional values, choose Days Hours, Weeks Days, or Weeks Hours.
Clicking the Advanced button opens a dialog box in which you can specify the shapes for the Gantt Chart. However, changing the shapes once the drawing is complete makes it easier to see whether the results are what you want.
On the “Select tasks to include” page, select the category of tasks you want to import, and then click Next.
Initially, All is selected, which brings in every task in your Project file. Typically, one of the other selections is more appropriate. “Top level tasks only” shows only the highest-level tasks. “Milestones only” shows milestones without any other tasks. “Summary tasks only” includes all levels of summary tasks so only the work package tasks are eliminated. “Top level tasks and milestones” is a great summary with the highest-level tasks and all milestones.
On the last page, review the import properties you’ve chosen and click Finish.
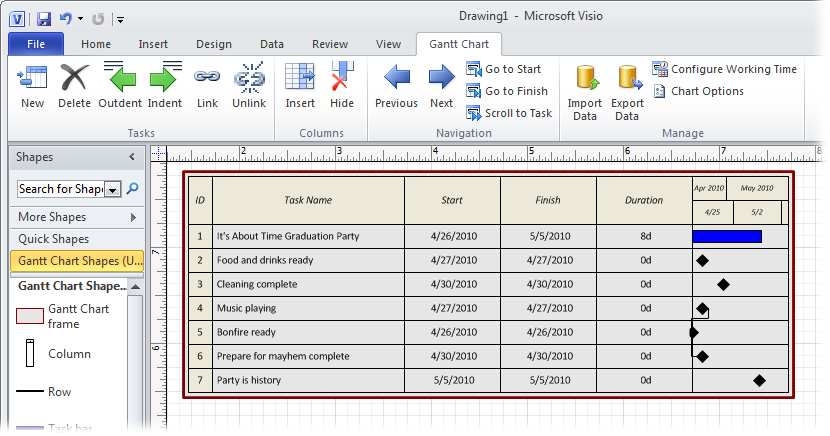
Visio creates a new Gantt Chart from the imported data, as shown in Figure 20-10. If you import into an existing drawing, Visio creates a new page and then adds the imported Gantt Chart to it.
To change any import settings, click Back until the appropriate page appears, and then make the changes you want.
Figure 20-10. Visio’s Gantt Chart tab helps you find task bars and dates. Click “Go to Start” or “Go to Finish” to move the timescale to the beginning or end of the project. Click Previous or Next to move to the previous or next time period. If you select a task, and then click the “Scroll to Task” icon, the timescale moves to display the task bar.
To change the appearance of the Visio Gantt Chart, choose Gantt Chart→Manage→Chart Options.
The Gantt Chart Options dialog box has the same options the wizard presents when you click the Advanced button. Change the timescale dates, the duration units, and timescale units. The Format tab lets you choose shapes for task bars, summary bars, and milestones, as well as what the bar labels show.
Timelines are a great way to show when important events occur and how long phases last. Now that Project can produce a timeline, you may not need to import project data into a Visio timeline drawing. However, Visio’s timeline tools simplify importing different types of tasks: all tasks in the project or just top-level tasks, summary tasks, and milestones. To import information from Microsoft Project into a Visio timeline, follow these steps:
Make sure the Project file you want to import isn’t open in Project.
The Import Timeline Wizard can’t read a file that’s already open.
In Visio, open an existing timeline drawing or create a new one.
To create a Visio Gantt Chart, choose File→New→Schedule and double-click Timeline. Visio creates a new drawing and adds the Timeline tab to the Visio ribbon.
Choose Timeline→Timeline→Import Data.
The Import Timeline Wizard starts.
If you don’t see Import Data on the Timeline menu, then Microsoft Project isn’t installed on your computer. Unlike the wizard for importing data to a Visio Gantt Chart, the Import Timeline Wizard works only with Project files.
On the “Select a Microsoft Project file to import” page, open the file you want to import and then click Next.
On the page, click Browse. In the Import Timeline Wizard dialog box that appears, find and select the file you want to import (it must be a Project .mpp file), and then click Open. Back on the wizard page, the path and filename appear in the box.
On the “Select task types to include” page, select the category of tasks you want to import, and then click Next.
Initially, All is selected, which brings in every task in your Project file. Typically, “Top level tasks and milestones” is best for a summary of the highest-level tasks and all milestones. “Top level tasks only” shows only the highest-level tasks. “Milestones only” shows milestones without any other tasks. “Summary tasks only” includes all levels of summary tasks so only the work package tasks are eliminated. Project tasks with 0 duration import as milestones.
On the “Select shapes for your Visio timeline” page, review the shapes for the timeline, and choose different shapes if you want. Click Next.
The timeline shape spans the dates for the full project schedule. Project summary tasks become Interval shapes in Visio, and Project milestones morph into Milestone shapes.
On the last page, review the import properties you’ve chosen, and then click Finish.
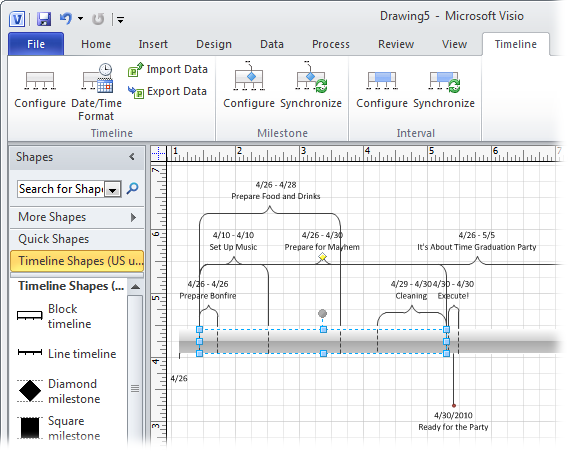
Visio creates a new timeline from the imported data, as shown in Figure 20-11. If you import into an existing drawing, then Visio creates a new page and then adds the imported timeline to it.
To change any aspect of the import, click Back until you reach the appropriate page, change the settings you want, and then click Finish.
To change the appearance of the Visio timeline, right-click the shape you want to change and choose one of the commands from the shortcut menu.
To change the time period for the timeline, right-click a timeline shape, and then choose Configure Timeline. You can also choose whether or not to show dates on the timeline. To modify milestones or intervals, right-click the shape and choose Configure Milestone or Configure Interval.
Changing the shape of an element is as simple as right-clicking it, and then, on the shortcut menu, choosing Set Timeline Type, Set Interval Type, or Set Milestone Type.
Suppose you used a Visio Gantt Chart to present a project proposal to the management team for their approval. The information in the Gantt Chart isn’t much, but you can export it to Project to jump-start your schedule. The tasks in a Visio Gantt Chart turn into tasks in Project with start dates, finish dates, and durations. Similarly, milestones in a Visio Gantt Chart become milestones in Project.
To export a Visio Gantt Chart to Project, follow these steps:
In Visio, open the Gantt Chart drawing you want to export and select the Gantt Chart frame.
Clicking within a Visio Gantt Chart selects individual task bars or task name text boxes, which are subshapes within the Gantt Chart frame. To select the frame, click the very edge of the Gantt Chart. You can tell you’ve succeeded when selection handles appear at the frame corners and the midpoints along each side.
Choose Gantt Chart→Manage→Export.
On the “Export my project data into the following format” page, select Microsoft Project File and click Next.
You can also export to Excel files, text files, and Project .mpx files (an older Microsoft exchange format). However, you might as well export directly to Project.
On the “Specify the file to enter project schedule data” page, click Browse and open the folder in which you want to save the exported project file.
The Export Project Data Wizard dialog box opens. Navigate on your computer or network to the folder you want. Although this page’s title sounds like you’re supposed to select (“specify”) a file, you actually create a new one. In this step, you simply select the folder in which you want to save the new file. (If you select an existing file, Project asks if you want to replace it.)
In the “File name” box, type the name for the new Project file and click Save.
The dialog box closes and returns to the wizard.
Click Next.
The last wizard screen shows that you’re exporting a Gantt Chart, and it specifies the file you’re creating.
Click Finish.
A message appears to tell you that the data exported. Click OK.
Open the file in Project.
You’re ready to build a real schedule starting with the data that you exported from the Visio Gantt Chart. For example, you still must create task dependencies between the tasks and assign resources.
You can also export Visio timeline data to Project. Intervals from a Visio timeline turn into tasks in Project with start dates, finish dates, and durations. Milestones in Visio become milestones in Project. The Visio timeline shape also turns into a task with start, finish, and duration.
To export a Visio timeline to Project, follow these steps:
In Visio, open the timeline file and select the timeline shape.
Select the timeline shape by clicking anywhere inside it.
Choose Timeline→Timeline→Export Data.
The Export Timeline Data dialog box opens. You can navigate on your computer or network to find the folder you want.
In the “File name” box, type a name for the new Project file and click Save.
The “Save as type” box is set to Microsoft Project File. When you click Save, a message tells you that the data exported successfully. Click OK.
Open the Project file you created in Project.
The timeline data turns into manually scheduled tasks in Project. After you create task dependencies between tasks in Project, you can switch these tasks to auto-scheduled (Switching the scheduling mode as you work) so Project can do its job.
Many small projects can get by without full-blown project scheduling. For a handful of tasks and a couple of resources, you can probably manually schedule your tasks without breaking a sweat. Even so, as a project manager, you still need to communicate with your team and vice versa. That’s where the new "Sync with Tasks List” feature in Project 2010 may be able to help. You can synchronize tasks in a Project 2010 file with a SharePoint 2010 Tasks list to easily exchange project tasks and status with your team. This section explains what you can do with Project and SharePoint, if you don’t use Project Server.
Note
If your organization requires enterprise project management (coordinating an entire stable of projects and sharing enterprise resources, for example), this simple synchronization feature won’t cut it. You need Project Server and SharePoint for those types of project management activities. In fact, when Project Professional is connected to Project Server, Sync with Tasks List is disabled.
Synchronizing tasks between a Project schedule and a SharePoint Tasks list can simplify communication with your project team. Start a task list in Project and publish it to a SharePoint Tasks list for all to see, or brainstorm with your team in SharePoint to create a list of tasks and pull the tasks into Project to build a schedule. Either way, the first step is to create the connection between your Project file and a SharePoint Tasks list. Then, you can push changes from your Project file to SharePoint to keep your team informed or pull the progress updates your team enters in SharePoint tasks into your Project file.
SharePoint doesn’t have the scheduling prowess Project does. Before you dive into synchronizing tasks, determine whether Sync with Tasks List satisfies your needs:
You must manually set your task start and finish dates. SharePoint can’t calculate project schedules, so tasks you synchronize appear in SharePoint Tasks lists as manually scheduled (Planning with Manually Scheduled Tasks). If you synchronize auto-scheduled tasks, SharePoint warns you that it will convert them to Manually Scheduled mode. That means you must specify the start and finish dates for all tasks, manage links between tasks as dates change, and resolve resource overallocations that occur.
Resources assigned to tasks must be members of the SharePoint site. The only resources you can see in a SharePoint Tasks list are people who are members of the SharePoint site. If you assign other resources to tasks, the Resources cells for those tasks are blank.
Custom fields that use formulas don’t synchronize. The good news is that custom fields without formulas do synchronize to SharePoint. See Managing the fields in a SharePoint Tasks list for adding fields to the SharePoint Tasks list. The formula limitation is probably not a big hurdle, because you’re not likely to customize too many fields with formulas if you’re manually scheduling a project.
The Notes field doesn’t synchronize. One way to work around this limitation is to add notes to a custom Text field, which does synchronize.
If you build a task list in Project, here’s how to publish it to a SharePoint Tasks list:
Open the Project file you want to synchronize, and then choose File→Save & Send→Sync with Tasks List.
The Sync with Tasks List page appears in the Backstage.
In the Site URL box, type the address for the Tasks list site, as shown in Figure 20-12. Click Validate URL.
Don’t include the name of the Tasks list in the URL. For example, if your SharePoint site is called “ProjectCollaboration,” type the URL for the site, something like http://sharepoint/sites/ProjectCollaboration/.
In the “Select an existing tasks list, or enter a new name” box, choose the Tasks list you want to use.
When you validate the site URL, any existing Tasks lists on that site appear in the drop-down list. To create a new Tasks list, type a name for the new list. (SharePoint creates the Tasks list when you perform step 4.)
Click Sync.
A SharePoint Synchronization message box shows progress. If you try to synchronize auto-scheduled tasks, a warning tells you that those tasks will change to manually scheduled. Click OK to continue. Click Cancel to keep the tasks auto-scheduled and cancel the synchronization.
If any of the resources you’ve assigned to tasks don’t exist within the SharePoint server, a warning tells you that those resources won’t be published. Although you won’t see the resource names in the SharePoint Tasks list, the assignments remain in your Project file.
To see your tasks in SharePoint navigate to the site in your browser.
Tasks lists appear on the site home page under the Lists heading.
Click the name of the Tasks list, for example “Party Tasks,” as shown in Figure 20-13.
If the project has summary tasks, you initially see only the top-level summary tasks. Summary task names appear in blue text to indicate that you can click them to display their subtasks.


Figure 20-13. The Tasks list displays a Gantt Chart–like view that works like its counterpart in Project. You can drag the vertical divide to show more or less of the table or timescale. Links between tasks are visible in the timescale. Summary task names are blue to show that you can click them to display their subtasks.
You can build a list of tasks in SharePoint and then bring those tasks into Project. When you add tasks to a SharePoint Tasks list, you can specify predecessors, assigned resources, and other task information. Here are the steps:
In SharePoint, create a new Tasks list.
Click the Lists heading, and then click Create. On the Create page, under Tracking, click Project Tasks. In the Name box, type the name of the list and then Create. SharePoint adds the list to the navigation bar on the left side of the page.
In the navigation bar, click the Tasks list name—for example, Tasks.
If any tasks already exist, they appear on the list page.
To add a task to the list, click “Add new item”.
The Tasks - New Item window appears, as shown in Figure 20-14.
In the Title box, type the name of the task. Specify any other task information you want.
To link the task to a predecessor, select the predecessor and click Add. To assign a resource, in the Assigned To box, type the name of the resource. In the Start Date box, type a date.
Click Save.
The task appears in the list. Repeat steps 3 and 4 for each task you want to create.
In Project, create a new blank Project file (Creating a Blank Project File) and choose File→Save.
In the Save As dialog box, name the file and click Save.
To sync the blank Project file to the Tasks list, perform the steps in the section Publishing Project tasks to SharePoint on page 535. In the “Select an existing tasks list, or enter a new name” box, choose the Tasks list you created on the SharePoint site.
When you validate the site URL, any existing Tasks lists on that site appear in the “Select an existing tasks list, or enter a new name” drop-down list.
Click Sync.
The tasks appear in your Project file.

Once a connection exists between a Project file and a SharePoint Tasks list, you can specify the fields that appear in the SharePoint Tasks list. For example, you can add the WBS field, a cost field, or a custom field to the SharePoint view. The box on Keeping Tasks in Order tells you why adding the WBS field can be helpful.
Here’s how you specify the fields that sync to a SharePoint Tasks list:
In Project, choose File→Info.
Once a Project file is linked to a SharePoint Tasks list, the Info page includes a Sync button. You can also choose File→Save & Send and then choose Sync with Tasks List.
Below Sync with Tasks List, click Manage Fields.
The Manage Fields dialog box opens, showing the fields in the Project table and in SharePoint. A checkmark in the Sync column indicates that a field synchronizes between the two programs. In the Manage Fields dialog box, some fields are grayed out, which means you can’t change whether they synchronize. For example, the Name, Start, Finish, % Complete, Resources Names, and Predecessors fields are automatically synchronized.
To add a field, click Add Field. In the Add Field dialog box, choose the Project field you want to add, such as WBS (as shown in Figure 20-15), and then click OK. Click OK to close the Manage Fields dialog box.
The checkmark in the Sync column is turned on automatically.
Click Sync.
You must click Sync to send the WBS information to SharePoint.
In the SharePoint Tasks list, choose List Tools→List. On the List tab, choose Manage Views→Modify View.
The Edit View page appears.
To display a field in the view, turn on the field’s checkbox. Click OK.
To reorder the columns in a view, position the pointer over a column heading. When the pointer turns into a four-headed arrow, drag to the new location.

Figure 20-15. To add a field, in the Project Field box, click the down arrow and choose the field you want to add. Project automatically copies the field name to the SharePoint Column box. If you want the SharePoint column to use a different heading, then type the name in the box before you click OK.
You and your team members can view and edit values in SharePoint. For example, team members can change values in the % Complete field or change a finish date for a task. Then you can synchronize the changes (in Project, choose File→Info→Sync) to bring them back into Project. To edit a value in a SharePoint Tasks list, click the cell and type or choose the new value.
Note
If you and someone on your team both modify the same field—one in Project and the other in SharePoint—when you synchronize, Project displays a Conflict Resolution dialog box. The dialog box has a Project Version column and a SharePoint Version column. The fields that differ between the two are highlighted. To keep the values from Project, click Keep Project Version. To use the values from SharePoint, click Keep SharePoint Version.
Storing files on a SharePoint site means you can share your files with others. As long as they have access to the SharePoint site, they can download the files stored there. A SharePoint site comes in handy in other ways. Imagine you travel to another office and your laptop dies en route. You can borrow a computer, go online, download the files you need from the SharePoint site, and continue working with a minimum of interruption. Although Project 2010 provides a command to save a Project file to a SharePoint site, you can choose from three methods:
Saving in Project. Say you just added the finishing touches to a Project schedule and want to store the file on a SharePoint site. You can do that right within Project. Choose File→Save & Send→Save to SharePoint. Below the “Save to SharePoint” heading on the right side of the page, click “Browse for a location”, and then choose the SharePoint site you want to use. Click Save As. In the Save As dialog box, click Save, and Project dutifully saves your file on the SharePoint site.
Saving on the SharePoint site. If you’re already on the SharePoint site, there’s no need to go back to Project. On the SharePoint home page, choose Shared Documents or the name of your document library. Then, on the Shared Documents page, click “Add new document”. In the Shared Documents - Upload Document dialog box, click Browse. In the Choose File to Upload dialog box, navigate to the folder with the file you want to save, select the file, and click Open. Back in the Shared Documents - Upload Document dialog box, click OK.
The Save As command. You can also specify the URL for a SharePoint site in Project’s Save As dialog box. Choose File→Save As. In the Save As dialog box, copy the URL for the SharePoint site into the folder path box, as shown in Figure 20-16, and click the arrow to navigate to the site. For example, if the Documents Library URL is http://sharepoint/sites/ProjectCollaboration/Shared%20Documents/Forms/AllItems.aspx, copy http://sharepoint/sites/ProjectCollaboration/Shared%20Documents into the box. When the SharePoint document library appears in the dialog box, click Save.

Figure 20-16. After you copy a URL into the folder path box, you can choose the URL again by clicking the down arrow on the right side of the box. If you add the SharePoint URL to your Favorites list, you can reach it from any Open, Save, or Save As dialog box. For example, open the Documents Library in the Save As dialog box. Right-click Favorites, and then choose “Add current location to Favorites”. The location joins your other favorite locations in the Favorites list as shown here.