
Chapter 17: Analytics, Reports, and Data Exports
At this point, you should have helped your client enter various types of data into their NetSuite account. Always remember, though – people don't use computers because they like looking at numbers, dates, names, and so on; they use computers to gain insights from data.
In this chapter, we will explore all the ways a client might want to use their data for analysis, decision making, and to feed other processes outside of the system, and how you can help them achieve this.
In this chapter, we will cover the following topics:
- Using searches and views to find information
- Creating reports for in-depth analysis
- Utilizing datasets and workbooks to look even closer
- Creating exports with SuiteAnalytics Connect
You might need to work with most of the client's users on these features since everyone has data in the system and most need to find it and use it for a wide variety of purposes. As always, these users should start with the NetSuite Essentials course, but then if some of them can take one or more of the SuiteAnalytics courses too, that's a bonus.
Using searches and views to find information
Nine times out of 10, when a client asks a question such as, How can I find all the X that have Y?, we point them to Searches in the UI. Keep in mind that searches are very powerful and it's only occasionally necessary to use any other more involved features. We create searches for ad hoc needs, such as when we need to find an example of an item that has been set up for drop shipments for a demo, and we create them when we have a recurring business process that needs a specific list of things. An example of the latter is when a company wants to find all of the sales orders they ended up losing money on. (This should never happen, of course, but by the same thinking, you want to know if it ever does.)
The simplest search that users can perform uses the Global Search field, right at the top of every screen in NetSuite. This simple-looking field is more powerful than many realize:

Figure 17.1 – The humble but very useful Global Search field
Here are my favorite tips for getting the most out of Global Search:
- Alt + G: This is the keyboard shortcut you can use from any NetSuite screen to jump to the Global Search field.
- Custom records: You can define your custom records to be included in global searches or excluded. This is helpful for records a group of users needs quick access to, such as warranty records or customer serial numbers. It's also a good idea to exclude records you're trying to keep most users away from, such as a table that's only used by a script.
- Inactive records: By default, records marked as Inactive are not shown in the results of a global search. You can change that in your User Preferences (go to Home | Set Preferences) or you can add a plus character (+) to the end of your search terms; for example, item: old product 100+.
- Help: You can search the Help system from the Global Search field. Just use the help: prefix before your terms; for example, help: inventory adjustment.
Saved searches are great for when you want to get more advanced regarding the criteria to be applied to a set of records, or when you're using a search such as a report, where a user or a group needs to run it more than once. Learning to use all of the features of searches will make a difference for your users. Getting them just the results they're looking for – or better, helping them learn how to do this for themselves – can make you the hero of many otherwise troublesome situations.
Here are the saved search limitations and features every NetSuite business analyst should know about:
- One record type: Searches always focus on a single record type, but the system's architects knew we'd need some flexibility in that, so we are allowed to select Entity and Transaction as the record types when we want to include more than one type of those records in the search's results.
- Expressions in criteria: Don't let these throw you; they're not hard to use and are frequently required to find just the right set of data you're looking for. I find it helps to try to think about sets of records (those you want to include and those you don't want to see), and then to picture a Venn diagram with those sets of data. Do they overlap and if so, how? For instance, if you know you want to include any sales orders that either have one type of item or have a total of more than a certain amount, you will need to use expressions with parentheses to find them.
- Mainline: This is an odd term, for sure, but in the system, a transaction search that only focuses on the Mainline will not include any line item details; a search with Mainline set to false forces NetSuite to include line item details where it might not otherwise. This is important since some of the fields we can select in the columns have the same name in the header of their transactions as on the lines. This is true for Amount and Location, for instance, so choosing the right value for the Mainline setting can make the difference in getting just the right set of results you're looking for.
- Summarized results: Sometimes, we don't want to see every line item on a set of transactions (for instance) but we need to summarize them somehow. That's when this feature comes in handy. For instance, if the warehouse people need a quick idea of how many sales orders that are ready for shipping on a given day have special order items, we can create a search with summarized results to show them the sum of the quantities of those items instead of hundreds of detailed lines. We can also summarize results by grouping them, counting them, and getting minimum and maximum values for them.
- Highlighting: This is a great feature, so long as it's used correctly. Nobody will be able to work with a set of search results where every line has a different font and background colors, or where some rows are bold and some italicized. Instead, my guideline is to use highlights very sparingly to make only the most important records stand out from the crowd, and only in cases where the highlight indicates an action is needed from the user.
The Oracle NetSuite-provided training course called Business Intelligence with Saved Searches offers even more powerful user tips to help you make the most of saved searches.
And speaking of searches, don't forget that we can customize almost any list of records in an account with what's known as a view. These are searches that are enabled for use as a view, and they can include most of the features mentioned previously. We briefly talked about these before and it's worth mentioning here that these are very important for both native and custom record types. They help users find the records they need to work with and get their jobs done. A good view with the right filters applied and also available on the screen for the user to select from is helpful to new users of the system.
Searches and views are used to convey data to users in ways they can use them every day. Whether they're a customer service rep with a customer on the phone or a CEO who needs to know how sales are looking this month, you can help them solve the problems they face by knowing all the ins and outs of these features.
Creating reports for in-depth analysis
NetSuite offers another feature that helps with in-depth analysis and that is where reports shine. A new account comes with a set of pre-defined reports out of the box for many areas, including finances, items and inventory tracking, accounts payable and receivable, and much more. These native reports can mostly be customized, but not infinitely. For instance, the Balance Sheet financial report can be customized to include almost any period you want it to display, but it cannot be made to show item inventory levels (not that you would ever want that, of course).
The system does allow us to customize most of the native reports, though, and the options we have on that screen are generally similar, though some options will only be available when they make sense for the report you start from.
The following is the UI for customizing a financial report, such as a Balance Sheet:
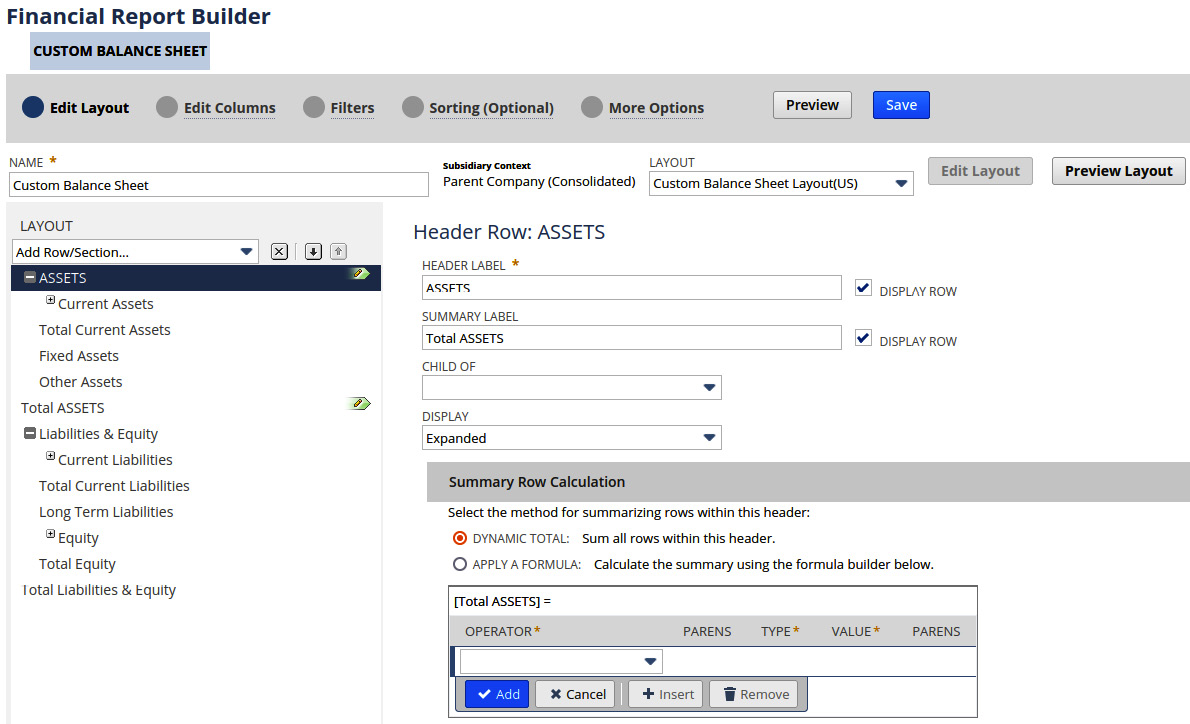
Figure 17.2 – The Customize screen for the Balance Sheet report
With these options, we can change the general layout of the report and what will appear on the columns and rows of the report's contents. We can choose how the content will be summarized on the totals rows as well.
If the native reports don't get us what we need, we can always create a new custom report from scratch, based on the report types available in the account. Remember that all reports have permissions and users will need to have the right permissions to be able to both create and view any new report you create. In a OneWorld account, many reports require us to make a subsidiary choice, so our view in the report will be restricted to just that selected subsidiary. We can do that by going to Home > Set Preferences > Restrict View.
When we need to start a report from scratch, we must look at the top of the Reports menu in the UI. First, we must choose between creating a New Report or a New Financial Report. The New Financial Report option allows us to create new balance sheet, cash flow, income statement, or cash statement reports. The other option is for all other types of reports. There is a long list of report types in that second list, which will vary depending on the features you have enabled in each account. We can use this feature to create reports for the support personnel on things such as cases and issues. Alternatively, we can help the sales team keep track of items, as well as inventory and sales figures. There are also reports for system administrators for tracking things such as integration use and web store sales metrics.
There are a lot of things we can customize about each report type in the system, so I usually recommend that people take the offered Oracle NetSuite training on this topic if they're going to spend any real time creating and/or using this feature. The UI is different from every other analytic feature in the system and it's not the most user-friendly, in my experience. Having an experienced person guide users through the process is usually key to their success.
Once you have set up a report, working with it is straightforward. You can view it any time you need, share it with other users, and export it to a variety of formats, including PDF, Word, and Excel. You can print them and send them via email as well. Another useful (but often forgotten) export option you can enable for most reports (other than the native financial statements) is known as Microsoft Excel Web Query and its files. These IQY files are definitions of the report you can download and then view in Excel. Each time you do that, you refresh the data defined in that report by pulling it down from NetSuite. For many companies, this can be very handy, since they can share the Excel file to select groups of co-workers, without necessarily having to train them on NetSuite.
Reports are great when a more polished set of results is needed; they can look nicer than searches, for instance, especially on the financial side of the house, where standards dictate what these reports should look like. Now, let's move on to the newest feature from SuiteAnalytics – workbooks.
Utilizing datasets and workbooks to look even closer
For most of the time I've worked with NetSuite, I faced a real challenge when it came to searching for and reporting on data in the system. That has to do with what are called "joins." If you think about sales orders, they are joined to the customers list, by way of the customer (or entity) field on the form. And customers are also joined to other lists, such as currencies and credit cards. If you want to get a list of sales orders that contains certain customers, but only those who have more than one credit card, you can't use saved searches. That's because they can only "see" one join per search. Looking into that credit card list on the customer record, the transaction would require NetSuite to make a second join, and that's beyond the capabilities of saved searches. In the past, we used to solve this by making more than one search, and then somehow stitching the results together, with help from the users, via exports to Excel or a script.
Within the last few years, though, NetSuite has introduced two new features – SuiteAnalytics workbooks and datasets – that are like saved searches but more powerful, and they do not have this restriction on joins between record types. This is NetSuite's answer to the people who said the system doesn't include any useful business intelligence tools, and it's great once you get used to working with it. We can access these features via the Analytics option on the main menu bar in the UI.
With a dataset, we can gather pretty much any related data we can find in the account into a dataset. Building a dataset includes selecting records and fields and then applying filters to them. Since datasets can contain templates they're derived from, every new NetSuite account should come with a few examples to get you started. We can explore those, save copies and tweak them as we need, or we can always create a new dataset from scratch. Since this feature gives us access to all of the data in the account, we can include any custom fields and custom records we've got in any dataset, and we can even combine datasets when we want to. With this step, you've told the system which records you're interested in and which you are not, but you've not laid them out into a report yet.
We do that with workbooks. You can create one or more visualizations based on the data in the dataset inside each workbook. For instance, if you build a dataset, as described earlier, with details from transactions but only for customers who have more than one credit card, you can then create two different reports from that data, and also a pivot table chart in a workbook. We can add a new table, a pivot, or a variety of charts to any workbook at any time.
For example, this is what the Sales (Ordered) template workbook, which comes with every account, looks like:
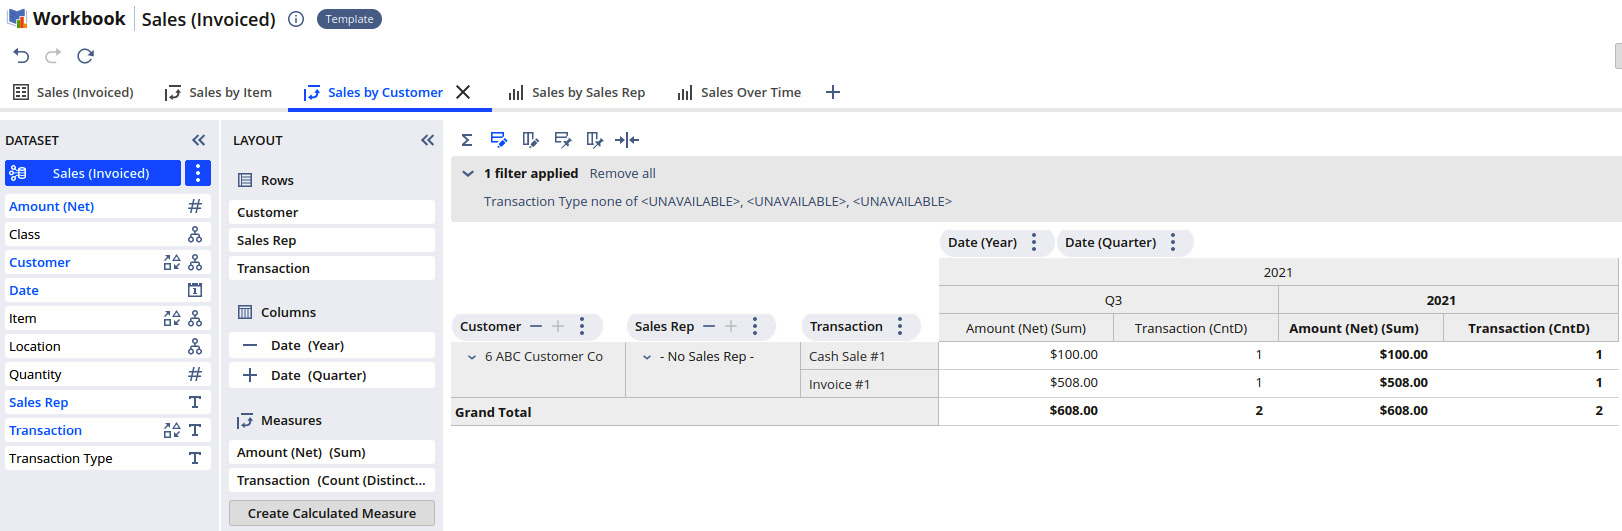
Figure 17.3 – The Sales (Ordered) workbook's Sales By Customer pivot view
From this screenshot, we can see that a workbook can have multiple tabs, each with a different visualization of the data from the dataset. The author of the workbook sees this view, but they can publish it to other users who might only be allowed to view the results (without changing the workbook itself). This is done via the Share button, which allows the owner to control who else can see the workbook's data. These views can be placed on a role's dashboard, for instance, and the data can be exported to CSV files.
SuiteScripts can now also work with datasets and workbooks via the API, and this has become a way to deliver powerful integrations to other systems, again when saved searches fall short of a data analyst's needs. I'll talk more about this option in Chapter 18, Managing Gaps and Creating Custom Automations.
I've heard a lot of uncertainty from users about these new features, by the way. They think they're too complicated to learn and use regularly. I've found that once you get the hang of datasets and workbooks, you can set up a quick search or a much more complicated view into the data with these tools, almost as quickly as we can create saved searches. Give it a try and see what you think. The NetSuite Help and SuiteAnswers have many useful pages on these topics, and quite a few videos to make learning about these features as easy as possible.
You might be wondering, what should we do when a client needs to routinely pull data out of the system, for use in a data warehouse or some other external application? In the next section, I'll cover my favorite option for meeting this requirement.
Creating exports with SuiteAnalytics Connect
When a client needs to access their NetSuite data from another system, we have a few natively supported options for making this happen. I will cover all of the integration options in Chapter 19, Managing Integrations, but when we're talking about more than a little data, and the client needs to access that data regularly, we usually steer them toward SuiteAnalytics Connect. This is NetSuite's built-in, easily enabled option that allows other applications to make industry-standard connections in NetSuite to pull data out of the system. This is a one-way street, if you will; we can't use this feature to make any updates in NetSuite.
Some people call this "ODBC" since that's the most commonly selected option for making the connection to NetSuite at a technical level, but the system offers a couple of other standard options as well – JDBC and ADO.NET. Users running software outside of NetSuite use one of these technologies to make connections to NetSuite and then execute what are called "queries" to pull just the data they're looking for. This is meant to be a programmatic connection, automated in some way by the client software, so this does require someone with technical skills to set it up. This usually makes the most sense when we are connecting NetSuite to a client's data warehouse or business intelligence system. The technical users write queries that collect the latest sales data, for instance, and then they turn that raw data into reports or whatever they need in the external system.
These queries are written in an industry-standard syntax known as SQL-92. For people who have written queries with databases such as Oracle, MySQL, or Microsoft SQL Server, this should be very familiar. NetSuite publishes a list of the tables and fields that can be accessed via this interface (the Connect Schema), in Help on a set of pages called the Connect Browser. You can always find the link to this page in the NetSuite Help. It lists every record type and field that's available via this interface. Custom fields and custom record types are available here too; they're just not listed in the browser (since they're custom).
Let's look at an example, just briefly, so that you can see the power of this feature. Say your client needs to export a set of details about their customers to an external reporting system. They want to see a list of all customers that have been created in the last 24 hours and get 5 details about each of them. The query for this might look something like this:
Select
customer_extid,
firstname + " " + lastname,
date_first_sale,
email,
mobile_phone
From Customers
Where
create_date >= '2020-01-01'
Order By
lastname, firstname, date_first_sale
This Select query says we should focus on the Customers table, only include rows from that table where the date the record was created was after a set date, and then include a few named fields from that table. Queries can get much more complicated than this when we include joins to other tables. For instance, when we want to include transaction data in a query, we include the Transactions table, and then join that to the Transaction_lines table to get the list of item lines from each transaction. The Connect Browser spells all this out, so you can learn to use it if you're the technical sort, and we can also use a Query tool to explore the data we have access to via the so-called System Tables. The oa_tables table lists all tables we can see via queries, and the oa_columns table lists all the fields in each table. With these tools, we can put together just the right set of queries to pull all the data we need from NetSuite, at whatever frequency is right for the business. Just note that this is always a "pull" from outside of the system; there is no option here to have NetSuite "push" the data out on its own.
Summary
In this chapter, I've tried to convey the main ways we can help clients gather their data, display it in meaningful ways, and share it with others. Searches and views are quick and simple to create for almost any user with a little training, but they can be so important to the flow of the client's business. Reports, workbooks, and datasets allow us to take a deeper look into the data and format it in standardized ways. To export the data, we put it in shareable forms such as PDFs and Excel files so that NetSuite's data isn't trapped in the system. Speaking of that, SuiteAnalytics Connect allows us to export data in a regular, industry-standard way to other systems. Many clients rely on this to feed data into their data warehouse or another centralized reporting system. The freedom NetSuite clients have in working with their data should be clear from all of these options.
With that, we've finished talking about the native transactions and main features almost every client uses. In the next chapter, we'll dive in and learn how we can fill in the gaps in system functionality when they pop up with customization features such as SuiteFlows and SuiteScripts.
Self-assessment
For every consultant, you must think on your feet to solve client problems before they become major crises. Apply your thinking skills to these example problems based on this chapter's contents, and think about how you would solve them:
- Your client has a search they've set up to help them find customers that meet a certain set of criteria. They want to have the system send them an email whenever any results are found in this search so that they can fix issues and communicate with the customers. How can you set up a search in NetSuite that will meet this requirement?
- The Current Inventory Snapshot report is very handy in that it easily shows the inventory levels for items in stock right now. However, your client notices that the On Order column pulls from both Purchase Orders and Transfer Orders. They want to be able to split those numbers into separate columns so that they can see just the Purchase Order and the Transfer Order numbers separately. How would you help them achieve this?
- You've shown some users how to use the workbook feature to build a custom report and they are getting into it. They want to know whether they can share one of their workbook's outputs with a group of users, via their NetSuite dashboards. There is a way to do this; what are the steps they need to take?
- Your client, who sells software and services, is heavily relying on the Advanced Revenue features in the system and they need to send some of their sales and revenue arrangement details to an external partner. They need to send some data immediately as it changes in NetSuite and some data can be exported in batch mode. Which of the options we've discussed in this chapter could be used to meet these requirements and which is best suited to this task?
- When enterprise companies have smaller subsidiaries using NetSuite, they frequently need to send a lot of their data up to a parent company's servers so that it can be incorporated into the main business' reporting, and so on. A client is looking to use SuiteAnalytics Connect for this purpose from their account, but they're concerned about how well it will stand up to large volumes of data being transferred regularly. How can you help them get past their concerns and quickly establish whether this is the right solution for them?