
Chapter 18. Application Identification
It used to be so easy to identify applications in network traffic: you looked at the port number, or if that failed, you looked at a couple of header packets for identification information. But these identifiers have become muddier over the past decade, in particular as users seek to hide certain classes of traffic (BitTorrent!) and as privacy advocates push for increased encryption.
There are still methods for identifying traffic that do not rely on payload. Most protocols have a well-defined sequence and certain predictable behaviors that mark them so you don’t have to look at the payload. By looking at the hosts to which a session talks and at packet sizes, a surprising amount of information is available.
This chapter is broken into two major sections. The first section focuses on techniques for identifying a protocol, starting with the most obvious methods and moving toward more complex techniques such as behavioral analysis. The second section discusses the contents of application banners and some methods for finding behavioral and payload information for analysis.
This chapter is very much a companion to Chapters 6 and 7; however, those chapters are more focused on the data that you can collect. This chapter is focused on application identification specifically, and is intended as a prelude to Chapter 19.
Mechanisms for Application Identification
In a perfectly safe and secure computing environment, you could just examine the configuration file on each server and it would tell you all the traffic that the server allows. Unfortunately, there are many hidden ways of starting traffic that undermine this simple strategy. You may have hosts on your system you don’t know about that were started by users with innocent or not-so-innocent goals of their own. Services can be started by administrators or ordinary users outside of your startup configuration. And legitimate servers can be taken over by intruders and used for things you never intended. Although many of the techniques in this section are commonly applied by snoopers who don’t have access to your servers’ configuration files, you should be using the techniques as well so you know what is really happening.
Port Number
Port numbers are the first way to check what a service is, and while there’s no technical requirement that a particular service runs on a particular port, there are social conventions that tend to make it so. IANA maintains a public registry of port numbers and their associated services. Although port number assignment is effectively arbitrary, and users have an active interest in evading detection by using previously untouched port numbers (or, slightly more deviously, by using common port numbers), the well-known ports still carry enough official and innocent traffic to make them the first-pass mechanism for identifying protocols. Techniques we’ll discuss later in this section often use port numbers as an assertion on the user’s part. For example, a user talking on port 80 is effectively asserting that she’s talking to a web server.
Port number assignment is chaotic because all anyone really has to do is pick a number and hope nobody else is using it. The official registry maintained by IANA focuses on protocols designed as part of the RFC process. Other registries and lists include a Wikipedia page, SpeedGuide.net, and the SANS Internet Storm Center, which provides a mini-messageboard per port with useful insights.
So, a huge number of ports are reserved for certain applications, and another huge number are used conventionally for other applications—but there are a small set of applications that actually matter. Table 18-1 lists the ports that I worry about the most, with a short description explaining why in each case.
| Port | Name | Meaning |
|---|---|---|
The Holy Trinity |
||
80/tcp |
HTTP |
Not only is HTTP the basic protocol for nearly everything on the internet now, it’s also the most commonly imitated protocol. Users will drop traffic on port 80 to evade firewall rules. |
25/tcp |
SMTP |
Email is the most critical service after HTTP, and also one of the most attacked. |
53/udp |
DNS |
Another critical foundational protocol; DNS attacks will seriously damage networks. |
Infrastructure and Management |
||
179/tcp |
BGP |
Border Gateway Protocol; a core protocol for internetwork routing. |
161-162/udp |
SNMP |
System Network Management Protocol; used to manage routers and other devices. |
22/tcp |
SSH |
The administrative workhorse. |
23/tcp |
Telnet |
If I see Telnet, I kill the connection. It is obsolete and should be replaced by other protocols, notably SSH. |
123/udp |
NTP |
Network Time Protocol; used to coordinate clocks on networks. |
389/tcp |
LDAP |
Lightweight Directory Access Protocol; manages directory services. |
File Transfer |
||
20/tcp |
FTP-data |
Along with 21, makes up FTP. |
21/tcp |
FTP |
The FTP control port. Another service I kill if I see it. Use SFTP. |
69/tcp |
TFTP |
Trivial file transfer; largely used by system administrators and hopefully never seen crossing a border router. |
137–139/tcp & udp |
NETBIOS |
NetBios is the infrastructure used for Service Message Block (SMB) and in particular provides sharing features for Windows and (via Samba) Unix systems. Pounded by attacks over its history. |
143/tcp |
IMAP |
Internet Message Access Protocol; one of the two standard email client protocols. |
110/tcp |
POP3 |
Post Office Protocol; the other standard email client protocol. |
Databases |
||
1521/tcp |
Oracle |
The primary Oracle server port. |
1433/tcp & udp |
SQL Server |
Microsoft SQL Server’s port. |
3306/tcp |
MySQL Server |
MySQL’s default port. |
5432/tcp |
Postgresql Server |
Postgres’s default port. |
File Sharing |
||
6881–6889/tcp |
BitTorrent |
The default BitTorrent client ports. |
6346–6348/tcp & udp |
Gnutella |
BearShare and LimeWire’s default Gnutella ports. |
4662/tcp & udp |
eDonkey |
Default port for eDonkey clients. |
On Unix and Windows systems, port assignment is supposed to be controlled by the /etc/services file (WINDOWSSYSTEM32DRIVERSETCSERVICES on Windows hosts). A dump of the file, shown in Example 18-1, shows that it’s a simple database listing a service name and the corresponding host.
Example 18-1. The contents of /etc/services
# Catting /etc/services without header info
$ cat /etc/services | egrep -v '^#' | head -10
rtmp              1/ddp     # Routing Table Maintenance Protocol
tcpmux            1/udp     # TCP Port Service Multiplexer
tcpmux            1/tcp     # TCP Port Service Multiplexer
nbp               2/ddp     # Name Binding Protocol
compressnet       2/udp     # Management Utility
compressnet       2/tcp     # Management Utility
compressnet       3/udp     # Compression Process
compressnet       3/tcp     # Compression Process
echo              4/ddp     # AppleTalk Echo Protocol
rje               5/udp     # Remote Job Entry
The names in the services file are used by getportbyname and any
other port lookup functions to identify protocols. This does not,
of course, mean that the users are really invoking those services, just that
services say the ports are supposed to be used by the services. To get a list of all the services I have listening on a host, I use netstat -a, as discussed in Chapter 6. An example output is shown in Example 18-2.
Example 18-2. netstat and /etc/services/
# I'm running a Django web server on port 8000, and I run netstat
$ netstat -a | grep LISTEN
tcp4       0      0  localhost.irdmi        *.*                    LISTEN
tcp46      0      0  *.8508                 *.*                    LISTEN
tcp46      0      0  *.8507                 *.*                    LISTEN
$ cat /etc/services | grep irdmi
irdmi2          7999/udp     # iRDMI2
irdmi2          7999/tcp     # iRDMI2
irdmi           8000/udp     # iRDMI
irdmi           8000/tcp     # iRDMI
netstat consults /etc/services to determine what the port number
is named, and you can always find the real port number in
/etc/services. However, there is no guarantee that the service is
actually what the named service is.
It’s appropriate at this point to make a digression into the raving
paranoia characteristic of a network traffic analyst. netstat is
obviously a great tool for identifying which ports are open on your
host, but if you want more certainty, scan the machine vertically
and compare the results.
Application Identification by Banner Grabbing
Banner grabbing and its companion function, OS fingerprinting, are scanning techniques used to determine server and operating system information. They rely on the convention that the first thing most applications do when woken up is identify themselves. Most server applications respond to an open socket by passing their protocol, their current version, or other configuration information. If they don’t do it automatically, they will often do so with a little prodding.
Banner grabbing can easily be done manually using any “keyboard to the
socket” tool, such as netcat (see Chapter 7 for more
information). Example 18-3 shows active banner
grabbing using netcat to collect some data. Note that I am able to
pull information from several servers without actually using the
protocol in question.
An alternative to active banner grabbing is passive banner grabbing,
which can be done using tcpdump. Since a banner is really just text
that appears at the beginning of a session, grabbing the payload of
the first five or six packets will provide banner data as well.
bannergrab.py is a very simple banner grabbing script using Scapy. It’s not trying to parse banner contents—it’s just grabbing the first load of information it sees. This can be quite informative. Example 18-4 shows the contents from the SSH dump.
Example 18-5 shows a pull from www.cnn.com.
Example 18-5. A pull from cnn.com
57.166.224.246 HTTP/1.1 200 OK
Server: nginx
Date: Sun, 14 Apr 2013 04:34:36 GMT
Content-Type: application/javascript
Transfer-Encoding: chunked
Connection: keep-alive
Vary: Accept-Encoding
Last-Modified: Sun
157.166.255.216
157.166.241.11 HTTP/1.1 200 OK
Server: nginx
Date: Sun, 14 Apr 2013 04:34:27 GMT
Content-Type: text/html
Transfer-Encoding: chunked
Connection: keep-alive
Set-Cookie: CG=US:DC:Washington; path=/
Last-Modified

66.235.155.19 HTTP/1.1 302 Found
Date: Sun, 14 Apr 2013 04:34:35 GMT
Server: Omniture DC/2.0.0
Access-Control-Allow-Origin: *
Set-Cookie: s_vi=[CS]v1|28B31B23851D063C-60000139000324E4[CE];
	    Expires=Tue, 14 Apr 2
23.6.20.211 HTTP/1.1 200 OK
x-amz-id-2: 287KOoW3vWNpotJGpn0RaXExCzKkFJQ/hkpAXjWUQTb6hSBzDQioFUoWYZMRCq7V
x-amz-request-id: 8B6B2E3CDBC2E300
Content-Encoding: gzip
ETag: "e5f0fa3fbe0175c47fea0164922230d4"
Acc

192.168.1.12 GET / HTTP/1.1
Host: www.cnn.com
Connection: keep-alive
Accept: text/html,application/xhtml+xml,application/xml;q=0.9,*/*;q=0.8
User-Agent: Mozilla/5.0 (Macintosh; Intel Mac OS X 10_8_3) AppleWebK
23.15.9.160 HTTP/1.1 200 OK
Server: Apache
Last-Modified: Wed, 10 Apr 2013 13:44:28 GMT
ETag: "233bf1-3e803-4da01de67a700"
Accept-Ranges: bytes
Content-Type: text/css
Vary: Accept-Encoding
Content-Encoding

63.85.36.42 HTTP/1.1 200 OK
Content-Length: 43
Content-Type: image/gif
Date: Sun, 14 Apr 2013 04:34:36 GMT
Connection: keep-alive
Pragma: no-cache
Expires: Mon, 01 Jan 1990 00:00:00 GMT
Cache-Control: priv

138.108.6.20 HTTP/1.1 200 OK
Server: nginx
Date: Sun, 14 Apr 2013 04:34:35 GMT
Content-Type: image/gif
Transfer-Encoding: chunked
Connection: keep-alive
Keep-Alive: timeout=20
In Example 18-5, the client is midway through the dump (at 192.168.1.12). Note the
sheer number of web servers; this is a common feature with modern
websites, and you can expect to see dozens of servers involved in
constructing a single page. Also note the information provided: the
server sends content information, the server name, and a bunch of
configuration data. The client string includes a variety of
acceptable formats and the User-Agent string, which we’ll discuss in
more depth later.
Banner grabbing is fairly simple. The challenge lies in identifying what the banners mean. Different applications have radically different banners, which are often complete languages in themselves.
Application Identification by Behavior
In the absence of payload, it’s often difficult to tell what an application is, but an enormous amount of information is still available about what an application does. Behavioral analysis focuses on finding cues for the application’s behavior by examining features such as the packet sizes and connection failures.
Packet sizes in any IP protocol are bound by the maximum
transmission unit (MTU), the maximum frame size defined by
the layer 2 protocol. When IP attempts to send a packet larger than
the MTU, the original packet is split into the number of MTU-sized
packets that are required to transmit it. In tcpdump and NetFlow data,
this means that the maximum packet size you will ever see is
controlled by the shortest MTU of the route taken by that packet so
far. Because the internet is dominated by Ethernet, this imposes an
effective limit of 1,500 bytes on packet sizes.
We can use this limit to split network traffic into four major categories:
- Fumbling
-
Covered in Chapter 13, this consists of failed attempts to open connections to targets.
- Control traffic
-
Small, fixed-size packets sent by clients and servers at the beginning of a session.
- Chatter
-
Packets less than the MTU in size, of varying size and sent back and forth between clients and servers. Chatter messages are characteristic of chat protocols like ICQ and AIM, as well as the command messages for many protocols such as SMTP and BitTorrent.
- File transfer
-
Asymmetric traffic where one side sends packets almost entirely of MTU size and the other side sends ACKs in response. Characteristic of SMTP, HTTP, and FTP.
Control packets are, when available, the most interesting information you can find on a service because their sizes are often specified by the service itself. Control messages are often implemented as templates of some form, with specific areas to fill in the blanks. As a result, even with the payload obscured, the sizes can often be used to identify them.
Histograms, presented in “Histograms”, are useful for comparing protocols via the lengths of their control messages. As an example, consider Figure 18-1. This is a plot of histograms for short flows (less than 1,000 bytes in total) from clients to BitTorrent and web servers.

Figure 18-1. Histogram comparing BitTorrent and HTTP short flow sizes
For a web client, this consists primarily of issuing the HTTP GET request and then receiving a file. The GET requests, as you can see in Figure 18-1, are spread over a somewhat normalized distribution between about 200 and 400 bytes. Conversely, the BitTorrent packets have a huge peak between 48 and 96 bytes, a function of the 68-byte BitTorrent handshake message.
Histograms can be checked visually, as in Figure 18-1, or numerically by calculating the L1 (or Manhattan) distance. In a histogram, you calculate the L1 distance as the sum of the differences between each bin. Normalized to percentages, this provides a value between 0 and 2, with 0 indicating that the two histograms are identical and 2 indicating that the two histograms are complete opposites. Example 18-6 shows how to calculate the L1 distance in Python.
Example 18-6. Calculating L1 distance in Python
#!/usr/bin/env python
#
#
# calc_l1.py
#
# Given two datafiles consisting purely of sizes and a histogram
# specification (bin size, max bin size), calculate the L1 distance
# between two histograms.
#
# command line:
#         calc_l1 size min max file_a file_b
#
# size: the size of a histogram bin
# min: the minimum size to bin
# max: the maximum size to bin
#
#
import sys

bin_size = int(sys.argv[1])
bin_min = int(sys.argv[2])
bin_max = int(sys.argv[3])
file_1 = sys.argv[4]
file_2 = sys.argv[5]

bin_count = 1 + ((bin_max - bin_min)/bin_size)
histograms = [[],[]]
totals = [0,0]

for i in range(0, bin_count):
    for j in range(0,2):
        histograms[j].append(0)

# Generate histograms
for h_index, file_name in ((0, file_1), (1,file_2)):
    fh = open(file_name, 'r')
    results = map(lambda x:int(x), fh.readlines())
    fh.close()
    for i in results:
        if i <= bin_max:
            index = (i - bin_min)/bin_size
            histograms[h_index][index] += 1
            totals[h_index] += 1

# Compare and calculate L1 distance
l1_d = 0.0
for i in range(0, bin_count):
    h0_pct = float(histograms[0][i])/float(totals[0])
    h1_pct = float(histograms[1][i])/float(totals[1])
    l1_d += abs(h0_pct - h1_pct)

print l1_d
Chatting and file transfers can be examined by identifying the individual packet sizes or, in the case of flow files, comparing the mean packet sizes for the flow (flow bytes divided by flow packets). If one side is close to the MTU, odds are that it’s a file transfer, and if both sides are roughly asymmetric and greater than 40 bytes per packet, some form of chatter may be going on. To illustrate this graphically, consider the plots in Figures 18-2 and Figure 18-3. These show the packet sizes for a file transfer (HTTP) and chat (AIM) session, respectively.
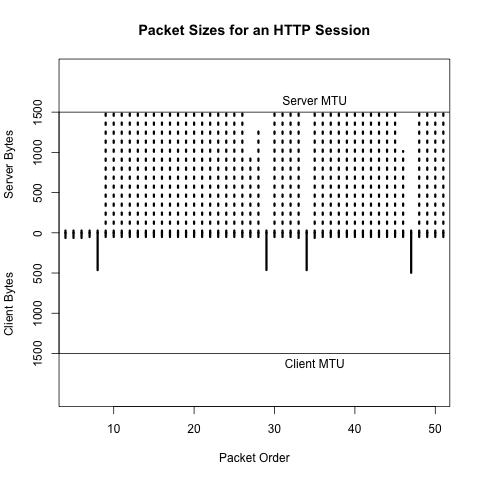
Figure 18-2. Packet sizes for an HTTP session

Figure 18-3. Packet sizes for an AIM session
Application Identification by Subsidiary Site
Network-aware applications rarely exist in a vacuum. Software updates, registration servers, database updates, advertising, and user tracking are all examples of network-based functionality that an application can conduct without a user being aware of them. At the same time, users may visit support forums, talk on message boards, or require access to information just to run the application.
As example of this behavior, consider two applications: antivirus and BitTorrent. Any antivirus application needs to contact its home servers on a regular basis in order to update the knowledge base. This activity is so predictable that it’s not uncommon for malware to explicitly disable the update addresses on the local host. Any host running AV should be contacting these addresses on a regular basis, and anyone who does is likely to be running AV.
Now consider BitTorrent. A considerable amount of work has been done in recent years to decentralize the protocol. In the late 2000s, it was possible to identify trackers and then identify users by finding out who was communicating with the trackers. Although tracker identification is less effective now, BitTorrent users still need to find their files, and the relevant magnet links are concentrated on sites such as the Pirate Bay, KickassTorrents, and other specialized torrent sites. Find a user who visits the Pirate Bay, then find someone engaging in huge file downloads on weird ports, and you have probably found a BitTorrent user. Once you’ve identified a server or host running a particular service, look at who else is talking to it.
Application Banners: Identifying and Classifying
Application banners can provide a lot of information about applications, servers, operating systems, and versions of all these things. Unfortunately, the format of these banners changes radically with each service, almost like a different language. The good news is that, with the exception of web browsers, most application banners are relatively simple. The bad news is that web browsers will make most of the banners you see.
Non-Web Banners
This section discusses server banners for servers not using the web. Banners can provide information on the operating system and the protocol, or can be obfuscated to prevent scanners from acquiring intelligence.
SMTP banners are defined in RFC 5321. On client login, an SMTP server should respond with a 220 status code (the greeting), along with some domain information. Given that SMTP servers are one of the services most commonly targeted by scanners, it’s not unusual to find SMTP banners reduced to a bare minimum by system administrators.
Microsoft defines the default banner for MS Exchange as:
220 <Servername> Microsoft ESMTP MAIL service ready at
    <RegionalDay-Date-24HourTimeFormat> <RegionalTimeZoneOffset>
with optional customization. An example banner for Exchange is:
220 mailserver.bogodomain.com Microsoft ESMTP MAIL service ready at
    Sat, 16 Feb 2013 08:34:14 +0100
SSH is defined in RFC 4253. On client login, an SSH server sends a brief message providing an identification string. According to the protocol definition, the identification string will be of the form:
SSH-protoversion-softwareversion SP comments CR LF
where SP is a space, CR is a carriage return, and LF is a line feed. All modern implementations of SSH should use 2.0 for the protocol version, but a server that supports previous versions of SSH should identify its version as 1.99. Comments are optional.
The following banner is an example of SSH before version 2.0, which should be rare:
SSH-1.99-OpenSSH_3.5p1
Everything else should be 2.0 or above:
SSH-2.0-OpenSSH_4.3
As these examples show, the first step to identifying a banner is usually to find the relevant technical documentation. This may be an RFC for an IETF-engineered protocol such as IMAP, POP3, SSH, or SMTP. For protocols that do not involve the IETF, some searching may be required to identify the developer of the protocol and any support sites. For example, BitTorrent’s protocol is currently specified at the theory.org wiki.
Web Client Banners: The User-Agent String
Web clients send browsers a complicated configuration string defining
their capabilities and preferences: the platform the browser runs
on, the operating system, and a variety of configuration details.
This string, the User-Agent, is defined in RFC
2616, but can become phenomenally complicated (as well as informative) fairly
quickly.
Some User-Agent strings are shown sorted by browser in Example 18-7.
Example 18-7. Example User-Agent strings by browser
Firefox:
Mozilla/5.0 (X11; U; Linux x86_64; en-US; rv:1.8.1.12) Gecko/20080214
	    Firefox/2.0.0.12
Mozilla/5.0 (Windows; U; Windows NT 5.1; cs; rv:1.9.0.8) Gecko/2009032609
	    Firefox/3.0.8
Mozilla/5.0 (X11; U; Linux i686; en-US; rv:1.8) Gecko/20051111 Firefox/1.5

Internet Explorer:
Mozilla/5.0 (compatible; MSIE 9.0; Windows NT 6.1; WOW64; Trident/5.0; SLCC2;
	    Media Center PC 6.0; InfoPath.3; MS-RTC LM 8; Zune 4.7)
Mozilla/5.0 (compatible; MSIE 10.0; Windows NT 6.1; Trident/6.0)
Mozilla/5.0 (compatible; MSIE 9.0; Windows NT 6.1; Trident/5.0; Xbox)

Safari:
Mozilla/5.0 (Macintosh; Intel Mac OS X 10_6_8) AppleWebKit/534.57.1
	    (KHTML, like Gecko) Version/5.1.7 Safari/534.57.1
Mozilla/5.0 (iPad; CPU OS 6_0 like Mac OS X) AppleWebKit/536.26
	    (KHTML, like Gecko) Version/6.0 Mobile/10A403 Safari/8536.25

Opera:
Opera/9.80 (Windows NT 6.0) Presto/2.12.388 Version/12.11
Opera/9.80 (Macintosh; Intel Mac OS X 10.8.2) Presto/2.12.388 Version/12.11
Opera/9.80 (X11; Linux i686; U; ru) Presto/2.8.131 Version/11.11
Mozilla/5.0 (Windows NT 6.1; rv:2.0) Gecko/20100101 Firefox/4.0 Opera 12.11

Chrome:
Mozilla/5.0 (Windows NT 6.2; WOW64) AppleWebKit/535.24
	    (KHTML, like Gecko) Chrome/19.0.1055.1 Safari/535.24
Mozilla/5.0 (Macintosh; Intel Mac OS X 10_7_3) AppleWebKit/535.19
	    (KHTML, like Gecko) Chrome/18.0.1025.151 Safari/535.19
Mozilla/5.0 (Linux; Android 4.0.4; Galaxy Nexus Build/IMM76B)
	    AppleWebKit/535.19 (KHTML, like Gecko) Chrome/18.0.1025.133
	    Mobile Safari/535.19
Mozilla/5.0 (iPhone; U; CPU iPhone OS 5_1_1 like Mac OS X; en)
	    AppleWebKit/534.46.0 (KHTML, like Gecko) CriOS/19.0.1084.60
	    Mobile/9B206 Safari/7534.48.3

Googlebot:
Mozilla/5.0 (compatible; Googlebot/2.1; +http://www.google.com/bot.html)

Bingbot:
Mozilla/5.0 (compatible; bingbot/2.0; +http://www.bing.com/bingbot.htm)

Baiduspider:
Mozilla/5.0 (compatible; Baiduspider/2.0; +http://www.baidu.com/search/
spider.html)
The User-Agent strings in Example 18-7 follow a basic structure
that is derived from the original RFC 2616 specification along with
various detritus from the browser wars. These attributes are broken
down as follows:
-
An initial tag, usually
Mozilla/4.0or higher. The use of Mozilla as the default string is a relic of the browser wars. Suffice it to say that almost every browser automatically masquerades as Mozilla. -
A set of values in parentheses that will tell you what the browser really is. These values vary based on the browser make and configuration, but usually contain the actual browser name, the OS, and a number of optional parameters.
-
Following the parentheses (usually) is a tag naming the layout engine for the software; the layout engine is the browser’s toolkit for rendering HTML, and the same engine can be used by multiple browsers. Common engines include Gecko (used by Firefox, Mozilla, and SeaMonkey), WebKit (used by Safari and Chrome), Presto (Opera), and Trident (IE).
As Example 18-7 shows, the actual composition of the string is very much a function of the browser, the OS, and the idiosyncratic whims of the implementer.
Further Reading
-
M. Collins and M. Reiter, “Finding Peer-to-Peer File Sharing Using Coarse Network Behaviors,” Proceedings of the 2007 ESORICS Conference, Hamburg, Germany, 2007.
-
H. Inoue et al., “NetADHICT: A Tool for Understanding Network Traffic,” Proceedings of the 2007 Large Installation System Administration Conference (LISA), Dallas, TX, 2007.
-
Michael Zalewski’s p0f.