
Perhaps you’ve seen a sign in your local automobile repair shop that asks, "What do you want: good, fast, or cheap? Pick two." People often attempt to apply this classic "iron triangle" of trade-offs to software. But I’ve seen the triangle drawn in many different ways, with different assumptions made about constant project scope or constant quality. Jeffrey Voas (2001) argues that it’s not realistic to expect faster, better, and cheaper software. It is possible to build software faster and cheaper. But it’s not possible to get software faster and better: Software development is a highly creative activity and you can’t accelerate creativity. High-quality deliverables might take a bit longer to initial release, but they save you much time in the long run because you don’t have to do such extensive testing and rework to fix and maintain them. Nor is cheaper and better feasible. Software with stringent quality demands, such as safety-critical systems, is expensive because it’s imperative to remove (or, even better, to prevent) defects.
The trade-offs are real, but the triangle representation is wrong. In fact, a project manager must make trade-offs along five dimensions: features (or scope), quality, staff, cost, and schedule (Wiegers 1996). Some people add the additional dimension of risk. Each dimension fits in one of three categories:
Constraints impose boundaries and restrictions within which the team must operate. For constraints, state the immovable limit.
Drivers identify key project success goals. Drivers afford the project manager a bit of latitude, and they define important targets toward which the team must work.
Degrees of freedom are factors the project manager can adjust within certain limits. For degrees of freedom, identify the allowable range within which the project manager must operate.
It’s important to classify the five project dimensions into these three categories early in your project. The project charter includes a section for constraints, where you can identify which dimensions are constraints, drivers, and degrees of freedom, as well as describing the latitude available to the project manager in each dimension.
A visual way to represent this information is with a flexibility diagram, illustrated in Figure 4-2 (Wiegers 1996). A flexibility diagram is a Kiviat diagram (also known as a spider chart or radar chart), in which the five normalized axes extend radially from a center point. A point is plotted for each dimension on a scale from 0 (a constraint) to 10 (complete flexibility). Figure 4-2 illustrates a flexibility diagram for a hypothetical commercial software package. The point plotted at zero on the schedule axis indicates that schedule is a constraint. Staff and features are drivers with low amounts of flexibility. Cost and quality are degrees of freedom that offer more flexibility for the project manager. Connecting the points on all five axes creates an irregularly shaped pentagon. Jim Highsmith describes a similar "trade-off matrix" to represent which project dimensions are fixed (constraints), flexible (drivers), or can be adjusted (degrees of freedom) (Highsmith 2004).
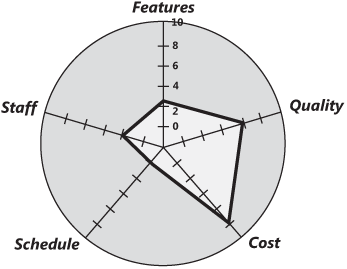
The flexibility diagram is a qualitative tool intended to help the key stakeholders discuss project constraints and success drivers. Don’t try to integrate the area of the pentagon or perform similar rigorous analyses. However, the smaller the pentagon, the more constrained the project is and the lower the chance of it being fully successful.
Note
Overconstrained projects that don’t give the project manager enough flexibility to adjust to changing conditions. The default outcomes are unpaid overtime and quality shortcomings.
Managers often think of schedule as being a constraint when it’s really a driver. To tell the difference, consider the consequences of shipping late. If it would mean paying a contractual penalty or losing a unique market window forever, then schedule truly is a constraint. One early e-commerce project delivered a set of Christmas-themed baskets bundled with a digital camera and special software. Had those baskets and the associated Web site not been available in time for Christmas, the project would have been a complete failure. Schedule really was a constraint in this case. Schedule is a driver when there is a strong business reason to ship by a specific date but catastrophe doesn’t strike if the release is delayed by a few weeks.
With an understanding of a project’s drivers and constraints, the project manager can make appropriate trade-off decisions. For example, maybe your project has sufficient funding but a hiring freeze is in place. Perhaps you can hire contractors, outsource some work, or buy some automation tools. Every trade-off comes with a price tag, though:
Adding more people is costly and doesn’t shorten the schedule proportionately (Brooks 1995).
Increasing scope can degrade quality if the schedule isn’t extended.
Stringent quality demands increase the development and testing effort needed.
Attempting to reduce cost by skimping on requirements development or product design increases long-term costs and actually delays releasing an acceptable product.
There’s more bad news: Not all project dimensions can be constraints. Project managers must have some latitude to react to schedule slips, scope growth, staff turnover, and other eventualities. A successful manager adjusts the degrees of freedom so as to let the team achieve the project’s success criteria—its drivers—within the limits imposed by the constraints.