
Appendix A
KNIME and the Landscape of Tools for Business Analytics and Data Science
Because of the tremendous growth in the popularity of business analytics and data science that we have been experiencing in recent years (both in academia and industry), the landscape of tools used to implement for these technologies are also evolving and expanding at an unprecedented pace. As shown in Chapter 2, Figure 2.4, there already are numerous software tools, ranging from commercial/paid to free/open-source, from graphical workflow-type to language-based programming platforms. Some of these tools are cloud-based, some are individual local installations, and yet, some are both—providing local tools and complementary cloud-based platforms for computational enhanced efficiency and ease of model deployment. Some of these tools may be better at data preprocessing and/or flexible and powerful model building, while others may be superior in terms of ease of learning, use and deployment. As evidenced from the continually expending landscape of tool offerings, there is no one tool that is best at everything. Most business analytics and data science professionals tend to use a portfolio of tools and programming languages collectively to produce the best possible outcomes for their data analytics projects.
The success of data scientists at work depends largely on the tool they rely on. The mathematical and statistical knowledge of the underlying algorithms, the experience with the most effective analytics platforms, the domain knowledge/wisdom, team/people management skill, are all expected, important, necessary components for a superior data scientist and a successful data science project. However, there are other more contingent and complementary factors that also influence the final success and the impression left by the data science project on the stakeholders.
Clearly, every project has a deadline to comply, a list of requirements to meet, and a budget to operate within. Most data mining projects are so designed so stringently that it does not leave much room for sandboxing or an extended trial-and-error approach. Data scientist is expected to identify and implement a solution in a short time while making sure that it is correctly implemented—it meets the requirements of the project. To do so, he/she may need to quickly experiment with different techniques to identify and adopt the best possible roadmap and repeated mechanisms for the project. Of course, every project has a budget too. The fast implementation of the right solution is often additionally constrained by a limited budget.
Some projects are quite complex and require specialized algorithms beyond just the classic general machine learning algorithms. Sometimes, data scientists are forced to learn new techniques and new algorithms – that are required by the specific project – on the spot, and given the deadline, the learning curve must develop within a very short time. In this case, the more time data scientist has to dedicate to theory and math, the faster the learning will proceed.
Finally, the passage from prototype to production must be as fast (again) and as secure as possible. Data scientist cannot degrade the parts of the solution while moving it into production or take the risk of exposing it to less secure execution, considering that the solution will be consumed by a different set of less expert users. If and when required, a different set of solutions, with more or less degrees of interactions and sophistication levels, with mode secure framework, can and should be made available for the consumption of the larger public.
As can be deduced, many other contingent factors, such as ease of learning, speed of prototype implementation, debugging and testing options to ensure the correctness of the solution, flexibility to experiment with different approaches, availability of help from external contributors and experts, and finally automation and security capabilities, contribute to the success of the data science project, beyond the math, the experience, and the domain knowledge. All of these contingent factors depend heavily on the tool and the data science platform the data scientists choose are use.
I have used many of the analytics platforms, commercial and free/open-source for educational (teaching business analytics data science courses at every level, undergraduate, masters, doctoral, and executive education) and commercial (consulting to for-profit companies, non-profit organization, as well as government agencies) purposes in over thirty years of my experience in the field. Although I still use a variety of analytics tools and data science platforms, for over six years now, I have been using KNIME as my primary analytics platform. With KNIME, I have been able to create and deploy data science solutions for complex problems that resulted value creating outcomes for my clients, high-impact publication in reputable journal publication, and ease case studies for my textbooks. One particular feature of KNIME that makes it very attractive for me is its open and expandable architecture that enables me to incorporate the capabilities of popular data science tools like Pyhon, R, Spark, H2O, etc. into the workflow in a seamless manner. What follows are a few of the main criteria that makes the case for the use of KNIME as an analytics platform.
Project Constraints: Time and Money
KNIME Analytics Platform is an open-source software for all your data needs. It is free to download from the KNIME web site (http://www.knime.com/downloads) and free to use, not only for learning and education, but for everything, including commercial use. It is the full version of the software (not a restricted community version), that covers a rich collection of data wrangling and machine learning techniques, and is based on visual programming.
The implications of being open source and free to use are self-explanatory, reducing the licensing legal headaches and the impact on the project budget. The impact of visual programming (using a workflow-type graphical user interface) might require a few more words of explanation. Visual programming has become quite popular in recent times and it aims at substituting, partially or completely, the coding practice. In visual programming, a Graphical User Interface (GUI) guides you through all necessary steps to build a pipeline (workflow) of dedicated blocks (nodes). Each node implements a given task; each workflow of nodes takes your data from the beginning till the end of the designed journey. A workflow substitutes a script; a node substitutes one or more script lines.
In KNIME Analytics Platform, nodes are created by drag-and-drop (or double-click) from the Node Repository into the workflow editor in the central part of the KNIME workbench. Node after node, in a logical order, the pipeline is quickly built, configured, executed, inspected, and documented. See a screen shot of the KNIME Analytics Platform graphical user interface in Figure A.1.
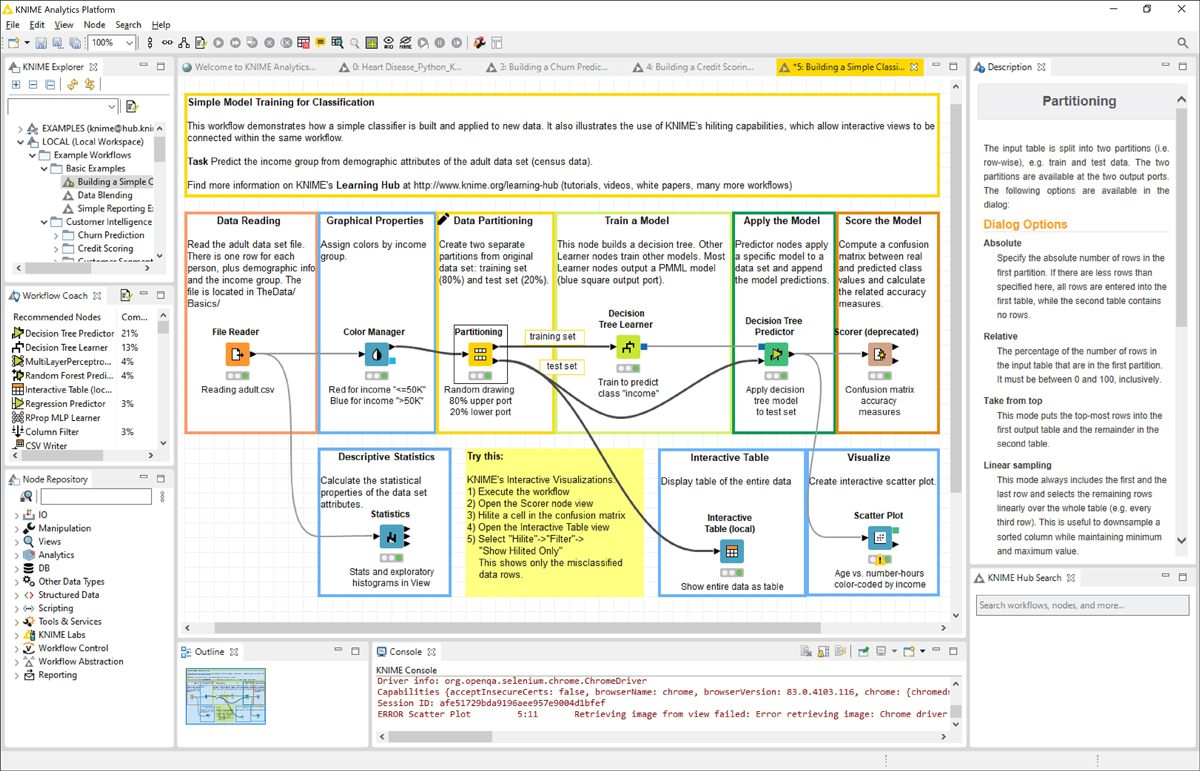
Figure A.1 KNIME Analytics Platform. From the top left corner: KNIME Explorer to store the workflows, Workflow Coach for recommendations, Node Repository as the node storage, Outline for the overview, Console for the errors, and Description to learn more. In the middle the workflow editor to assemble the workflow.
Visual programming is a key feature of KNIME Analytics Platform for quick prototyping, as well as ease of explaining and understanding the underlying logic of the project. It makes the tool very easy to learn and use by less-expert consumers of business analytics. Producing a few different experimental prototypes, before deciding the final direction of the project, is fast and quite straightforward. The ease of implementation frees up time to think deeper of possible theoretical alternatives to the current solution. I, as an instructor, like the fact that it makes my job easier to explain the complete process of converting data into actionable insight on a logical/orderly fashion with the help of an intuitive graphical workflow.
The Learning Curve
Visual Programming also makes the learning curve much faster than code-based tools. Data Science is now used in more or less all disciplines, including the humanities, languages, life sciences, economics, social sciences, engineering, and the rest of the other unsusceptible areas of the human wisdom. Not all scientists (or managers/decision-makers) are expert programmers and not all of them have enough spare time to become expert programmers. A GUI-based visual tool can be learned and applied in much less time than a code-based tool, freeing up again precious time and resources for more important investigations, conceptualizations, and problem solving.
Also, when preparing to become future scientists in the humanities, languages, life sciences, economics, or other disciplines, a GUI-based tool might free up more time to study and research the underlying concepts and theories. The idea is to shorten the time spent on syntactic details of programming in order to spend more quality time on the semantics of model building and problem solving. I have seen too often entire months dedicated to learning the syntactic nature of the coding practices, before even approaching and implementing any data analysis technique. With KNIME Analytics Platform, in just a few weeks, you can assemble quite capable workflows for data transformation and for the training and testing of a wide variety of machine learning algorithms. That said, for uniquely complex and novel projects, data scientist may need to incorporate some unique and advanced functionalities that only exists in analytics programming languages, like Python and R, into the model building and problem-solving process. Having built on an open and extendable architecture, KNIME Analytics Platform also allows for those type of extensions through a selection of scripting and wrapper nodes.
Plenty of educational resources about KNIME Analytics Platform are available over the Internet (and especially on the KNIME site, of course) to help with speeding up the learning curve even further. Starting from the generic LEARNING page (https://www.knime.com/resources) on the KNIME site, one can move onto courses with an instructor (https://www.knime.com/learning/events) or completely self-taught courses (https://www.knime.com/knime-introductory-course), all leading to a possible certification for the platform. You can also decide to learn by yourself with just the help of a book, like this one.
Another massive help for beginners comes from the KNIME Hub (https://hub.knime.com/). With the KNIME Hub, the creators of the platform have expanded the already existing set of resource for KNIME Analytics Platform within the KNIME Community.
The KNIME Community
The KNIME Hub is the public repository for the KNIME community. Here, you can share your workflows and download workflows by other KNIME users. Just type in the keywords and you will get a list of related workflows, components, extensions, and more. It is a great place to start with plenty of examples! For example, just type in the search box “basic” or “beginners” and you will get a list of example workflows illustrating basic concepts in KNIME Analytics Platform; type in “read file” and you will get a list of example workflows illustrating how to read CSV files, .table files, excel files, etc … Notice that a subset of these example workflows is also reported in the EXAMPLES server in the KNIME Explorer panel on the top left corner of the KNIME workbench.
Once you isolate the workflow you might be interested in, click on it to open its page, and then download it or open it on your own KNIME Analytics Platform. Once in the local workspace, you can start adapting it to your data and your needs. Following the popular fashionable trend in programming, that is searching for ready to use pieces of code, you can just download, reuse, and readapt workflows or pieces of workflows from the KNIME Hub to your own problem.
Of course, you can also share your own work on the KNIME Hub for the public good. Just copy the workflows to share from your local workspace into the My-KNIME-Hub/Public folder in the KNIME Explorer panel within the KNIME workbench (see Figure A.2).

Figure A.2 Resulting list of workflows from search “read file” on the KNIME Hub
The KNIME community does not stop at the KNIME Hub. It is indeed very active with tips and tricks on the KNIME Forum (https://forum.knime.com/) as well. Here, you can ask questions or search for previous answers. The community is very active, and it is highly likely that somebody has already asked your question.
Finally, contributions by the community are available as posts on the KNIME Blog (https://www.knime.com/blog), as books in the KNIME Press (https://www.knime.com/knimepress), as videos on the KNIME TV (https://www.youtube.com/user/KNIMETV) channel on YouTube.
Correctness and Flexibility
Easy is good, but can also I ensure it is correct? Is it flexible enough to experiment with alternative methods and procedures? This is indeed a key question, because for many of the software tools available nowadays “easy” comes with the tradeoff of “control” for correctness and of “flexibility” for alternative options, often manifests as a canned, black-box type solution that dictates “trust me, I know what I am doing”. For data scientist, these types of magical solutions have always been questionable—they want to have the full control of the semi-experimental process and its underlying options towards finding the most “optimal” solutions.
Automated Machine Learning (also called AutoML or AML in short) has become very popular in recent times. It carries the promise to get your data, spit out some results, without you even lifting a finger. As fascinating as this option might sound, together with the promise it also carries some risk. First of all, it works as a black-box. Its decision process is not transparent. When I feed the box with my data I have to completely trust the machine that the data analysis process is correct, fits the data characteristics and distributions, and is tuned on the problem I wish to solve. It is probably a trusting exercise, like in these psychology support meetings. I, personally, prefer to make sure that all steps in the analysis are implemented as per the best practices, under my control, according to the original design of the application. Although AutoML is a desired final stage in data science, because of the artistic nature of the solution development, it is still a work in progress, a eutopia, and for real data scientist, nothing more than an early experimental step in piloting.
When executing a node in KNIME Analytics Platform, one can always inspect the node options and output results (with a right-click and then selecting the last option in the context menu) for debugging and validating the application step by step and make sure that all steps work as required by design. Second, the world is never perfect/ideal, and neither are the data that comes out of it. Automated analysis might work well on perfect data, with no unbalanced classes, no outliers, no dirty records, etc. Perfect data only come in toy datasets. In real life, there are always adjustments to make for the unbalanced classes, for the dirty data, for the missing values, for the outliers and inconsistencies, and so on. Adding one cleaning step or another, introducing an optimization cycle on a parameter or on another might change the final results of the workflow. In order to experiment with new strategies, it is imperative that the tool is flexible and customizable enough at each step of the analysis. A black-box automated approach does not allow for much flexibility, does not allow to change intermediate steps in the analysis, to customize features, or to tune parameters. KNIME Analytics Platform on the other hand is very modular and, with an extensive coverage of data wrangling operations and machine learning algorithms, it allows for ample flexibility (flexible enough to exchange one data manipulation node with another with a simple drag-and-drop, introduce an optimization loop on the fly, or systematically and easily change/optimize the value of a parameter in the training of a specific machine learning model.
One small note, before digging deeper into the “extensive coverage of data wrangling operations and machine learning algorithms”. If you open an old workflow, i.e., a workflow developed with previous older versions of KNIME Analytics Platform, you will probably find “deprecated” or “legacy” nodes. These nodes are discouraged from current usage, since probably better newer nodes have been developed in the meantime. However, deprecated and legacy nodes, they do still exist, and they do still work. Indeed, back-compatibility with previous versions is a key and highly desired feature of analytics platforms like KNIME. Only ensuring that old workflows still work exactly in the same way as they were designed, can guarantee the reproducibility of the results. As all of you know, this is an extremely important argument for the validation of results in scientific research.
Extensive Coverage of Data Science Techniques
Another necessary complement to the ease of use is the coverage of data science techniques. Without an extensive coverage of the commonly and less commonly used data wrangling techniques, machine learning algorithms, wide range of data types and formats, and lack of integration with the most commonly used database software and data sources, reporting tools, other scripting and languages, ease of use would be of limited convenience. A capable analytics platform is expected to keep up with the latest trends and technologies through native implementations and/or seamless external connections. Since no tool can do it all, all the time, integrating with and playing nice with other tools and technologies in the fast-evolving business analytics data science landscape is not just a “nice to have capability” but is a requirement for a comprehensive analytics platform.
Let’s start from the machine learning algorithms. KNIME Analytics Platform covers most machine learning algorithms—from traditional ones (e.g., linear and logistic regression, decision trees, neural networks, support vector machines, naïve Bayes, k-nearest neighbour) to more recent ensembles (e.g., random forest, gradient boosted trees) and deep learning algorithms, from recommendation engines to a number of clustering techniques. Most of these algorithms are native of KNIME Analytics Platform, and some are integrated from other open source libraries through scripting nodes. One specific example is the deep learning capabilities, where layers, units, and pre-configured architectures are made available through the KNIME Deep Learning-Keras integration (https://www.knime.com/deeplearning/keras). This integration allows for the ease of use of the Keras libraries within KNIME Analytics Platform by offering them to the end users via the familiar KNIME graphical workflow-type user interface. In this way, it is possible to drag-and-drop nodes to create neurons’ layers for complex deep neural network architectures and train and test the final network without the necessarily of writing a single line of code. Figure A.3 shows a snapshot of the machine learning techniques included in KNIME.
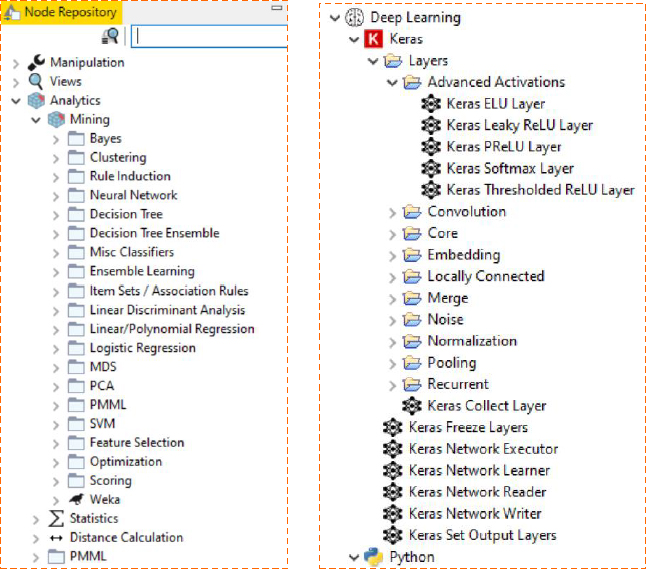
Figure A.3 The Mining category in the Node Repository holding the machine learning algorithms.
A large number of nodes is also available to implement a myriad of Data Wrangling techniques. By logically connecting and combining individual nodes dedicated to small/atomic data processing tasks, you can implement very complex data preprocessing and transformation operations. The assembling of such operations is so easy that KNIMS is often used for data preparation for other tools, for example to generate a consolidated dataset for Excel, or the data for creating reports in Tableau or PowerBI, or to create summarized and synthesized data to be pushed into a data warehouse.
KNIME Analytics Platform also connects to most of the commonly used data sources: from databases to cloud repositories, from big data platforms to individual flat files. So, no worries about the nature of your input data; no matter how weird your data source and your data types may be, it is quite likely that you can connect to them and consume them from within KNIME Analytics Platform.
What if all that is not enough? What if I need a specific procedure for DNA analysis or molecule conversion? What if I need a specific network manipulation function from Python? What if I need to export my results into a highly specialized Web report? Where KNIME Analytics Platform cannot reach with its native nodes, there usually is at least one, often more, third party extension from the KNIME community providing the missing functionality for that particular domain specifications and the related data type. Furthermore, where KNIME Analytics Platform and its extensions cannot reach, there are also the integrations with other scripting and programming languages, such as Python, R, Java, and JavaScript, to consume additional functionality of other libraries and community resources.
KNIME Analytics Platform has a seamless integration with the BIRT Reporting tool. Since this is also open source, its integration fits well with the KNIME Analytics Platform’s philosophy. Integrations with other reporting platforms like Tableau, QlickView, PowerBI, and Spotfire are also available. However, in those cases, you would need to buy the necessary license and install the destination reporting software.
In most cases, it turns out that it is not even necessary to move to an external reporting software tool to visualize your data and your analysis results. A number of Javascript based nodes are already available within KNIME, in the Views/Javascript category in the Node Repository. These nodes implement data visualization using a variety of plots and charts: from a simple scatter plot to a more complex sunburst chart, from a simple histogram to a parallel coordinate plot, and more. These nodes seem simple but are potentially quite powerful. If you combine them within a component (an integrated modeling construct in KNIME), interactive selection of data points across multiple charts can automatically be enabled. The component thus inherits and combines all views from the contained nodes and connects them together in a way that, if points are selected and visualized in one chart, they can also be selected and visualized in the other charts of the component’s composite view (see the example given in Figure A.4).
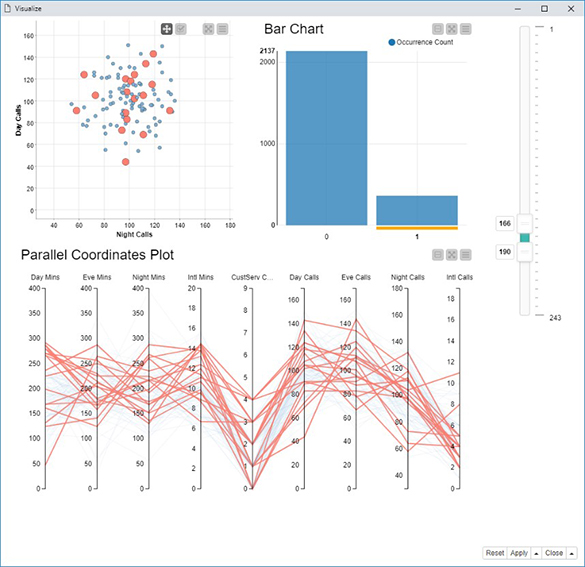
Figure A.4 The composite view from a component containing a scatter plot, a bar chart, and a parallel coordinate plot. The three plots visualize the same data and are connected in a way that, selecting data in the bar chart, selects and optionally visualizes only the selected data in the other two charts.
Data Science in the Enterprise
One last step is to deploy the outputs of the modeling efforts into production so that the insight generated by these models can be consumed for better and faster decision making. In case of an enterprise, this deployment must be quick, easy/intuitive, seamless, and secure. This is the last and perhaps the most critical step in the chain of actions in a data science project. When the workflow is finished (the model is trained, tested, and the performance is measured), we need to push the application out into the real world to deal with real-life data to provide value to the intended userbase. This process of moving the application into the real-world is called moving into production. The process of including the model into this final application is called deployment. Both phases are deeply connected and can be quite problematic since all errors in the application design can and will show up at this stage.
It is possible, though limited, to move an application into production using KNIME Analytics Platform. If you, as a lone data scientist or a data science student, do not regularly deploy applications and models, KNIME Analytics Platform is probably enough for your needs. However, if you are just a bit more in an enterprise kind of environment, where scheduling, versioning, access rights, and all other typical functions of a production server are needed, then just using KNIME Analytics Platform for production can be cumbersome, and may not produce sufficient value to the enterprise. In this case, the KNIME Server, which is not open source but sold for an annual license fee, can make your life easier, much easier. First, this server-based deployment fits better with the governance of the enterprise’s IT environment. Then, it offers a collaboration protected environment for your group and the whole data science lab. And of course, its main advantage consists of making the model deployment and the moving into production easier, faster, and safer, which can be done in KNIME by using the integrated deployment feature and the one-click deployment into production. End users would then run the application from a KNIME Analytics Platform client, or even better, from a web-based application from within a browser.
The composite views mentioned before, which offer interactive and interconnected views of selected points, become fully formed Web pages and easy to use applications when the solution is executed on a web browser via the KNIME Server’s WebPortal. By using the components as touchpoints within the workflow, we get a guided analytics (https://www.knime.com/knime-introductory-course/chapter1/section4/guided-analytics) application within the Web browser. Guided analytics inserts touchpoints for the end user to consume within the flow of the application on a Web browser. The end user can take advantage of these touchpoints to insert knowledge or preferences and to steer the analysis in the desired direction.
Summary and Conclusions
With the brief introduction in this appendixes, I hope that I have convinced you to give KIME a try, and see yourself why KNIME Analytics Platform is an excellent choice as a business analytics and data science tool to support you in your future endeavours as a data scientist.
Just remember the ease of use that will save you time and allow you to dedicate more of your brain and energy to more important research topics than just programming. Recall the open source choice for the software, along with the no-cost and the community support that comes with it. The community help is especially useful for tips and tricks, for example workflows, for new nodes and extensions, and for smart advices.
Remember the debugging capability to check for the correctness of the implemented operations and remember the atomic tasks for all nodes as to allow to experiment easily with different analysis strategies. The easy prototyping is indeed one of the best features of KNIME Analytics Platform, allowing a quick evaluation and experimentation of new techniques.
The large coverage of machine learning algorithms, data wrangling techniques, and accessible data sources make KNIME Analytics Platform a very reliable tool yet easy to use. If the native nodes and extensions are not enough, community extensions, integrations with other scripting and programming languages, and integration with reporting tools can make up for the missing domain specific functionalities.
Finally, the usage of the KNIME Server as the complement to KNIME Analytics Platform for the enterprise allows for easy and secure deployment and seamless integration in the company IT environment.
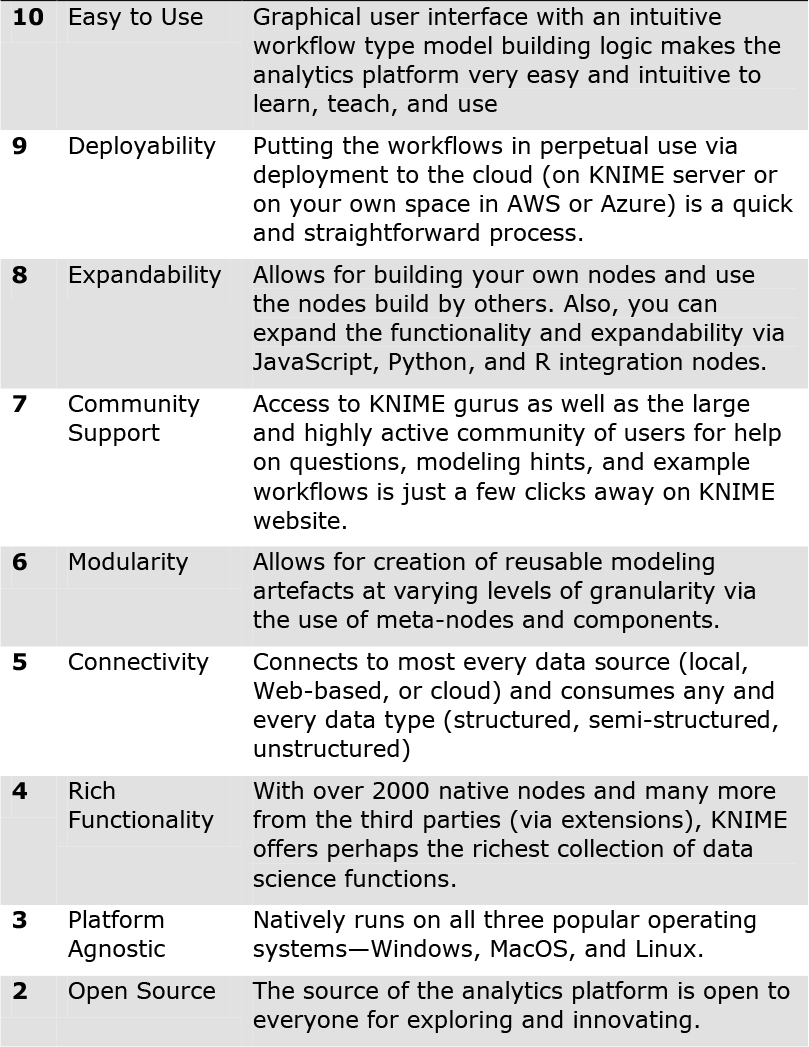
In Table A.1, I try to summarize the most prevailing reasons for you to consider KNIME Analytics Platform as a potential tool for your data science learning, teaching, and execution, using a top-10 list analogy. Give a try to KNIME Analytics Platform! Coming from someone who have spent more than thirty years in teaching and executing projects in the business analytic and data science, you have nothing to lose, but perhaps much to gain. Happy KNIMEing!
Table A.1. The Top 10 List for “Why Should You Consider KNIME?”

Summary
Successful business analytics and data science project requires a multitude of software tools and programming languages used collectively and synergistically. Although Python seem to be the most popular analytics tool (programming language), over 90% of the real-world project uses more than one tool. KNIME is a relatively new and rapidly emerging analytics platform. KNIME has several exciting features that differentiates it from the rest. Not only it is free/open-source, visual, easy to learn and use type of tool, but it also has a very active community support, and because of its open architecture, it plays well with other analytics platforms and languages (e.g., Python, R, H2O., Tableau, PowerBI, among others). All it takes is a serios try; more than likely, you will like it, and perhaps you will fall in love with it, as I did about 6 years ago.
References
A significant portion of this appendix is created with permission based on a blog post written by Ms. Rosaria Silipo (https://medium.com/swlh/why-knime-98c835afc186), who is a principal data scientist and the team leader for the educational and evangelical activities at KNIME.