Chapter 1
Introduction to Predictive Analytics
Predictive analytics, the main title of this book, is a vital part of the business analytics continuum. The chief goal of predictive analytics, as the word “predictive” in the title indicates, is to foresee the future events and situations, and thereby, help decision makers to take advantage of the upcoming opportunities in a timely manner or to prevent (or at least mitigate the impact of) the problems that are about to surface. As we will discuss in more detail in the later sections of this chapter, within the business analytics continuum, predictive analytics is strategically positioned between descriptive analytics (which is primarily focused on what happened) and prescriptive analytics (which is focused on what decision should be made) to leverage/consume what descriptive analytics generates (i.e., historical snapshot of information/patterns) in order to produce what is most likely to happen in the future as its output (i.e., predictions/forecasts) and feeds them into the prescriptive analytics as one of its key enablers/inputs for it to create insight for optimal decisions.
Compared to business intelligence, Business analytics is a newer term that is gaining popularity in the business world like nothing else in recent history. In general terms, analytics is the art and science of discovering insight by using sophisticated mathematical models along with a variety of data and expert knowledge to support accurate and timely decision making. In a sense, analytics is all about decision making and problem solving. Nowadays, analytics can be defined as simply as “the discovery of information/knowledge/insight in data.” In this era of abundant data, some goes to the extent of calling it the data deluge, analytics tends to be used to sift through rather large volumes and varieties of data.
Although analytics tends to be data focused, many applications of analytics involve very little or no data; instead, those analytics projects use mathematical and symbolic models that rely on process description and expert knowledge (e.g., optimization and simulation models, expert systems, case-based decision analysis, etc.). Therefore, in order to make sure that an analytics application is data driven, a newer more specific name, data analytics, is coined.
Business analytics is the application of the tools, techniques, and principles of analytics to complex business problems. Organizations commonly apply analytics to business problems (often in a data rich domains) to describe, predict, and optimize business performance. Firms have used analytics in many ways, including the following:
• To improve their relationships with their customers (encompassing all phases of customer relationship management—acquisition, retention, and enrichment), suppliers, employees, and other stakeholders
• To identify fraudulent transactions and undesirable behaviors/outcomes, and by doing so, saving money and improving outcomes
• To enhance product and service features and their pricing, which would lead to better customer satisfaction, loyalty driven marketplace position, and better profitability
• To optimize marketing and advertising campaigns so that the firm can reach more customers with the right kind of message and promotions with the least amount of expense
• To minimize operational costs by optimally managing inventories and allocating resources wherever and whenever they are needed by using optimization and simulation modeling
• To empower employees with the information and insight they need to make faster and better decisions while they are working with customers or customer-related issues
The term analytics, perhaps because of its rapidly increasing popularity as a buzzword, is being used to replace several previously popular terms, such as intelligence, mining, and discovery. For example, the term business intelligence has now become business analytics; customer intelligence has become customer analytics, Web mining has become Web analytics, knowledge discovery has become data analytics, etc. While the name analytics has been gaining popularity, several newer terms—including data science, computational intelligence, big data analytics, applied machine learning, to name a few—have emerged to crowd and further complicate the name space. As we will describe in this book, the rapid change in the names is yet another evidence for the expeditious developments and amplified interests in the analytics’ value proposition.
What is in the name? Because of the rapidly changing name space (some calls it the relentless creation of buzzwords), the true understanding of the underlying phenomenon (differences and similarities among these names) warrants some delineation. Among the terms that are most often confused with each other, and characterized at the highest level of conceptualization, are business intelligence, business analytics, and data science. In addition to these top terms, there also are terms like bog data, machine learning, internet of things (IoT), natural language processing, among other, included in the mix. As an attempt to project some order to the underlying complexity of these terms, we created a rather simple Venn diagram, as shown in Figure 1.1. The top portion of the figure shows the interrelationships among the most popular terms. As shown in the figure, business intelligence is portrayed as a wholly consumed sub-component of business analytics (i.e., the descriptive analytics phase in business analytics) while business analytics is portrayed as a partially consumed sub-component of data science. The reason for partial consumption between business analytics and data science is the fact that business analytics also rely of solutions that does not require data, instead they are driven from the representation and consumption of the business processes and expert knowledge.

Figure 1.1 Overlaps among the popular concepts and terms in analytics and data science
The other terms—big data, machine learning, natural language processing, internet of things—are shown at the bottom portion of Figure 1.1 to portray the enablers and/or mechanisms for the key three terms shown at the top of the figure. Although, big data is sometimes being used to refer to the big data analytics, its rightful characterization stems from the volume, variety and velocity of data that enhances the capabilities of business analytics and data science to new level of rightness and comprehensiveness. While business intelligence deals with structured data (stored in databases and Excel sheets in the form of rows and columns), business analytics and data science deals with both structured and unstructured data. The variety characteristics of big data can be defined by not only with structures data but also unstructured data, which is often composed of textual, multimedia, and IoT data, brings the value (and some challenges) to the world of analytics and data science.
Among all of these terms, the two that are often used synonymously and interchangeable are business analytic and data science. Are they the same? If so, why do we have two different names for the same concept? From the standpoint of purpose, these two terms are the same, both aiming to convert data into actionable insight through an algorithm-based discovery process. The differences are usually observed at the scope dimension. Similar to the scope enlargement we have witnessed moving from business intelligence to business analytics, we are now experiencing yet another scope enhancement moving from business analytics to data science. While business analytics adds predictive and prescriptive modeling on top of business intelligence, data science adds big data enablers, low-level programming (e.g., Python, R, SQL/NoSQL, JavaScript, Perl), and advanced machine learning (i.e., deep learning and its variates) on top of business analytics. Another difference between the two could be observed on their application domain and the tools employed; while business analytics deals with business problem using workflow-type tools and readily available algorithms, data science deals with broader range of problems using low-level programming and enhanced algorithm, and custom solution development processes.
Another difference between business analytics and data science can be observed in higher education. While business schools usually offering certificate and graduate/undergraduate degree programs named business analytics, computer science, decision sciences, and industrial engineering schools are offering similar programs under the name of data science. A quick look at these curriculums reveals that while business analytics programs are more applied, problem solving, and high-level methodology focused, data science programs are more programming, algorithm development, and low-level method focused. While these observations are generally true, they are not universally applicable, standardized, or practiced.
Modern-day analytics and data science projects often require extensive computations because of the volume, variety, and velocity of data and the need to produce results as quickly as possible. Therefore, the tools, techniques, and algorithms used for analytics and data science must leverage the most advanced, state-of-the-art software and hardware alongside of the latest methods developed in a variety of fields, including management science, computer science, statistics, and mathematics.
• Is there a difference between analytics and analysis?
Even though the two terms analytics and analysis are often used interchangeably, they are not the same.
Basically, analysis refers to the process of separating a whole problem into its parts so that the parts can be critically examined at the granular level. It is often used when the investigation of a complete system is not feasible or practical, and the system needs to be simplified by being decomposed into more basic components. Once the improvements at the granular level are realized and the examination of the parts is complete, the whole system (either a conceptual or physical system) can then be put together using a process called synthesis.
Analytics, on the other hand, is a variety of methods, technologies, and associated tools for creating new knowledge/insight to solve complex problems and make better and faster decisions. In essence, analytics is a multifaceted and multidisciplinary approach to addressing complex situations. Analytics take advantage of data and mathematical models to make sense of the complicated world we are living in. Even though analytics includes the act of analysis at different stages of the discovery process, it is not just analysis but also includes synthesis and other complementing tasks and processes.
• Where does data mining fit in?
Data mining is the process of discovering new knowledge in the forms of patterns and relationships in large data sets. The goal of analytics is to convert data/facts into actionable insight, and data mining is the key enabler of that goal. Data mining has been around much longer than analytics, the origin of which is dating back to 1980s. As analytics became an overarching term for all decision support and problem-solving methods and technologies, data mining found itself a rather broaden space within that arc, ranging from descriptive exploration of identifying relationships and affinities among variables (e.g., market-basket analysis) to developing models to estimate future values of interesting variables. As we will see later in this chapter, within the taxonomy of analytics, data mining plays a key role at every level, from the most simple to the most sophisticated.
What Are the Reasons for the Sudden Popularity of Analytics and Data Science?
Analytics is a buzzword of business circles today. No matter what business journal or magazine you look at, it is very likely that you will see articles about analytics and how analytics is changing the way managerial decisions are being made. It has become a new label for evidence-based management (i.e., evidence/data-driven decision making). But why has analytics become so popular? And why now? The reasons (or forces) behind this popularity can be grouped into three categories: need, availability and affordability, and culture change.
Need
As we all know, business is anything but “as usual” today. Competition has been characterized progressively as local, then regional, then national, but it is now global. Large to medium to small, every business is under the pressure of global competition. The tariff and transportation cost barriers that sheltered companies in their respective geographic locations are no longer as protective as they once were. In addition to (and perhaps because of) the global competition, customers have become more demanding. They want the highest quality of products and/or services with the lowest prices in the shortest possible time. Success or mere survival depends on businesses being agile and their managers making the best possible decisions in a timely manner to respond to market-driven forces (i.e., rapidly identifying and addressing problems and taking advantage of the opportunities). Therefore, the need for fact-based, better, and faster decisions is more critical now than ever before. In the midst of these unforgiving market conditions, analytics is promising to provide managers the insights they need to make better and faster decisions, which help improve their competitive posture in the marketplace. Analytics today is widely perceived as saving business managers from the complexities of global business practices.
Availability and Affordability
Thanks to recent technological advances and the affordability of software and hardware, organizations are collecting tremendous amounts of data. Automated data collections systems—based on a variety of sensors and RFID—have significantly increased the quantity and quality of organizational data. Coupled with the content-rich data collected from Internet-based technologies such as social media, businesses now tend to have more data than they can handle. As the saying goes, “They are drowning in data but starving for knowledge.”
Along with data collection technologies, data processing technologies have also improved significantly. Today’s machines have numerous processors and very large memory capacities, so they are able to process very large and complex data in a reasonable time frame—often in real time. The advances in both hardware and software technology are also reflected in the pricing, continuously reducing the cost of ownership for such systems. In addition to the ownership model, along came the software- (or hardware-) as-a-service business model, which allows businesses (especially small to medium-size businesses with limited financial power) to rent analytics capabilities and pay only for what they use.
Culture Change
At the organizational level, there has been a shift from old-fashioned intuition-driven decision making to new-age fact-/evidence-based decision making. Most successful organizations have made a conscious effort to shift to data-/evidence-driven business practices. Because of the availability of data and supporting IT infrastructure, such a paradigm shift is taking place faster than many thought it would. As the new generation of quantitatively savvy managers replaces the baby boomers, this evidence-based managerial paradigm shift will intensify.
The Application Areas of Analytics
Even though the business analytics wave is somewhat new, there are numerous applications of analytics, covering almost every aspect of business practice. For instance, in customer relationship management, a wealth of success stories tell of sophisticated models developed to identify new customers, look for up-sell/cross-sell opportunities, and find customers’ with a high propensity toward attrition. Using social media analytics and sentiment analysis, businesses are trying to stay on top of what people are saying about their products/services and brands. Fraud detection, risk mitigation, product pricing, marketing campaign optimization, financial planning, employee retention, talent recruiting, and actuarial estimation are among the many business applications of analytics. It would be very hard to find a business issue where a number of analytics application could not be found. From business reporting to data warehousing, from data mining to optimization analytics, techniques are used widely in almost every facet of business.
The Main Challenges of Analytics
Even though the advantages of and reasons for analytics are evident, many businesses are still hesitant to jump on the analytics bandwagon. These are the main roadblocks to adoption of analytics:
• Analytics talent. Data scientists, the quantitative geniuses who can convert data into actionable insight, are scarce in the market; the really good ones are very hard to find. Because analytics is relatively new, the talent for analytics is still being developed. Many colleges have started undergraduate and graduate programs to address the analytics talent gap. As the popularity of analytics increases, so will the need for people who have the knowledge and skills to convert Big Data into information and knowledge that managers and other decision makers need to tackle real-world complexities.
• Culture. As the saying goes, “Old habits die hard.” Changing from a traditional management style (often characterized by intuition as the basis of making decision) to a contemporary management style (based on data and scientific models for managerial decisions and collective organizational knowledge) is not an easy process to undertake for any organization. People do not like to change. Change means losing what you have learned or mastered in the past and now needing to learn how to do what you do all over again. It suggests that the knowledge (which is also characterized as power) you’ve accumulated over the years will disappear or be partially lost. The culture shift may be the most difficult part of adopting analytics as the new management paradigm.
• Return on investment. Another barrier to adoption of analytics is the difficulty in clearly justifying its return on investment (ROI). Analytics projects are complex and costly endeavors, and their return is not immediately clear, many executives are having a hard time investing in analytics, especially on large scales. Will the value gained from analytics outweigh the investment? If so, when? It is very hard to convert the value of analytics into justifiable numbers. Most of the value gained from analytics is somewhat intangible and holistic. If done properly, analytics could transform an organization, putting it on a new and improved level. A combination of tangible and intangible factors needs to be brought to bear to numerically rationalize investment and movement toward analytics and analytically savvy management practice.
• Data. The media is taking about Big Data in a very positive way, characterizing it as an invaluable asset for better business practices. This is mostly true, especially if the business understands and knows what to do with it. For those who have no clue, Big Data is a big challenge. Big Data is not just big; it is unstructured, and it is arriving at a speed that prohibits traditional collection and processing means. And it is usually messy and dirty. For an organization to succeed in analytics, it needs to have a well-thought-out strategy for handling Big Data so that it can be converted to actionable insight.
• Technology. Even though technology is capable, available, and, to some extent, affordable, technology adoption poses another challenge for traditionally less technical businesses. Although establishing an analytics infrastructure is affordable, it still costs a significant amount of money. Without financial means and/or a clear return on investment, management of some businesses may not be willing to invest in needed technology. For some businesses, an analytics-as-a-service model (which includes both software and the infrastructure/hardware needed to implement analytics) may be less costly and easier to implement.
• Security and privacy. One of the most common criticisms of data and analytics is the security. We often hear about data breaches of sensitive information, and indeed, the only completely secured data infrastructure is isolated and disconnected from all other networks (which goes against the very reason for having data and analytics). The importance of data security has made information assurance one of the most popular concentration areas in information systems departments around the world. At the same time that increasingly sophisticated techniques are being used to protect the information infrastructure, increasingly sophisticated attacks are becoming common. There are also concerns about personal privacy. Use of personal data about customers (existing or prospective), even if it is within legal boundaries, should be avoided or carefully scrutinized to protect an organization against bad publicity and public outcry.
Despite the hurdles in the way, analytics adoption is growing, and analytics is inevitable for today’s enterprises, regardless of size or industry segment. As the complexity in conducting business increases, enterprises are trying to find order in the midst of the chaotic behaviors. The ones that succeed will be the ones fully leveraging the capabilities of analytics.
A Longitudinal View of Analytics
Although the buzz about it is relatively recent, analytics isn’t new. It’s possible to find references to corporate analytics as far back as the 1940s, during the World War II era, when more effective methods were needed to maximize output with limited resources. Many optimization and simulation techniques were developed then. Analytical techniques have been used in business for a very long time. One example is the time and motion studies initiated by Frederick Winslow Taylor in the late 19th century. Then Henry Ford measured pacing of assembly lines, which led to mass-production initiatives. Analytics began to command more attention in the late 1960s, when computers were used in decision support systems. Since then, analytics has evolved with the development of enterprise resource planning (ERP) systems, data warehouses, and a wide variety of other hardware and software tools and applications.
The timeline in Figure 1.2 shows the terminology used to describe analytics since the 1970s. During the early days of analytics, prior to the 1970s, data was often obtained from the domain experts using manual processes (i.e., interviews and surveys) to build mathematical or knowledge-based models to solve constraint optimization problems. The idea was to do the best with limited resources. Such decision support models were typically called operations research (OR). The problems that were too complex to solve optimally (using linear or non-linear mathematical programming techniques) were tackled using heuristic methods such as simulation models.

Figure 1.2 A Longitudinal View of the Evolution of Analytics
In the 1970s, in addition to the mature OR models that were being used in many industries and government systems, a new and exciting line of models had emerged: rule-based expert systems (ESs). These systems promised to capture experts’ knowledge in a format that computers could process (via a collection of if–then rules) so that they could be used for consultation much the same way that one would use domain experts to identify a structured problem and to prescribe the most probable solution. ESs allowed scarce expertise to be made available where and when needed, using an “intelligent” decision support system. During the 1970s, businesses also began to create routine reports to inform decision makers (managers) about what had happened in the previous period (e.g., day, week, month, quarter). Although it was useful to know what had happened in the past, managers needed more than this: They needed a variety of reports at different levels of granularity to better understand and address changing needs and challenges of the business.
The 1980s saw a significant change in the way organizations captured business-related data. The old practice had been to have multiple disjointed information systems tailored to capture transactional data of different organizational units or functions (e.g., accounting, marketing and sales, finance, manufacturing). In the 1980s, these systems were integrated as enterprise-level information systems that we now commonly call ERP systems. The old mostly sequential and nonstandardized data representation schemas were replaced by relational database management (RDBM) systems. These systems made it possible to improve the capture and storage of data, as well as the relationships between organizational data fields while significantly reducing the replication of information. The need for RDBM and ERP system emerged when data integrity and consistency became an issue, significantly hindering the effectiveness of business practices. With ERP, all the data from every corner of the enterprise is collected and integrated into a consistent schema so that every part of the organization has access to the single version of the truth when and where needed. In addition to the emergence of ERP systems—or perhaps because of these systems—business reporting became an on-demand, as-needed business practice. Decision makers could decide when they needed to or wanted to create specialized reports to investigate organizational problems and opportunities.
In the 1990s, the need for more versatile reporting led to the development of executive information systems (decision support systems designed and developed specifically for executives and their decision-making needs). These systems were designed as graphical dashboards and scorecards so that they could serve as visually appealing displays while focusing on the most important factors for decision makers to keep track of—the key performance indicators. In order to make this highly versatile reporting possible while keeping the transactional integrity of the business information systems intact, it was necessary to create a middle data tier—known as a data warehouse (DW)—as a repository to specifically support business reporting and decision making. In a very short time, most large to medium-size businesses adopted data warehousing as their platform for enterprise-wide decision making. The dashboards and scorecards got their data from a data warehouse, and by doing so, they were not hindering the efficiency of the business transaction systems—mostly referred to as enterprise resource planning (ERP) systems.
In the 2000s the DW-driven decision support systems began to be called business intelligence systems. As the amount of longitudinal data accumulated in the DWs increased, so did the capabilities of hardware and software to keep up with the rapidly changing and evolving needs of the decision makers. Because of the globalized competitive marketplace, decision makers needed current information in a very digestible format to address business problems and to take advantage of market opportunities in a timely manner. Because the data in a DW is updated periodically, it does not reflect the latest information. In order to elevate this information latency problem, DW vendors developed a system to update the data more frequently, which led to the terms real-time data warehousing and, more realistically, right-time data warehousing, which differs from the former by adopting a data refreshing policy based on the needed freshness of the data items (i.e., not all data items need to be refreshed in real time). Data warehouses are very large and feature rich, and it became necessary to “mine” the corporate data to “discover” new and useful knowledge nuggets to improve business processes and practices—hence the terms data mining and text mining. With the increasing volumes and varieties of data, the needs for more storage and more processing power emerged. While large corporations had the means to tackle this problem, small to medium-size companies needed financially more manageable business models. This need led to service-oriented architecture and software and infrastructure-as-a-service analytics business models. Smaller companies therefore gained access to analytics capabilities on an as-needed basis and paid only for what they used, as opposed to investing in financially prohibitive hardware and software resources.
In the 2010s we are seeing yet another paradigm shift in the way that data is captured and used. Largely because of the widespread use of the Internet, new data-generation mediums have emerged. Of all the new data sources (e.g., RFID tags, digital energy meters, clickstream Web logs, smart home devices, wearable health monitoring equipment), perhaps the most interesting and challenging is social networking/social media. This unstructured data is rich in information content, but analysis of such data sources poses significant challenges to computational systems, from both software and hardware perspectives. Recently, the term Big Data has been coined to highlight the challenges that these new data streams have brought upon us. Many advancements in both hardware (e.g., massively parallel processing with very large computational memory and highly parallel multiprocessor computing systems) and software/algorithms (e.g., Hadoop with MapReduce and NoSQL) have been developed to address the challenges of Big Data.
It’s hard to predict what the next decade will bring and what the new analytics-related terms will be. The time between new paradigm shifts in information systems and particularly in analytics has been shrinking, and this trend will continue for the foreseeable future. Even though analytics is not new, the explosion in its popularity is very new. Thanks to the recent explosion in Big Data, ways to collect and store this data, and intuitive software tools, data and data-driven insight are more accessible to business professionals than ever before. Therefore, in the midst of global competition, there is a huge opportunity to make better managerial decisions by using data and analytics to increase revenue while decreasing costs by building better products, improving customer experience, and catching fraud before it happens, improving customer engagement through targeting and customization—all with the power of analytics and data. More and more companies are now preparing their employees with the know-how of business analytics to drive effectiveness and efficiency in their day-to-day decision-making processes.
A Simple Taxonomy for Analytics
Because of the multitude of factors related to both the need to make better and faster decisions and the availability and affordability of hardware and software technologies, analytics is gaining popularity faster than any other trends we have seen in recent history. Will this upward exponential trend continue? Many industry experts think it will, at least for the foreseeable future. Some of the most respected consulting companies are projecting that analytics will grow at three times the rate of other business segments in upcoming years; they have also named analytics as one of the top business trends of this decade (Robinson et al., 2010). As interest in and adoption of analytics have grown rapidly, a need to characterize analytics into a simple taxonomy has emerged. The top consulting companies (e.g., Accenture, Gartner, and IDT) and several technologically oriented academic institutions have embarked on a mission to create a simple taxonomy for analytics. Such a taxonomy, if developed properly and adopted universally, could create a contextual description of analytics, thereby facilitating a common understanding of what analytics is, including what is included in analytics and how analytics-related terms (e.g., business intelligence, predictive modeling, data mining) relate to each other. One of the academic institutions involved in this challenge is INFORMS (Institute for Operations Research and Management Science). In order to reach a wide audience, INFORMS hired Capgemini, a strategic management consulting firm, to carry out a study and characterize analytics.
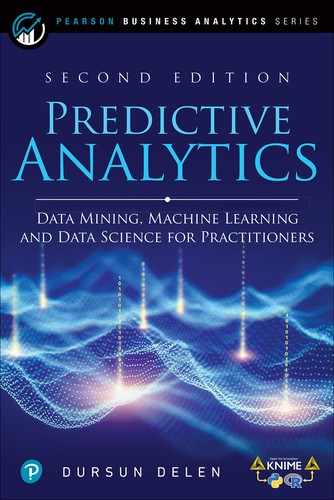
The Capgemini study produced a concise definition of analytics: “Analytics facilitates realization of business objectives through reporting of data to analyze trends, creating predictive models for forecasting and optimizing business processes for enhanced performance.” As this definition implies, one of the key findings from the study is that executives see analytics as a core function of businesses that use it. It spans many departments and functions within organizations, and in mature organizations, it spans the entire business. The study identified three hierarchical but sometimes overlapping groupings for analytics categories: descriptive, predictive, and prescriptive analytics. These three groups are hierarchical in terms of the level of analytics maturity of the organization. Most organizations start with descriptive analytics, then move into predictive analytics, and finally reach prescriptive analytics, the top level in the analytics hierarchy. Even though these three groupings of analytics are hierarchical in complexity and sophistication, moving from a lower level to a higher level is not clearly separable. That is, a business can be in the descriptive analytics level while at the same time using predictive and even prescriptive analytics capabilities, in a somewhat piecemeal fashion. Therefore, moving from one level to the next essentially means that the maturity at one level is completed and the next level is being widely exploited. Figure 1.3 shows a graphical depiction of the simple taxonomy developed by INFORMS and widely adopted by most industry leaders as well as academic institutions.
Figure 1.3 A Simple Taxonomy for Analytics
Descriptive analytics is the entry level in analytics taxonomy. It is often called business reporting because of the fact that most of the analytics activities at this level deal with creating reports to summarize business activities in order to answer questions such as “What happened?” and “What is happening?” The spectrum of these reports includes static snapshots of business transactions delivered to knowledge workers (i.e., decision makers) on a fixed schedule (e.g., daily, weekly, quarterly); dynamic views of business performance indicators delivered to managers and executives in a easily digestible form—often in a dashboard-looking graphical interface—on a continuous manner; and ad hoc reporting where the decision maker is given the capability of creating his or her own specific report (using an intuitive drag-and-drop graphical user interface) to address a specific or unique decision situation.
Descriptive analytics is also called business intelligence (BI), and predictive and prescriptive analytics are collectively called advanced analytics. The logic here is that moving from descriptive to predictive and/or prescriptive analytics is a significant shift in the level of sophistication and therefore warrants the label advanced. BI has been one of the most popular technology trends for information systems designed to support managerial decision making since the start of the century. It was popular (to some extent, it still is in some business circles) until the arrival of the analytics wave. BI is the entrance to the world of analytics, setting the stage and paving the way toward more sophisticated decision analysis. Descriptive analytics systems usually work off a data warehouse, which is a large database specifically designed and developed to support BI functions and tools.
Predictive analytics comes right after descriptive analytics in the three-level analytics hierarchy. Organizations that are mature in descriptive analytics move to this level, where they look beyond what happened and try to answer the question “What will happen?” In the following chapters, we will cover the predictive capabilities of these analytics techniques in depth as part of data mining; here we provide only a very short description of the main predictive analytics classes. Prediction essentially is the process of making intelligent/scientific estimates about the future values of some variables, like customer demand, interest rates, stock market movements, etc. If what is being predicted is a categorical variable, the act of prediction is called classification; otherwise, it is called regression. If the predicted variable is time dependent, the prediction process is often called time-series forecasting.
Prescriptive analytics is the highest echelon in analytics hierarchy. It is where the best alternative among many courses of action—that are usually created/identified by predictive and/or descriptive analytics—is determined using sophisticated mathematical models. Therefore, in a sense, this type of analytics tries to answer the question “What should I do?” Prescriptive analytics uses optimization-, simulation-, and heuristics-based decision-modeling techniques. Even though prescriptive analytics is at the top of the analytics hierarchy, the methods behind it are not new. Most of the optimization and simulation models that constitute prescriptive analytics were developed during and right after World War II, when there was a dire need for a lot with limited resources. Since then, some businesses have used these models for some very specific problem types, including yield/revenue management, transportation modeling, scheduling, etc. The new taxonomy of analytics has made them popular again, opening their use to a wide array of business problems and situations.
Figure 1.4 shows a tabular representation of the three hierarchical levels of analytics, along with the questions answered and techniques used at each level. As can be seen data mining is the key enabler of predictive analytics.

Figure 1.4 Three Levels of Analytics and Their Enabling Techniques
Business analytics is gaining popularity because it promises to provide decision makers with information and knowledge that they need to succeed. Effectiveness of business analytics systems, no matter the level in the analytics hierarchy, depends largely on the quality and quantity of the data (volume and representational richness); the accuracy, integrity, and timeliness of the data management system; and the capabilities and sophistication of the analytical tools and procedures used in the process. Understanding the analytics taxonomy helps organizations to be smart about selecting and implementing analytics capabilities to efficiently navigate through the maturity continuum.
The Cutting Edge of Analytics: IBM Watson
IBM Watson is perhaps the smartest computer system built to date. Since the emergence of computers and subsequently artificial intelligence in the late 1940s, scientists have compared the performance of these “smart” machines with human minds. Accordingly, in the mid- to late 1990s, IBM researchers built a smart machine and used the game of chess (generally credited as the game of smart humans) to test their ability against the best of human players. On May 11, 1997, an IBM computer called Deep Blue beat the world chess grandmaster after a six-game match series: two wins for Deep Blue, one for the champion, and three draws. The match lasted several days and received massive media coverage around the world. It was the classic plot line of human versus machine. Beyond the chess contest, the intention of developing this kind of computer intelligence was to make computers able to handle the kinds of complex calculations needed to help discover new medical drugs, do the broad financial modeling needed to identify trends and do risk analysis, handle large database searches, and perform massive calculations needed in advanced fields of science.
After a couple decades, IBM researchers came up with another idea that was perhaps more challenging: a machine that could not only play Jeopardy! but beat the best of the best. Compared to chess, Jeopardy! is much more challenging. While chess is well structured and has very simple rules, and therefore is very good match for computer processing, Jeopardy! is neither simple nor structured. Jeopardy! is a game designed for human intelligence and creativity, and therefore a computer designed to play it needed to be a cognitive computing system that can work and think like a human. Making sense of imprecision inherent in human language was the key to success.
In 2010 an IBM research team developed Watson, an extraordinary computer system—a novel combination of advanced hardware and software—designed to answer questions posed in natural human language. The team built Watson as part of the DeepQA project and named it after IBM’s first president, Thomas J. Watson. The team that built Watson was looking for a major research challenge: one that could rival the scientific and popular interest of Deep Blue and would also have clear relevance to IBM’s business interests. The goal was to advance computational science by exploring new ways for computer technology to affect science, business, and society at large. Accordingly, IBM Research undertook a challenge to build Watson as a computer system that could compete at the human champion level in real time on the American TV quiz show Jeopardy! The team wanted to create a real-time automatic contestant on the show, capable of listening, understanding, and responding—not merely a laboratory exercise.
Competing Against the Best at Jeopardy!
In 2011, as a test of its abilities, Watson competed on the quiz show Jeopardy!, in the first-ever human-versus-machine matchup for the show. In a two-game, combined-point match (broadcast in three Jeopardy! episodes during February 14–16), Watson beat Brad Rutter, the biggest all-time money winner on Jeopardy!, and Ken Jennings, the record holder for the longest championship streak (75 days). In these episodes, Watson consistently outperformed its human opponents on the game’s signaling device, but it had trouble responding to a few categories, notably those having short clues containing only a few words. Watson had access to 200 million pages of structured and unstructured content, consuming 4 terabytes of disk storage. During the game, Watson was not connected to the Internet.
Meeting the Jeopardy! challenge required advancing and incorporating a variety of text mining and natural language processing technologies, including parsing, question classification, question decomposition, automatic source acquisition and evaluation, entity and relationship detection, logical form generation, and knowledge representation and reasoning. Winning at Jeopardy! requires accurately computing confidence in answers. The questions and content are ambiguous and noisy, and none of the individual algorithms are perfect. Therefore, each component must produce a confidence in its output, and individual component confidences must be combined to compute the overall confidence of the final answer. The final confidence is used to determine whether the computer system should risk choosing to answer at all. In Jeopardy! parlance, this confidence is used to determine whether the computer will “ring in” or “buzz in” for a question. The confidence must be computed during the time the question is read and before the opportunity to buzz in. This is roughly between one and six seconds, with an average around three seconds.
How Does Watson Do It?
The system behind Watson, which is called DeepQA, is a massively parallel, text mining–focused, probabilistic evidence-based computational architecture. For the Jeopardy! challenge, Watson used more than 100 different techniques for analyzing natural language, identifying sources, finding and generating hypotheses, finding and scoring evidence, and merging and ranking hypotheses. What is far more important than any particular technique the IBM team used was how it combined them in DeepQA such that overlapping approaches could bring their strengths to bear and contribute to improvements in accuracy, confidence, and speed.
DeepQA is an architecture with an accompanying methodology that is not specific to the Jeopardy! challenge. These are the overarching principles in DeepQA:
• Massive parallelism. Watson needed to exploit massive parallelism in the consideration of multiple interpretations and hypotheses.
• Many experts. Watson needed to be able to integrate, apply, and contextually evaluate a wide range of loosely coupled probabilistic question and content analytics.
• Pervasive confidence estimation. No component of Watson commits to an answer; all components produce features and associated confidences, scoring different question and content interpretations. An underlying confidence-processing substrate learns how to stack and combine the scores.
• Integration of shallow and deep knowledge. Watson needed to balance the use of strict semantics and shallow semantics, leveraging many loosely formed ontologies.
Figure 1.5 illustrates the DeepQA architecture at a very high level. More technical details about the various architectural components and their specific roles and capabilities can be found in Ferrucci et al. (2010).
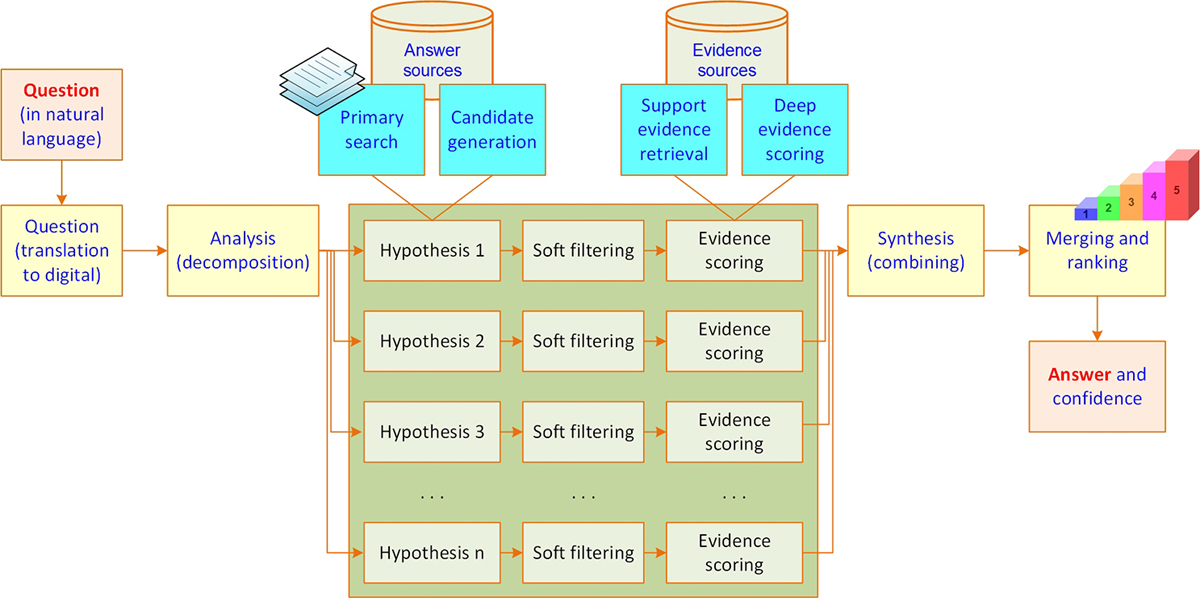
Figure 1.5 A High-Level Depiction of DeepQA Architecture
What Is the Future for Watson?
The Jeopardy! challenge helped IBM address requirements that led to the design of the DeepQA architecture and the implementation of Watson. After three years of intense research and development by a core team of about 20 researchers, as well as a significant R&D budget, Watson managed to perform at human expert levels in terms of precision, confidence, and speed at the Jeopardy! quiz show.
After the show, the big question was “So what now?” Was developing Watson all for a quiz show? Absolutely not! Showing the rest of the world what Watson (and the cognitive system behind it) could do became an inspiration for the next generation of intelligent information systems. For IBM, it was a demonstration of what is possible with cutting-edge analytics and computational sciences. The message is clear: If a smart machine can beat the best of the best in humans at what they are the best at, think about what it can do for your organizational problems. The first industry that utilized Watson was health care, followed by security, finance, retail, education, public services, and research. The following sections provide short descriptions of what Watson can do (and, in many cases, is doing) for these industries.
Health Care
The challenges that health care is facing today are rather big and multifaceted. With the aging U.S. population, which may be partially attributed to better living conditions and advanced medical discoveries fueled by a variety of technological innovations, demand for health care services is increasing faster than the supply of resources. As we all know, when there is an imbalance between demand and supply, the prices go up and the quality suffers. Therefore, we need cognitive systems like Watson to help decision makers optimize the use of their resources, both in clinical and managerial settings.
According to health care experts, only 20% of the knowledge physicians use to diagnose and treat patients is evidence based. Considering that the amount of medical information available is doubling every five years and that much of this data is unstructured, physicians simply don’t have time to read every journal that can help them keep up-to-date with the latest advances. Given the growing demand for services and the complexity of medical decision making, how can health care providers address these problems? The answer could be to use Watson, or some other cognitive systems like Watson that has the ability to help physicians in diagnosing and treating patients by analyzing large amounts of data—both structured data coming from electronic medical record databases and unstructured text coming from physician notes and published literature—to provide evidence for faster and better decision making. First, the physician and the patient can describe symptoms and other related factors to the system in natural language. Watson can then identify the key pieces of information and mine the patient’s data to find relevant facts about family history, current medications, and other existing conditions. It can then combine that information with current findings from tests, and then it can form and test hypotheses for potential diagnoses by examining a variety of data sources—treatment guidelines, electronic medical record data and doctors’ and nurses’ notes, and peer-reviewed research and clinical studies. Next, Watson can suggest potential diagnostics and treatment options, with a confidence rating for each suggestion.
Watson also has the potential to transform health care by intelligently synthesizing fragmented research findings published in a variety of outlets. It can dramatically change the way medical students learn. It can help healthcare managers to be proactive about the upcoming demand patterns, optimally allocate resources, and improve processing of payments. Early examples of leading health care providers that use Watson-like cognitive systems include MD Anderson, Cleveland Clinic, and Memorial Sloan Kettering.
Security
As the Internet expands into every facet of our lives—ecommerce, ebusiness, smart grids for energy, smart homes for remote control of residential gadgets and appliances—to make things easier to manage, it also opens up the potential for ill-intended people to intrude in our lives. We need smart systems like Watson that are capable of constantly monitoring for abnormal behavior and, when it is identified, preventing people from accessing our lives and harming us. This could be at the corporate or even national security system level; it could also be at the personal level. Such a smart system could learn who we are and become a digital guardian that could make inferences about activities related to our life and alert us whenever abnormal things happen.
Finance
The financial services industry faces complex challenges. Regulatory measures, as well as social and governmental pressures for financial institutions to be more inclusive, have increased. And the customers the industry serves are more empowered, demanding, and sophisticated than ever before. With so much financial information generated each day, it is difficult to properly harness the right information to act on. Perhaps the solution is to create smarter client engagement by better understanding risk profiles and the operating environment. Major financial institutions are already working with Watson to infuse intelligence into their business processes. Watson is tackling data-intensive challenges across the financial services sector, including banking, financial planning, and investing.
Retail
Retail industry is rapidly changing with the changing needs and wants of customers. Customers, empowered by mobile devices and social networks that give them easier access to more information faster than ever before, have high expectations for products and services. While retailers are using analytics to keep up with those expectations, their bigger challenge is efficiently and effectively analyzing the growing mountain of real-time insights that could give them the competitive advantage. Watson’s cognitive computing capabilities related to analyzing massive amounts of unstructured data can help retailers reinvent their decision-making processes around pricing, purchasing, distribution, and staffing. Because of Watson’s ability to understand and answer questions in natural language, it is an effective and scalable solution for analyzing and responding to social sentiment based on data obtained from social interactions, blogs, and customer reviews.
Education
With the rapidly changing characteristics of students—more visually oriented/stimulated, constantly connected to social media and social networks, increasingly shorter attention spans—what should the future of education and the classroom look like? The next generation of educational system should be tailored to fit the needs of the new generation, with customized learning plans, personalized textbooks (digital ones with integrated multimedia—audio, video, animated graphs/charts, etc.), dynamically adjusted curriculum, and perhaps smart digital tutors and 24/7 personal advisors. Watson seems to have what it takes to make all this happen. With its natural language processing capability, students can converse with it just as they do with their teachers, advisors, and friends. This smart assistant can answer students’ questions, satisfy their curiosity, and help them keep up with the endeavors of the educational journey.
Government
For local, regional, and national governments, the exponential rise of Big Data presents an enormous dilemma. Today’s citizens are more informed and empowered than ever before, and that means they have high expectations for the value of the public sector serving them. And government organizations can now gather enormous volumes of unstructured, unverified data that could serve their citizens—but only if that data can be analyzed efficiently and effectively. IBM Watson’s cognitive computing may help make sense of this data deluge, speeding governments’ decision-making processes and helping public employees focus on innovation and discovery.
Research
Every year, hundreds of billions of dollars are spent on research and development, most of it documented in patents and publications, creating enormous amount of unstructured data. To contribute to the extant knowledgebase, one needs to sift through these data sources to find the outer boundaries of research in a particular field. This is very difficult, if not impossible work, if it is done with traditional means, but Watson can act as a research assistant to help collect and synthesize information to keep people updated on recent findings and insights. For instance, New York Genome Center is using the IBM Watson cognitive computing system to analyze the genomic data of patients diagnosed with a highly aggressive and malignant brain cancer and to more rapidly deliver personalized, life-saving treatment to patients with this disease (Royyuru, 2014).
Summary
There are several popular terms, including Business analytics, Data Science, Data Mining, Business Intelligence, Data Analytics, floating in the business and scientific circles. Although they differ from each other slightly in terms of their coverage and application domains, they all have the same purpose, which is to convert data into actionable insight. They aim to solve seemingly unsolvable problems using large a feature-rich data. A synergistic use of traditional statistics and modern-day machine learning makes this process of knowledge discovery a reality in many industries and scientific fields.
The increased popularity of business analytics (and its derivative terms and concepts) can be attributed to three main factors: need (to make faster and better decisions in today’s highly competitive business world), availability (of data, highly capable software and increasingly efficient algorithms) and affordability (continuously decreasing the cost of ownership via analytics as a service business models and cloud computing), and cultural change (that focuses on enterprise-wide data-/evidence-based decision making practices).
This chapter provides an overview of business analytics using a simple (three tandem-echelon) taxonomy and describes each of these echelons along with their interrelationship to one another. The rest of this book is dedicated to cover these enabling methods and methodologies of predictive analytics, data mining, text mining, and machine learning using a simple, motivational, non-technical, and example-focused explanation approach.
References
Bi, R. (2014). When Watson Meets Machine Learning. www.kdnuggets.com/2014/07/watson-meets-machine-learning.html (accessed June 2014).
DeepQA. (2011). DeepQA Project: FAQ, IBM Corporation. www.research.ibm.com/deepqa/faq.shtml (accessed April 2014).
Feldman, S., J. Hanover, C. Burghard, & D. Schubmehl. (2012). Unlocking the Power of Unstructured Data. www-01.ibm.com/software/ebusiness/jstart/downloads/unlockingUnstructuredData.pdf (accessed May 2014).
Ferrucci, D., et al. (2010). “Building Watson: An Overview of the DeepQA Project,” AI Magazine, 31(3).
IBM. (2014). Implement Watson. www.ibm.com/smarterplanet/us/en/ibmwatson/implement-watson.html (accessed July 2014).
Liberatore, M., & W. Luo. (2011). “INFORMS and the Analytics Movement: The View of the Membership,” Interfaces, 41(6): 578–589.
Robinson, A., J. Levis, & G. Bennett. (2010, October). “Informs to Officially Join Analytics Movement,” ORMS Today.
Royyuru, A. (2014). “IBM’s Watson Takes on Brain Cancer: Analyzing Genomes to Accelerate and Help Clinicians Personalize Treatments.” Thomas J. Watson Research Center, www.research.ibm.com/articles/genomics.shtml (accessed September 2014).