Chapter 2
Introduction to Predictive Analytics and Data Mining
Data mining is one of the most powerful enablers of data analytics in general and predictive analytics in specific. Although its roots date back to the late 1980s and early 1990s, the most impactful data mining applications have been developed after the turn of the 21st century. Many people believe that the recent popularity of analytics can largely be credited to the increasing use of data mining, which is extracting and providing much-needed insight and knowledge to decision makers at all levels of the managerial hierarchy. The term data mining was originally used to describe the process through which previously unknown patterns in data were discovered. Software vendors and consulting companies have expanded this definition to include most forms of data analysis in order to increase its reach and capability and thereby increase sales of software tools and services related to data mining. With the emergence of analytics as an overarching term for all data analyses, data mining is put back into its proper place—on the analytics continuum where the new discovery of knowledge happens.
In an article in Harvard Business Review, Thomas Davenport (2006), a well-known and respected expert in the field of business analytics, argued that the latest strategic weapon for today’s businesses is analytical decision making that is based on discovery of new knowledge through data mining. He provided examples of companies such as Amazon.com, Capital One, Marriott International, and others that have used (and are still using) analytics to better understand their customers and optimize their extended supply chains in order to maximize their returns on investment while providing the best possible customer service. This level of success can happen only if the company pursues all avenues, including analytics at all three levels—descriptive, predictive, and prescriptive—to intimately understand its customers and their needs and wants, along with their vendors, business processes, and the extended supply chain.
Data mining is the process of converting data into information and to knowledge. In the context of knowledge management, data mining is the phase in which new knowledge is created. Comparatively speaking, knowledge is very distinct from data and information (see Figure 2.1). Whereas data is facts, measurements, and statistics, information is organized or processed data that is timely (i.e., inferences from the data are drawn within the time frame of applicability) and understandable (i.e., with regard to the original data). Knowledge is information that is contextual, relevant, and actionable. For example, a map that gives detailed driving directions from one location to another could be considered data. An up-to-the-minute traffic bulletin along the freeway that indicates a traffic slowdown due to construction several miles ahead could be considered information. Awareness of an alternative, back-roads route could be considered knowledge. In this case, the map is considered data because it does not contain current relevant information that affects the driving time and conditions from one location to the other. However, having the current conditions as information is useful only if you have knowledge that enables you to avoid the construction zone. The implication is that knowledge has strong experiential and reflective elements that distinguish it from information in a given context.
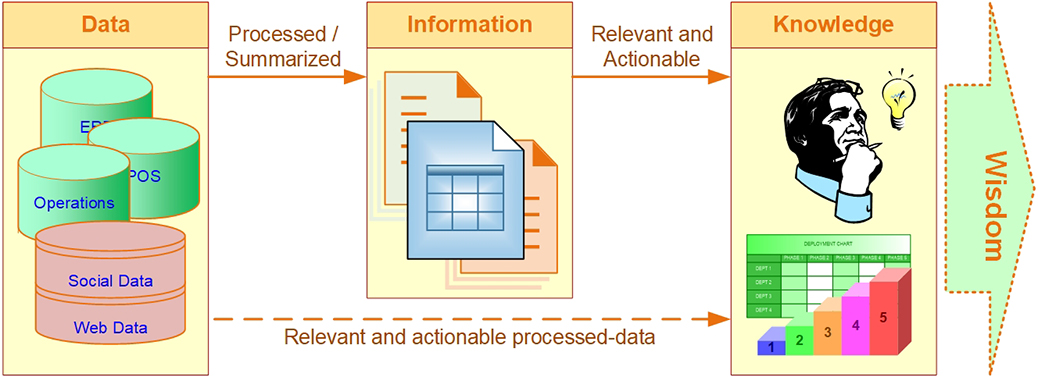
Figure 2.1 The Continuum of Data to Information to Knowledge to Wisdom
Having knowledge implies that it can be exercised to solve a problem, whereas having information does not carry the same connotation. An ability to act is an integral part of being knowledgeable. For example, two people in the same context with the same information may not have the same ability to use the information with the same degree of success. Hence, there is a difference in the human capability to add value. The differences in ability may be due to different experiences, different training, different perspectives, and other factors. Whereas data, information, and knowledge may all be viewed as assets of an organization, knowledge provides a higher level of meaning about data and information. Because it conveys meaning, it tends to be much more valuable yet more ephemeral.
Although the term data mining is relatively new to many people, the ideas behind it are not. Many of the techniques used in data mining have their roots in traditional statistical analysis and artificial intelligence work done since the early part of 1950s. Why, then, has data mining suddenly gained the attention of the business world? Following are some of the most common reasons:
• More intense competition at the global scale. There are more suppliers than there is demand to satisfy everybody.
• Constantly changing needs and wants of the customers. Because of the increasing number of suppliers and their offerings (e.g., higher quality, lower cost, faster service), customer demand is changing in a dramatic fashion.
• Recognition of the value of data. Businesses are now aware of the untapped value hidden in large data sources.
• Changing culture of management. Data-driven, evidence-based decision making is becoming a common practice, significantly changing the way managers work.
• Improved data capture and storage techniques. Collection and integration of data from a variety of sources into standardized data structures enable businesses to have quality data about customers, vendors, and business transactions.
• Emergence of data warehousing. Databases and other data repositories are being consolidated into a single location in the form of a data warehouse to support analytics and managerial decision making.
• Technological advancements in hardware and software. Processing and storage capabilities of computing devices are increasing exponentially.
• Cost of ownership. While capabilities are increasing, the cost of hardware and software for data storage and processing are rapidly decreasing.
• Availability of data. Living in the age of Internet brings new opportunities to analytically savvy businesses to identify and tap into very large and information-rich data sources (social networks and social media) to better understand the world they are living in.
Data is everywhere. For instance, data generated by Internet-based activities is increasing rapidly, reaching volumes that we did not even have specific names for in the very recent past. Large amounts of genomic data and related information (in the form of publications and research findings published in journal articles and other media outlets) are being generated and accumulated all over the world. Disciplines such as astronomy and nuclear physics create huge quantities of data on a regular basis. Medical and pharmaceutical researchers constantly generate and store data that can then be used in data mining applications to identify better ways to diagnose and treat illnesses and to discover new and improved drugs. On the commercial side, perhaps the most common use of data and data mining has been in the finance, retail, and health care sectors. Data mining is used to detect and reduce fraudulent activities, especially in insurance claims and credit card use; to identify customer buying patterns; to reclaim profitable customers; to identify trading rules from historical data; and to aid in increased profitability using market-basket analysis. Data mining is already widely used to better target clients, and with the widespread development of ecommerce, this can only become more imperative with time.
What Is Data Mining?
At the most basic level, data mining can be defined as the process of discovering (i.e., mining) knowledge (i.e., actionable information) from large amounts of data. When you really think about it, you realize that the term data mining is not a proper description of what’s really happening; that is, mining of gold from within rocks and dirt is referred to as gold mining rather than rock or dirt mining. Therefore, data mining perhaps should have been named knowledge mining or knowledge discovery. Despite the mismatch between the term and its meaning, data mining has become the term of choice in the community at large. Several other names, including knowledge discovery in databases, information extraction, pattern analysis, information harvesting, and pattern searching, among others, have been suggested to replace data mining, but none has gained any significant traction.
Data mining is a process that uses statistical, mathematical, and artificial intelligence techniques and algorithms to extract and identify useful information and subsequent knowledge (or patterns) from large sets of data. These patterns can be in the form of business rules, affinities, correlations, trends, or predictions. Fayyad et al. (1996) define data mining as “the nontrivial process of identifying valid, novel, potentially useful, and ultimately understandable patterns in data stored in structured databases,” where the data is organized in records structured by categorical, ordinal, and continuous variables. The key terms in this definition have the following meanings:
• Process implies that data mining comprises many iterative steps.
• Nontrivial means that some experimentation-type search or inference is involved; that is, it is not as straightforward as a computation of predefined quantities.
• Valid means that the discovered patterns should hold true on new data with a sufficient degree of certainty.
• Novel means that the patterns were not previously known to the user in the context of the system being analyzed.
• Potentially useful means that the discovered patterns should lead to some benefit to the user or task.
• Ultimately understandable means that the pattern should make business sense that leads to users saying “This makes sense. Why didn’t I think of that?”—if not immediately, at least after some processing.
Data mining is not a new discipline but rather a new approach in the intersection of several other scientific disciplines. To some extent, data mining is a new philosophy that suggests the use of data and mathematical models to create/discover new knowledge. Data mining leverages capabilities of other disciplines, including statistics, artificial intelligence, machine learning, management science, information systems, and databases, in a systematic and synergistic way (see Figure 2.2). Using collective capabilities of these scientific disciplines, data mining aims to make progress in extracting useful information and knowledge from large data repositories. It is an emerging field that has attracted much attention in a very short time and has fueled the emergence and popularity of the analytics movement.
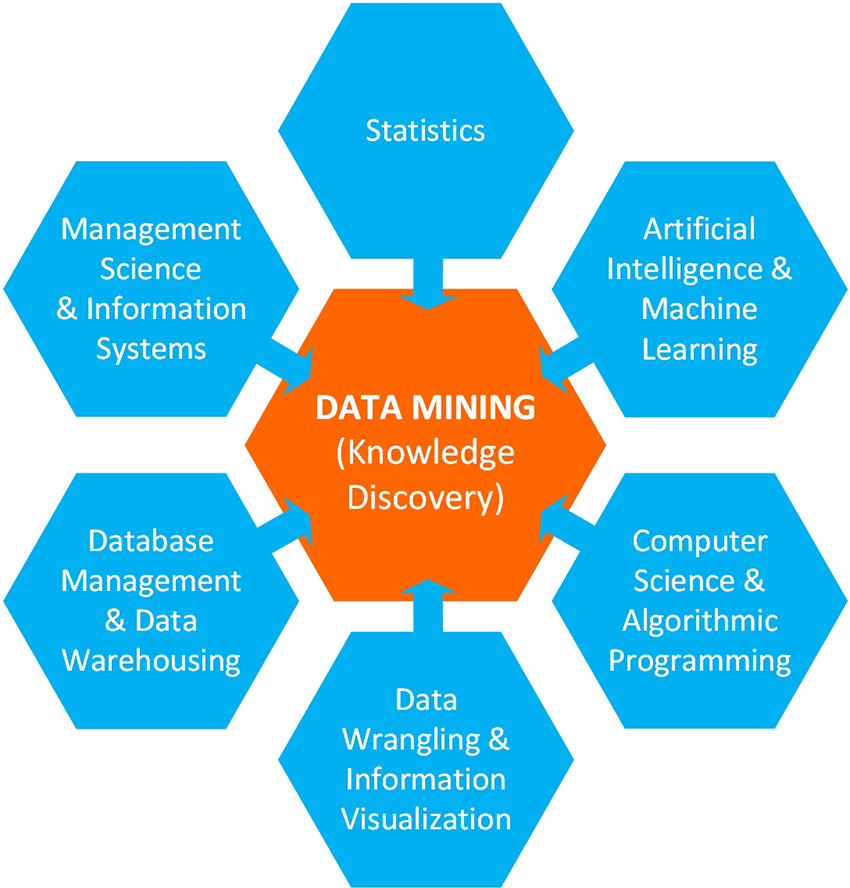
Figure 2.2 Data Mining: A Multidisciplinary Approach to Knowledge Discovery
What Data Mining Is Not
Because of its appeal, many have used the term data mining to mean any analysis that has something to do with data. For instance, people may refer to casual Internet searching as data mining. It’s true that Internet searching is a way to mine large and diverse data/information sources to find (i.e., discover) evidence for a specific question/query; and because of that, it may seem like data mining. However, data mining is the process of discovering reusable patterns through the application of statistical and/or machine learning techniques. Therefore, data mining is much more rigorous and scientific than simply querying the Internet.
Another concept that data mining is often confused with is OLAP (online analytical processing). As the core enabler of the business intelligence movement, OLAP is a collection of database-querying methods for searching very large databases (or data warehouses) through the use of data cubes. Cubes are multidimensional representations of the data stored in data warehouses. With the use of cubes, OLAP helps decision makers to slice and dice organizational data for the purpose of finding answers to “What happened?” “Where did it happen?” and “When did it happen?” types of questions. As sophisticated as it may sound—and perhaps from the standpoint of efficiency, it actually is that sophisticated—OLAP is not data mining. It may be a precursor to data mining. In a sense, they complement each other in that they convert data into information and knowledge for better and faster decision making. Whereas OLAP is part of descriptive analytics, data mining is an essential part of predictive analytics.
There has been much discussion about statistics and data mining; some people suggest that data mining is a part of statistics and others propose that statistics is a part of data mining. Yet others suggest that data mining and statistics are the same thing. Even though we cannot get to the bottom of that discussion here, we can at least shed some light to it by mentioning a few critical points. Data mining and statistics have a lot in common. They both look for relationships in data. The main difference between the two is that statistics starts with a well-defined proposition and hypothesis, while data mining starts with a loosely defined discovery statement. Statistics collects a sample of data (i.e., primary data) to test the hypothesis, while data mining and analytics use existing data (i.e., often observational, secondary data) to discover novel patterns and relationships. Another difference is in the size of data that they use. Data mining looks for data sets that are as “big” as possible, while statistics looks for right size of data and, if the data is larger than what is needed or required for the statistical analysis, it uses a sample of the data. Statistics and data mining have deferent definitions of what constitutes “large data”: Whereas a few hundred to a thousand data points is large enough to a statistician, several millions to a few billion data points is considered large for data mining studies.
In summary, data mining is not a simple Internet search or routine application of OLAP, and it’s not the same as statistics. Even though it uses capabilities of these descriptive techniques, data mining is the next level in the analytics hierarchy, where interesting patterns (relationships and future trends) are discovered with the use of data and models.
The Most Common Data Mining Applications
Data mining has become a popular tool in addressing many complex business problems and opportunities. It has proven to be very successful and helpful in many areas, some of which are listed and briefly discussed in the following sections. It is difficult to find an industry or a problem area where a significant amount of data mining applications have not already been covered in the literature. The goal of many of these data mining applications is to solve complex problems or to explore emerging opportunities in order to create a sustainable competitive advantage.
Marketing and Customer Relationship Management
Customer relationship management (CRM) is an extension of traditional marketing. The goal of CRM is to create one-on-one relationships with customers by developing an intimate understanding of their needs and wants. As businesses build relationships with their customers over time through a variety of interactions (e.g., product inquiries, sales, service requests, warranty calls, product reviews, social media connections), they accumulate tremendous amounts of data. When combined with demographic and socioeconomic attributes, this information-rich data can be used to identify most likely responders/buyers of new products and services (i.e., customer profiling); understand the root causes of customer attrition in order to improve customer retention (i.e., churn analysis); discover time-variant associations between products and services to maximize sales and customer value; and find the most profitable customers and their preferential needs to strengthen relationships and maximize sales.
Banking and Finance
Data mining can help banks and other financial institutions address a variety of problems and opportunities. Data mining can be used to streamline and automate the processing of loan applications by accurately predicting and identifying the most probable defaulters; to detect fraudulent credit card and online-banking transactions; to find new ways to maximize customer value by selling products and services that customers are most likely to buy; and to optimize cash return by accurately forecasting the cash flow on banking entities (e.g., ATMs, bank branches).
Retailing and Logistics
In retailing, data mining can be used to predict accurate sales volumes at specific retail locations in order to determine correct inventory levels; to identify sales relationships between different products (with market-basket analysis) to improve store layout and optimize sales promotions; to forecast consumption levels of different product types (based on seasonal and environmental conditions); to optimize logistics and hence maximize sales; and to discover interesting patterns in the movement of products (especially for products that have a limited shelf life because they are prone to expiration, perishability, and contamination) in a supply chain by analyzing sensory and RFID data.
Manufacturing
Manufacturers can use data mining to predict machinery failures before they occur through the use of sensory data (enabling condition-based maintenance); to identify anomalies and commonalities in production systems to optimize manufacturing capacity; and to discover novel patterns to identify and improve product quality.
Brokerages and Securities Trading
Brokers and traders use data mining to predict when and how much certain stock and/or bond prices will change; to forecast the range and direction of market fluctuations; to assess the effect of particular issues and events on overall market movements; and to identify and prevent fraudulent activities in securities trading.
Insurance
The insurance industry uses data mining techniques to forecast claim amounts for property and medical coverage costs for better business planning; to determine optimal rate plans based on the analysis of claims and customer data; to predict which customers are most likely to buy new policies with special features; and to identify and prevent incorrect claims payments and fraudulent activities.
Computer Hardware and Software
Data mining can be used to predict disk drive failures well before they actually occur; to identify and filter unwanted Web content and email messages; to detect and prevent computer network security bridges; and to identify potentially unsecure software products.
Government and Defense
Data mining has a number of government and military applications. It can be used to forecast the cost of moving military personnel and equipment; to predict an adversary’s moves and hence develop more successful strategies for military engagements; to predict resource consumption for better planning and budgeting; and to identify classes of unique experiences, strategies, and lessons learned from military operations for better knowledge sharing throughout the organization.
Travel and Lodging
Data mining has a variety of uses in the travel industry. It is successfully used to predict sales of different services (e.g., seat types in airplanes, room types in hotels/resorts, car types in rental car companies) in order to optimally price services to maximize revenues as a function of time-varying transactions (commonly referred to as yield management); to forecast demand at different locations to better allocate limited organizational resources; to identify the most profitable customers and provide them with personalized services to maintain their repeat business; and to retain valuable employees by identifying and acting on the root causes for attrition.
Health and Health Care
Data mining has a number of health care applications. It can be used to help individuals and groups pursue healthier life styles (by analyzing data collected with wearable health-monitoring devices); to identify people without health insurance and the factors underlying this undesired phenomenon; to identify novel cost–benefit relationships between different treatments to develop more effective strategies; to forecast the level and the time of demand at different service locations to optimally allocate organizational resources; and to understand the underlying reasons for customer and employee attrition.
Medicine
The use of data mining in medicine is an invaluable complement to traditional medical research, which is mainly clinical and biological in nature. Data mining analyses can be used to identify novel patterns to improve survivability of patients with cancer; to predict success rates of organ transplantation patients to develop better donor–organ matching policies; to identify the functions of different genes in the human chromosome (known as genomics); and to discover the relationships between symptoms and illnesses (as well as illnesses and successful treatments) to help medical professionals make informed decisions in a timely manner.
Entertainment
Data mining is successfully used in the entertainment industry to analyze viewer data to decide what programs to show during prime time and how to maximize returns by knowing where to insert advertisements; to predict the financial success of movies before they are produced to make investment decisions and to optimize returns; to forecast the demand at different locations and different times to better schedule entertainment events and to optimally allocate resources; and to develop optimal pricing policies to maximize revenues.
Homeland Security and Law Enforcement
Data mining has a number of homeland security and law enforcement applications. Data mining is often used to identify patterns of terrorist behaviors; to discover crime patterns (e.g., locations, timings, criminal behaviors, and other related attributes) to help solve criminal cases in a timely manner; to predict and eliminate potential biological and chemical attacks on the nation’s critical infrastructure by analyzing special-purpose sensory data; and to identify and stop malicious attacks on critical information infrastructures (often called information warfare).
Sports
Data mining was used to improve the performance of National Basketball Association (NBA) teams in the United States. Major League Baseball teams use predictive analytics and data mining to optimally utilize their limited resources for a winning season. (In fact, Moneyball is a popular movie about the use of analytics in baseball.) Most professional sports today employ data crunchers and use data mining to increase their chances of winning. Data mining applications are not limited to professional sports. In a recently published article, Delen at al. (2012) developed models to predict NCAA Bowl Game outcomes, using a wide range of variables about the two opposing teams’ previous games statistics. Wright (2012) used a variety of predictors for examination of the NCAA men’s basketball championship bracket (a.k.a. March Madness). In short, data mining can be used to predict the outcomes of sporting events, to identify means to increase odds of winning against a specific opponent, and to make the most out of the available resources (e.g., financial, managerial, athletic) so that a team can produce the best possible outcomes.
What Kinds of Patterns Can Data Mining Discover?
Using the most relevant data (which may come from organizational databases or may be obtained from outside sources), data mining builds models to identify patterns among the attributes (i.e., variables or characteristics) that exist in a data set. Models are usually the mathematical representations (simple linear correlations and/or complex highly nonlinear relationships) that identify the relationships among the attributes of the objects (e.g., customers) described in the data set. Some of these patterns are explanatory (explaining the interrelationships and affinities among the attributes), whereas others are predictive (projecting future values of certain attributes). In general, data mining seeks to identify three major types of patterns:
• Associations find commonly co-occurring groupings of things, such as “beers and diapers” or “bread and butter” commonly purchased and observed together in a shopping cart (i.e., market-basket analysis). Another type of association pattern captures sequences of things. These sequential relationships can discover time-ordered events, such as predicting that an existing banking customer who already has a checking account will open a savings account followed by an investment account within a year.
• Predictions tell the nature of future occurrences of certain events based on what has happened in the past, such as predicting the winner of the Super Bowl or forecasting the absolute temperature on a particular day.
• Clusters identify natural groupings of things based on their known characteristics, such as assigning customers in different segments based on their demographics and past purchase behaviors.
These types of patterns have been manually extracted from data by humans for centuries, but the increasing volume of data in modern times has created a need for more automatic approaches. As data sets have grown in size and complexity, direct manual data analysis has increasingly been augmented with indirect, automatic data processing tools that use sophisticated methodologies, methods, and algorithms. The manifestation of such evolution of automated and semi-automated means of processing large data sets is now commonly referred to as data mining.
As mentioned earlier, generally speaking, data mining tasks and patterns can be classified into three main categories: prediction, association, and clustering. Based on the way in which the patterns are extracted from the historical data, the learning algorithms of data mining methods can be classified as either supervised or unsupervised. With supervised learning algorithms, the training data includes both the descriptive attributes (i.e., independent variables or decision variables) as well as the class attribute (i.e., output variable or result variable). In contrast, with unsupervised learning, the training data includes only the descriptive attributes. Figure 2.3 shows a simple taxonomy for data mining tasks, along with the learning methods and popular algorithms for each of the data mining tasks. Out of the three main categories of tasks, prediction patterns/models can be classified as the outcome of a supervised learning procedure, while association and clustering patterns/models can be classified as the outcome of unsupervised learning procedures.
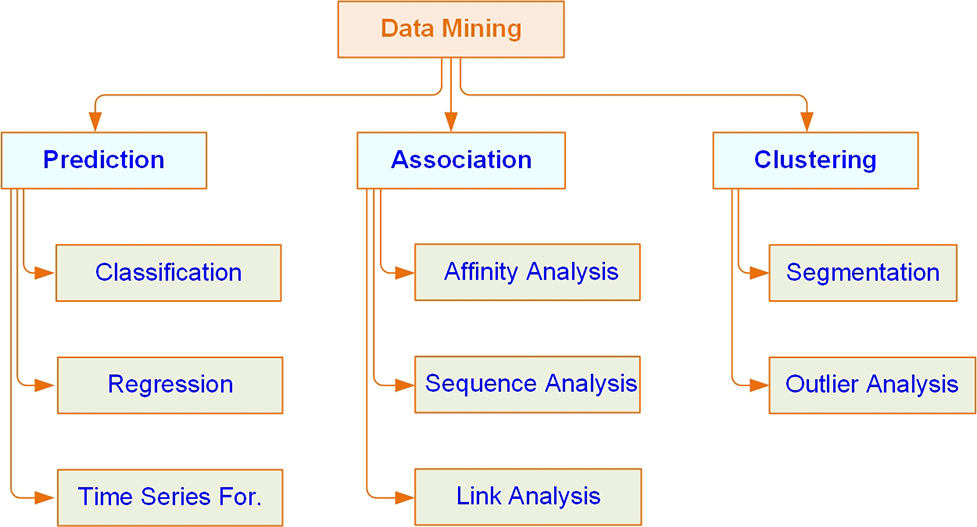
Figure 2.3 A Simple Taxonomy for Data Mining
Prediction is commonly used to indicate telling about the future. It differs from simple guessing by taking into account the experiences, opinions, and other relevant information in conducting the task of foretelling. A term that is commonly associated with prediction is forecasting. Even though many people use these two terms synonymously, there is a subtle difference between them. Whereas prediction is largely experience and opinion based, forecasting is data and model based. That is, in the order of increasing reliability, one might list the relevant terms as guessing, predicting, and forecasting. In data mining terminology, prediction and forecasting are used synonymously, and the term prediction is used as the common representation of the act. Depending on the nature of what is being predicted, prediction can be named more specifically as classification (where the predicted thing, such as tomorrow’s forecast, is a class label such as “rainy” or “sunny”) or regression (where the predicted thing, such as tomorrow’s temperature, is a real number, such as “65°F”).
Classification, or supervised induction, is perhaps the most common of all data mining tasks. The objective of classification is to analyze the historical data stored in a database and automatically generate a model that can predict future behavior. This induced model consists of generalizations over the records of a training data set, which help distinguish predefined classes. The hope is that the model can then be used to predict the classes of other unclassified records and, more importantly, to accurately predict actual future events.
Common classification tools include neural networks and decision trees (from machine learning), logistic regression and discriminant analysis (from traditional statistics), and emerging tools such as rough sets, support vector machines, and genetic algorithms. Statistics-based classification techniques (e.g., logistic regression, discriminant analysis) have received their share of criticism—that they make unrealistic assumptions about the data, such as independence and normality—which limit their use in classification-type data mining projects.
Neural networks (see Chapter 5, “Data Mining Algorithms,” for more detailed coverage of this popular machine learning algorithm) involve the development of mathematical structures (somewhat resembling the biological neural networks in the human brain) that have the capability to learn from past experiences, presented in the form of well-structured data sets. They tend to be more effective when the number of variables involved is rather large and the relationships among them are complex and imprecise. Neural networks have disadvantages as well as advantages. For example, it is usually very difficult to provide good rationale for the predictions made by a neural network. Also, neural networks tend to need considerable training. Unfortunately, the time needed for training tends to increase exponentially as the volume of data increases, and, in general, neural networks cannot be trained on very large databases. These and other factors have limited the applicability of neural networks in data-rich domains.
Decision trees classify data into a finite number of classes, based on the values of the input variables. Decision trees are essentially a hierarchy of if–then statements and are thus significantly faster than neural networks. They are most appropriate for categorical and interval data. Therefore, incorporating continuous variables into a decision tree framework requires discretization—that is, converting continuous valued numerical variables to ranges and categories.
A related category of classification tools is rule induction. Unlike with a decision tree, with rule induction, the if–then statements are induced from the training data directly, and they need not be hierarchical in nature. Other, more recent techniques such as SVM, rough sets, and genetic algorithms are gradually finding their way into the arsenal of classification algorithms and are covered in more detail in Chapter 5 as part of the discussion on data mining algorithms.
Using associations, more commonly called association rules in data mining, is a popular and well-researched technique for discovering interesting relationships among variables in large databases. Thanks to automated data-gathering technologies such as bar code scanners, the use of association rules for discovering regularities among products in large-scale transactions recorded by point-of-sale systems in supermarkets has become a common knowledge-discovery task in the retail industry. In the context of the retail industry, association rule mining is often called market-basket analysis.
Two commonly used derivatives of association rule mining are link analysis and sequence mining. With link analysis, the linkage among many objects of interest is discovered automatically, such as the link between Web pages and referential relationships among groups of academic publication authors. With sequence mining, relationships are examined in terms of their order of occurrence to identify associations over time. Algorithms used in association rule mining include the popular Apriori (where frequent item sets are identified), FP-Growth, OneR, ZeroR, and Eclat. Chapter 4, “Data and Methods in Data Mining,” provides an explanation of Apriori.
Clustering partitions a collection of things (e.g., objects, events, etc., presented in a structured data set) into segments (or natural groupings) whose members share similar characteristics. Unlike in classification, in clustering, the class labels are unknown. As the selected algorithm goes through the data set, identifying the commonalities of things based on their characteristics, the clusters are established. Because the clusters are determined using a heuristic-type algorithm, and because different algorithms may end up with different sets of clusters for the same data set, before the results of clustering techniques are put to actual use, it may be necessary for an expert to interpret and potentially modify the suggested clusters. After reasonable clusters have been identified, they can be used to classify and interpret new data.
Not surprisingly, clustering techniques include optimization. The goal of clustering is to create groups so that the members within each group have maximum similarity and the members across groups have minimum similarity. The most commonly used clustering techniques include k-means (from statistics) and self-organizing maps (from machine learning), which is a unique neural network architecture developed by Kohonen (1982).
Firms often effectively use their data mining systems to perform market segmentation with cluster analysis. Cluster analysis is a means of identifying classes of items so that items in a cluster have more in common with each other than with items in other clusters. This type of analysis can be used in segmenting customers and directing appropriate marketing products to the segments at the right time in the right format at the right price. Cluster analysis is also used to identify natural groupings of events or objects so that a common set of characteristics of these groups can be identified to describe them.
Two techniques often associated with data mining are visualization and time-series forecasting. Visualization can be used in conjunction with other data mining techniques to gain a clearer understanding of underlying relationships. As the importance of visualization has increased in recent years, the term visual analytics has emerged. The idea is to combine analytics and visualization in a single environment for easier and faster knowledge creation. Visual analytics is covered in detail in Chapter 4. In time-series forecasting, the data consists of values of the same variable that is captured and stored over time, in regular intervals. This data is then used to develop forecasting models to extrapolate the future values of the same variable.
Popular Data Mining Tools
A large number of software vendors provide powerful data mining tools. Some of these vendors are providers of only data mining and statistical analysis software, while others are large firms that provide wide ranges of software and hardware, along with consulting, in addition to data mining software products. Examples of the vendors that provide data mining tools include IBM (IBM SPSS Modeler, formerly known as SPSS PASW Modeler and Clementine), SAS (Enterprise Miner), StatSoft (Statistica Data Miner—now a Dell company), KXEN (Infinite Insight—now a SAP company), Salford (CART, MARS, TreeNet, and RandomForest), Angoss (KnowledgeSTUDIO and KnowledgeSeeker), and Megaputer (PolyAnalyst). Noticeably but not surprisingly, the most popular data mining tools were originally developed by the well-established statistical software companies (SPSS, SAS, and StatSoft). This is largely because statistics is the foundation of data mining, and these companies have the means to cost-effectively develop them into full-scale data mining systems.
Most of the business intelligence (BI) tool vendors (e.g., IBM Cognos, Oracle Hyperion, SAP Business Objects, Microstrategy, Teradata, Microsoft) also have some level of data mining capabilities integrated into their software offerings. These BI tools are still primarily focused on descriptive analytics in the sense of multidimensional modeling and data visualization and are not considered to be direct competitors of the data mining tool vendors.
In addition to the commercial data mining tools, there are several open source and/or free data mining software tools available over the Internet. Historically, the most popular free (and open source) data mining tool is Weka, which is developed by several researchers from the University of Waikato in New Zealand (which can be downloaded from cs.waikato.ac.nz/ml/weka/). Weka includes a large number of algorithms for different data mining tasks and has an intuitive user interface. Another recently released and quickly popularized free (for noncommercial use) data mining tool is RapidMiner, developed by RapidMiner.com (which can be downloaded from rapidminer.com). Its graphically enhanced user interface, use of a rather large number of algorithms, and incorporation of a variety of data visualization features set it apart from the rest of the other free data mining tools. Another free and open source data mining tool with an appealing workflow-type graphical user interface is KNIME (which can be downloaded from knime.org). A detailed description of KNIME can be found in Appendix A.
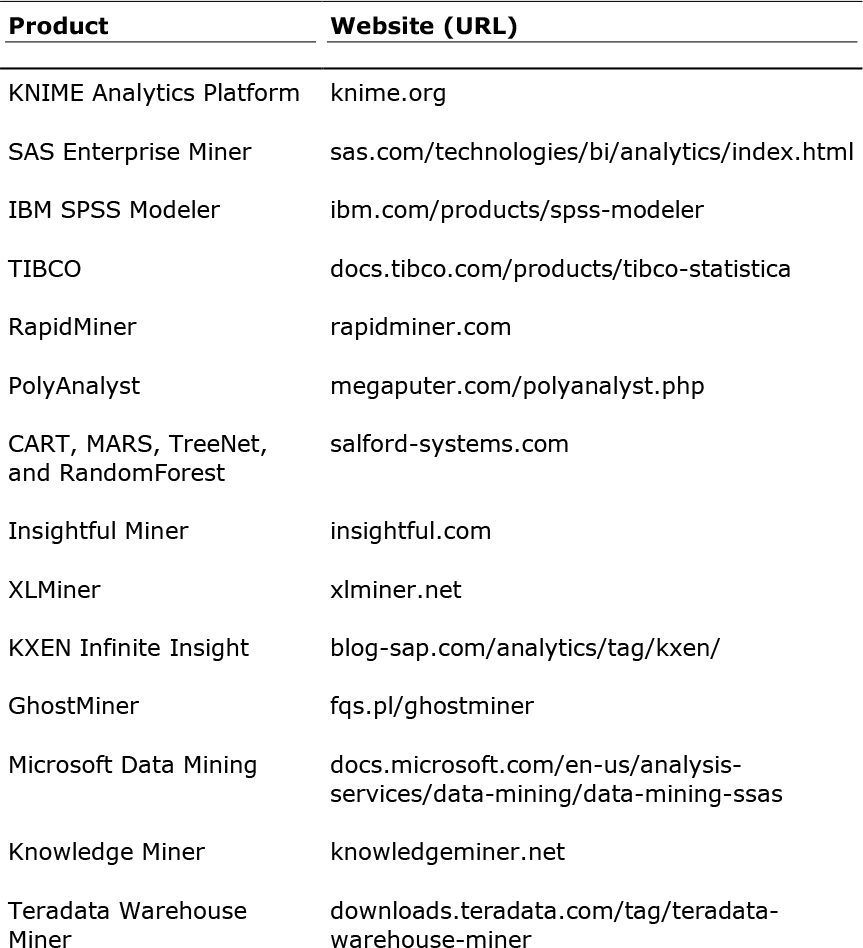
The main difference between commercial tools, such as Enterprise Miner, IBM SPSS Modeler, and Statistica, and free tools, such as Weka, RapidMiner, and KNIME, is often the computational efficiency. The same data mining task involving a large data set may take a lot longer to complete with the free software, and for some algorithms, it may not even complete (i.e., it may crash due to the inefficient use of computer memory). Table 2.1 lists the major data mining products and their Websites.
Table 2.1 Popular Data Mining Software Tools

A suite of business intelligence capabilities that has become increasingly more popular for data mining studies came with the newer versions of Microsoft’s SQL Server. With this tool, data and analytic models are hosted in the same relational database environment, significantly increasing the efficiency on model execution while making model management a considerably easier task. The Microsoft Enterprise Consortium serves as the worldwide source for access to Microsoft’s SQL Server software suite for academic purposes (i.e., teaching and research). The consortium has been established to enable universities around the world to access enterprise technology without having to maintain the necessary hardware and software on their own campuses. The consortium provides a wide range of business intelligence development tools (e.g., data mining, cube building, business reporting) as well as a number of large, realistic data sets from Sam’s Club, Dillard’s, and Tyson Foods. The Microsoft Enterprise Consortium is free of charge and can be used only for academic purposes. The Sam M. Walton College of Business at the University of Arkansas hosts the enterprise system and allows consortium members and their students to access these resources using a simple remote desktop connection. The details about becoming a part of the consortium along with easy-to-follow tutorials and examples can be found at http://enterprise.waltoncollege.uark.edu/mec.asp.
In May 2019, kdnuggets.com (a well-known Web portal for data mining and analytics links and resources) conducted its 20th annual software poll on the following question: “What analytics, data science, machine learning software/tools have you used in the last three years (2017-2019) for a real project?” This poll received huge attention from the analytics and data science community, attracting over 1,800 unique voters. The poll measures both how widely a data analytics / data science software tool is used and how strongly the vendors advocate for their tool. Here are some of the interesting findings that came out of the poll:
• Many business analytics and data science software users use more than one tool to carry out data analytics projects. According to the poll, the average number of tools used by a person or vendor was 6.1 in 2019 (compared to 3.7 in 2014). This is a clear indication that most data scientist use a combination of tools (commercial, free/open-source software, programming languages, and open access algorithms and model libraries as community projects). Using only one tool or language seems to be insufficient to deal with the requirements of the new generation of analytics projects.
• The popularity of free and open-source software tools and programming languages far exceeded the commercial tools. More than two thirds of the most popular tools in the top 40 are either free/open-source software with graphical user interfaces or programming languages and library of models/algorithms used for data analytics. Overall, the most popular tool was Python (with 65% of the votes) as was the case in 2018, increasing the margin of popularity with R to a near 20%.
• While the percent votes for Big Data tools (Apache Spark, Hadoop, Kafka, etc.) and technologies decreased, the deep learning tools, technologies, and libraries (Tensorflow, Keras, PyTorch, etc.) gained significant ground in popularity.
Figure 2.4 shows the results of the poll for tools that places in the top-40 based on the number of unique votes they received. In the chart, the name of a tool is followed by the horizontal bar and the number of votes.
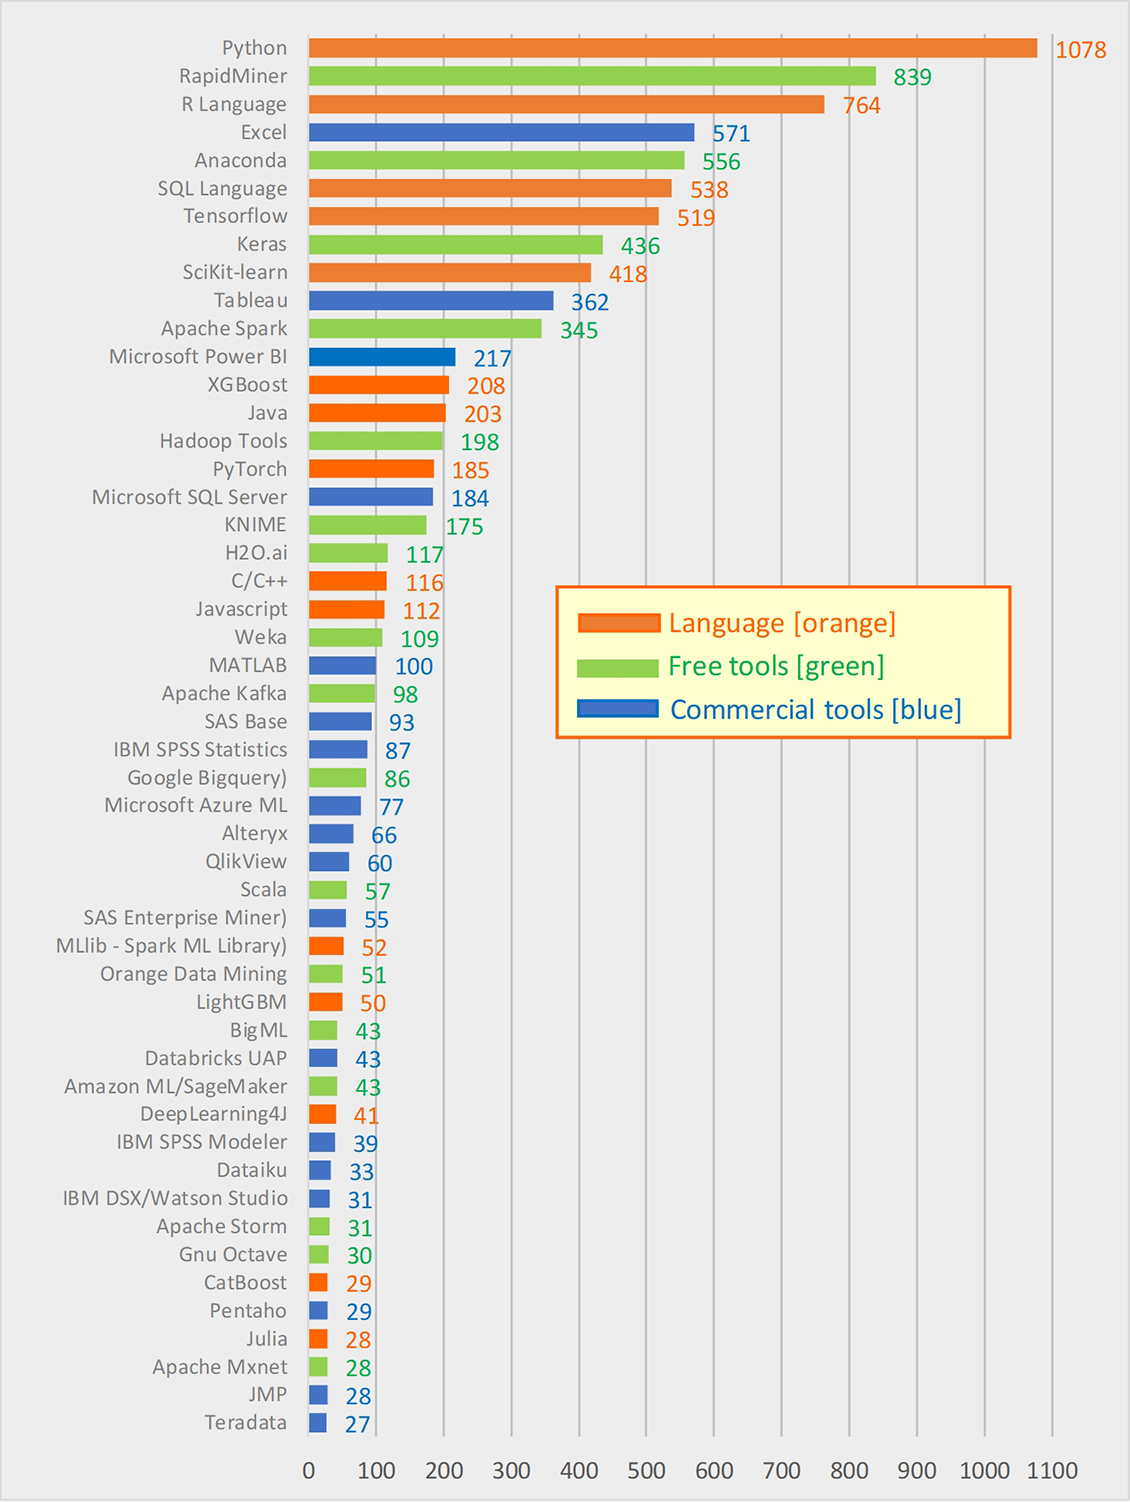
Figure 2.4 Most Popular Data Mining and Analytics Software Tools (User Poll Results)
Source: Used with permission of kdnuggets.com.
To reduce bias through multiple voting, in this poll, KDNuggets used email verification, which may potentially reduce the total number of votes but made the results less biased and more representative.
The Dark Side of Data Mining: Privacy Concerns
Data that is collected, stored, and analyzed in data mining often contains information about real people. Such information may include identification data (e.g., name, address, Social Security number, driver’s license number, employee number), demographic data (e.g., age, sex, ethnicity, marital status, number of children), financial data (e.g., salary, gross family income, checking or savings account balance, home ownership, mortgage or loan account specifics, credit card limits and balances, investment account specifics), purchase history (i.e., what is bought from where and when, either from vendors’ transaction records or from credit card transaction specifics), and other personal data (e.g., anniversary, pregnancy, illness, loss in the family, bankruptcy filings). Most of these data can be accessed through some third-party data providers. The main question here is the privacy of the person to whom the data belongs. In order to maintain the privacy and protection of individuals’ right, data mining professionals have ethical and often legal obligations. One way to ethically handle private data is to de-identify customer records prior to applying data mining applications so that the records cannot be traced to an individual. Many publicly available data sources (e.g., CDC data, SEER data, UNOS data) are already de-identified. Prior to accessing these data sources, those mining data are often asked to consent that under no circumstances will they try to identify the individuals behind those figures.
In a number of instances in the recent past, companies have shared their customer data with others without seeking the explicit consent of their customers. For instance, as you might recall, in 2003, JetBlue Airlines provided more than a million passenger records of its customers to Torch Concepts, a U.S. government contractor. Torch then subsequently augmented the passenger data with additional information, such as family sizes and Social Security numbers—information purchased from a data broker called Acxiom. The consolidated personal database was intended to be used for a data mining project in order to develop potential terrorist profiles. All this was done without notification or consent of passengers. When news of the activities got out, however, dozens of privacy lawsuits were filed against JetBlue, Torch, and Acxiom, and several U.S. senators called for an investigation into the incident (Wald, 2004). Similar, but not as dramatic, privacy-related news came out in the recent past about popular social networking companies, which were allegedly selling customer-specific data to other companies for personalized targeted marketing.
Another peculiar story about data mining and privacy concerns made it to the headlines in 2012. In this instance, the company did not even use any private and/or personal data. Legally speaking, there was no violation of any laws. This story, which is about Target, goes as follows. In early 2012, an infamous story broke out about Target’s practice of using predictive analytics. The story was about a teenager girl who was being sent advertising flyers and coupons by Target for the kind of things that a new mother-to-be would buy from a store like Target. The story goes like this: An angry man went into a Target outside Minneapolis, demanding to talk to a manager: “My daughter got this in the mail!” he said. “She’s still in high school, and you’re sending her coupons for baby clothes and cribs? Are you trying to encourage her to get pregnant?” The manager didn’t have any idea what the man was talking about. He looked at the mailer. Sure enough, it was addressed to the man’s daughter and contained advertisements for maternity clothing, nursery furniture, and pictures of smiling infants. The manager apologized and then called a few days later to apologize again. On the phone, though, the father was somewhat abashed. “I had a talk with my daughter,” he said. “It turns out there’s been some activities in my house I haven’t been completely aware of. She’s due in August. I owe you an apology.”
As it turns out, Target figured out a teen girl was pregnant before her father did! Here is how they did it. Target assigns every customer a Guest ID number (tied to the person’s credit card, name, or email address) that becomes a placeholder to keep a history of everything the person has bought. Target augments this data with any demographic information that it has collected from the customer or bought from other information sources. By using this type of information, Target had looked at historical buying data for all the women who had signed up for Target baby registries in the past. They analyzed the data from all directions, and soon, some useful patterns emerged. For example, lotions and special vitamins were among the products with interesting purchase patterns. Lots of people buy lotion, but Target noticed that women on the baby registry were buying larger quantities of unscented lotion around the beginning of their second trimester. Another analyst noted that sometime in the first 20 weeks, pregnant women loaded up on supplements like calcium, magnesium, and zinc. Many shoppers purchase soap and cotton balls, but when someone suddenly starts buying lots of scent-free soap and extra-big bags of cotton balls, in addition to hand sanitizers and washcloths, it signals that she could be getting close to her delivery date. Target was able to identify about 25 products that, when analyzed together, allowed them to assign each shopper a “pregnancy prediction” score. More importantly, Target could also estimate her due date to within a small window, so the company could send coupons timed to very specific stages of her pregnancy.
If you looked at this practice from a legality perspective, you would conclude that Target did not use any information that violates customers’ privacy; rather, it used transactional data that almost every other retail chain is collecting and storing (and perhaps analyzing) about their customers. What was disturbing in this scenario was perhaps that pregnancy was the targeted concept. People tend to believe that certain events or concepts should be off-limits or treated extremely cautiously, such as terminal disease, divorce, and bankruptcy.
Application Example: Data Mining for Hollywood Managers
Predicting box office receipts (i.e., the financial success) of a particular motion picture is an interesting and challenging problem. According to some domain experts, the movie industry is the “land of hunches and wild guesses” due to the difficulty associated with forecasting product demand, and this makes the movie business in Hollywood a risky endeavor. In support of such observations, Jack Valenti (the longtime president and CEO of the Motion Picture Association of America) once mentioned that “no one can tell you how a movie is going to do in the marketplace...not until the film opens in a darkened theatre and sparks fly up between the screen and the audience.” Entertainment industry trade journals and magazines have been full of examples, statements, and experiences that support this claim.
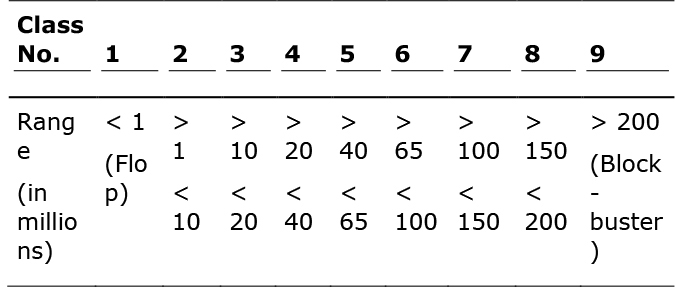
Like many other researchers who have attempted to shed light on this challenging real-world problem, Ramesh Sharda and Dursun Delen have been exploring the use of data mining to predict the financial performance of a motion picture at the box office before it even enters production (while the movie is nothing more than a conceptual idea). In their highly publicized prediction models, they convert the forecasting (or regression) problem into a classification problem; that is, rather than forecast the point estimate of box office receipts, they classify a movie based on its box office receipts in one of nine categories, ranging from “flop” to “blockbuster,” making the problem a multinomial classification problem. Table 2.2 illustrates the definitions of the nine classes in terms of the range of box office receipts.
Table 2.2 Movie Classification, Based on Receipts
Data
Data was collected from a variety of movie-related databases (e.g., ShowBiz, IMDb, IMSDb, AllMovie) and consolidated into a single data set. The data set for the most recently developed models contained 2,632 movies released between 1998 and 2006. A summary of the independent variables along with their specifications is provided in Table 2.3. For more descriptive details and justification for inclusion of these independent variables, see Sharda and Delen (2006).
Table 2.3 Summary of the Predictive Variables


Methodology
Using a variety of data mining methods, including neural networks, decision trees, support vector machines, and three types of ensembles, Sharda and Delen developed the prediction models. The data from 1998 to 2005 were used as training data to build the prediction models, and the data from 2006 was used as the test data to assess and compare the models’ prediction accuracy. Figure 2.5 shows the conceptual architecture for the proposed movie forecasting system, and Figure 2.6 shows the workflow of the model-building process.
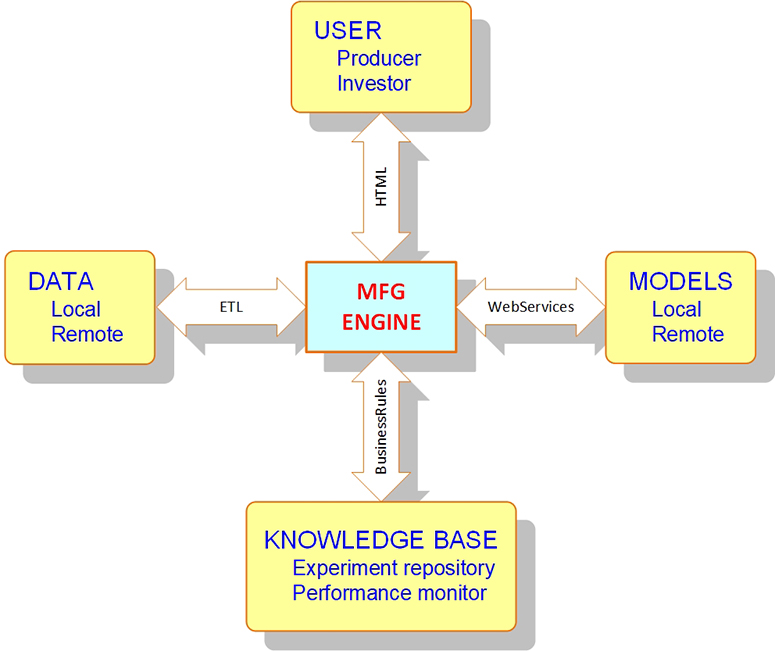
Figure 2.5 Conceptual Architecture for the Movie Prediction System

Figure 2.6 Workflow of the Model-Building Process
Results
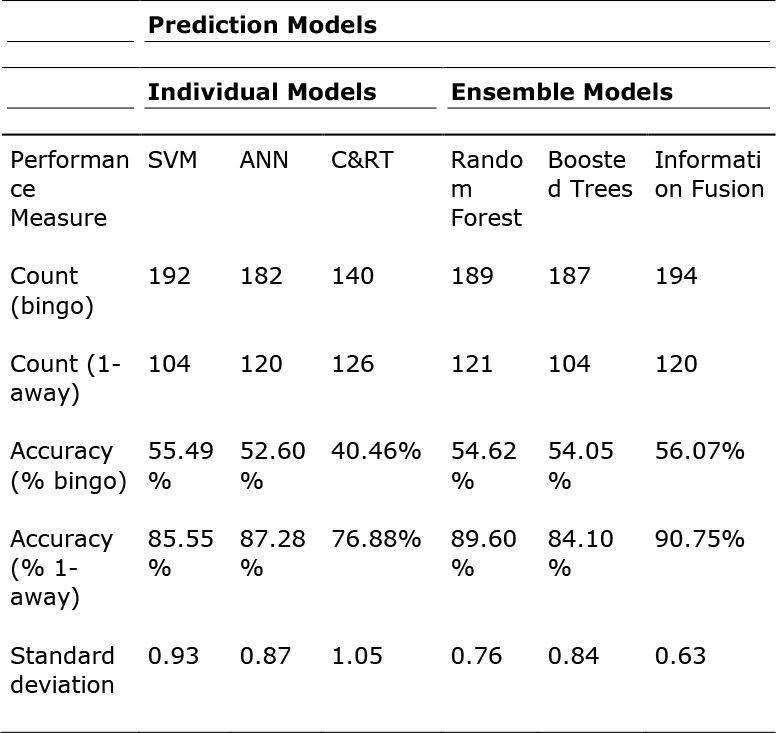
Table 2.4 shows the prediction results of all three data mining methods, as well as the results of the three different ensembles. The first performance measure is the percentage correct classification rate, which is called bingo. The table also reports the 1-away correct classification rate (i.e., within one category). The results indicate that SVM performed the best among the individual prediction models, followed by ANN; the worst of the three was the CART decision tree algorithm. In general, the ensemble models performed better than the individual predictions models, and of those, the fusion algorithm performed the best. What is probably more important to decision makers, and stands out in the results table, is the significantly low standard deviation obtained from the ensembles compared to the individual models.
Table 2.4 Tabulated Prediction Results for Individual and Ensemble Models
Conclusions
The researchers claim that these prediction results are better than any others reported in the published literature for this problem domain. Beyond the attractive accuracy of their prediction results of the box office receipts, these models could also be used to further analyze (and potentially optimize) the decision variables in order to maximize the financial return. Specifically, the parameters used for modeling could be altered using the already trained prediction models in order to better understand the impact of different parameters on the end results. During this process, which is commonly referred to as sensitivity analysis, the decision maker of a given entertainment firm could find out, with a fairly high accuracy level, how much value a specific actor (or a specific release date, or the addition of more technical effects, etc.) brings to the financial success of a film, making the underlying system an invaluable decision aid. Figure 2.7 shows a screen shot from the Movie Forecast Guru software environment.

Figure 2.7 A Screen Shot of the Movie Forecast Guru
References
R. Sharda and D. Delen, “Predicting Box-Office Success of Motion Pictures with Neural Networks,” Expert Systems with Applications, 30:243–254, 2006
D. Delen, R. Sharda, & P. Kumar, “Movie Forecast Guru: A Web-Based DSS for Hollywood Managers,” Decision Support Systems, 43(4): 1151–1170, 2007.
Summary
This chapter is dedicated to the definition and description of predictive analytics and its most prevalent enabler, data mining. As shown in the illustrations of the simple taxonomy for business analytics in Chapter 1, predictive analytics is positioned between descriptive and prescriptive analytics, with the aim of answering the question of “what will happen?” While descriptive analytics takes a retrospective view, predictive analytics focus on a prospective approach to foresee what is most likely to happen in the future so that the incipient problems can be identified and prevented before they happen and potential opportunities can be recognized and leveraged before they become apparent to everyone, especially to competition. This chapter presents these seemingly complex concepts using several illustrative examples and application cases.
References
CRISP-DM. (2013). Cross-Industry Standard Process for Data Mining (CRISP-DM). www.the-modeling-agency.com/crisp-dm.pdf (accessed July 2020).
Davenport, T. H. (2006, January). “Competing on Analytics.” Harvard Business Review.
Delen, D. (2019). Prescriptive Analytics: The Final Frontier for Evidence-Based Management and Optimal Decision Making. FT Press/Pearson, New York, NY.
Delen, D. (2009). “Analysis of Cancer Data: A Data Mining Approach,” Expert Systems, 26(1): 100–112.
Delen, D., D. Cogdell, & N. Kasap. (2012). “A Comparative Analysis of Data Mining Methods in Predicting NCAA Bowl Outcomes,” International Journal of Forecasting, 28: 543–552.
Delen, D., R. Sharda, & P. Kumar. (2007). “Movie Forecast Guru: A Web-Based DSS for Hollywood Managers.” Decision Support Systems, 43(4): 1151–1170.
Delen, D., G. Walker, & A. Kadam. (2005). “Predicting Breast Cancer Survivability: A Comparison of Three Data Mining Methods,” Artificial Intelligence in Medicine, 34(2): 113–127.
Fayyad, U., G. Piatetsky-Shapiro, & P. Smyth. (1996). “From Knowledge Discovery in Databases.” AI Magazine, 17(3): 37–54.
Hill, K. (2012, February 16). “How Target Figured Out a Teen Girl Was Pregnant Before Her Father Did,” Forbes Magazine.
Kohonen, T. (1982). “Self-Organized Formation of Topologically Correct Feature Maps.” Biological Cybernetics, 43(1): 59–69.
Nemati, H. R., & C. D. Barko. (2001). “Issues in Organizational Data Mining: A Survey of Current Practices,” Journal of Data Warehousing, 6(1): 25–36.
Nolan, R. (2012, February 21). “Behind the Cover Story: How Much Does Target Know?” The New York Times.
SEMMA. (2020). SAS’s Data Mining Process: Sample, Explore, Modify, Model, Assess. https://documentation.sas.com/?docsetId=emref&docsetTarget=n061bzurmej4j3n1jnj8bbjjm1a2.htm&docsetVersion=14.3&locale=en (accessed July 2020).
Sharda, R., & D. Delen. (2006). “Predicting Box-Office Success of Motion Pictures with Neural Networks,” Expert Systems with Applications, 30: 243–254.
Wald, M. (2004). “U.S. Calls Release of JetBlue Data Improper.” The New York Times, www.nytimes.com/2004/02/21/business/us-calls-release-of-jetblue-data-improper.html (accessed May 2020).
Wright, C. (2012). “Statistical Predictors of March Madness: An Examination of the NCAA Men’s Basketball Championship.” http://economics-files.pomona.edu/GarySmith/Econ190/Wright March Madness Final Paper.pdf (accessed July 2020).