![]()
Recommendation Systems
Are you thinking of building a recommendation engine? Or are you wondering how recommendations at your favorite website work? Look no further. This chapter builds on the introduction in Chapter 5 with a practical guide on recommendation engines. We will show step by step how to build recommendation engines in Azure Machine Learning.
Overview
Retail experiences are being reimagined. Whether you are shopping for a new book on Amazon, shopping for a new food blender on Taobao, looking for a movie to watch from Netflix or Hulu, or listening to songs on Last.fm or Pandora, personalized experiences enable you to make better choices and find the item you need.
As you search and browse the items, you see sections on the website that point out what others have bought, or items that you might be interested in. As friends in your social network make purchases, and share them on Facebook or Google+, you click the Like button. When you make a purchase at retail outlets or websites, you are encouraged to rate the items (such as movies) that you have bought or rented. These pleasurable and personalized experiences encourage you to explore, spend time with each of the services, find what you need quickly, and eventually buy some of these items.
Many companies realized that they are sitting on a treasure trove of data that can provide rich information on how their customers and the items purchased or rated are interconnected. Recommendation systems enable these companies to sieve through this data and figure out how to tap the insights derived from this data to deliver personalized experiences for their customers.
![]() Note In 2009, Netflix offered a $1M Grand Prize to teams that were able to achieve a prediction accuracy that is 10% better than their home-grown recommendation engine called Cinematch. Read about the exciting innovations made by various teams around the world as they competed to build the best recommender system using data provided by Netflix at http://www.netflixprize.com/ and http://en.wikipedia.org/wiki/Netflix_Prize.
Note In 2009, Netflix offered a $1M Grand Prize to teams that were able to achieve a prediction accuracy that is 10% better than their home-grown recommendation engine called Cinematch. Read about the exciting innovations made by various teams around the world as they competed to build the best recommender system using data provided by Netflix at http://www.netflixprize.com/ and http://en.wikipedia.org/wiki/Netflix_Prize.
Recommendation Systems Approaches and Scenarios
Various techniques for building recommendation systems have been explored over the years. These include
- Collaborative Filtering: By using information about the “tastes” (preferences) of the users of a system, collaborative filtering enables the recommendation system to infer the items that a user will like based on similar items they have liked in the past. Item-to-item collaborative filtering has been used at Amazon.com as part of their item recommendation process. In addition, companies such as Last.fm, Facebook, and LinkedIn have also used collaborative filtering when recommending music, friends, or folks you might know.
- Content-Based Filtering: Inspired by techniques from information retrieval, content-based filtering relies on item description and users’ preference (type of item that they like) to figure out the type of items a user might like. Feedback from users (such as the Like button) can be used to influence weights given to each of the features used. Content-based filtering has been used in various companies such as Rotten Tomatoes, Internet Movie Database, and Pandora Radio.
- Hybrid Approaches: To improve the effectiveness of recommendation systems, hybrid approaches that use both collaborative and content-based filtering have been used. Netflix uses a hybrid approach to provide movie recommendations. Netflix uses information on the watching and searching behavior of users to figure out recommended movies. In addition, Netflix also recommends movies that are similar (based on the tags and description of the movie that the user has watched or rated).
Recommendation systems are commonly used in the following scenarios:
- Related items or items that you might be interested in: When a user is browsing or searching for a specific item, the user sees the recommendation for related items (such as items that are frequently bought together, or items that are related).
- Recommendations provided on a website as users interact with the different sections in the site: For example, when a user lands on the main page of a site (like Yahoo), she sees a personalized page on what’s trending, news, and advertisements. This enables people to find the information that they need, and for companies to provide relevant news and advertisements to their customers.
- Recommend applications in an App Store: Given the huge collection of applications in various app stores (Microsoft, Apple, and Google), a mobile user needs to find the apps that they need quickly. Apps recommendations enable a mobile user to find what they need based on their preferences. When the mobile user uses the app, she can rate the app. This provides a feedback loop, and helps to refine future recommendations to the mobile user.
![]() Note How does a recommendation systems work? Find out at http://blogs.technet.com/b/machinelearning/archive/2014/07/09/recommendations-everywhere.aspx.
Note How does a recommendation systems work? Find out at http://blogs.technet.com/b/machinelearning/archive/2014/07/09/recommendations-everywhere.aspx.
The Business Problem
Imagine that you are a data scientist and part of a team at a startup that is building an award-winning restaurant recommendation service, the goal of which is to make restaurant recommendations available to users anytime, anywhere on the planet. Users of the service download your app, and regardless of their location (perhaps they are visiting a new city), and the app provides recommendations on the best restaurants.
In order to build a personalized experience for the user, the mobile application provides a list of recommended restaurants based on his preferences and his current location. Whenever a user visits one of the restaurants, she uses the mobile application to rate it and provides a review of the restaurant. You are tasked with building a machine learning model to provide recommendations of highly-rated restaurants to the customer based on her preferences.
This is a practical problem for many service providers that offer a highly curated list of restaurants, shopping, and other points of interest. For example, when someone visits a new city, they often use Yelp to find the best restaurants. In other parts of the world, similar services include HungryGoWhere in Singapore and Dianping in China. The ability to provide a personalized experience and the highly relevant recommendations encourage users of the app to “stick” with the service.
![]() Note See how recommendation systems are being used at JJ Food Service, one of the largest independent food delivery services in the United Kingdom (UK) at http://blogs.technet.com/b/machinelearning/archive/2015/01/08/azure-ml-predicts-customers-shopping-lists-even-before-they-shop.aspx.
Note See how recommendation systems are being used at JJ Food Service, one of the largest independent food delivery services in the United Kingdom (UK) at http://blogs.technet.com/b/machinelearning/archive/2015/01/08/azure-ml-predicts-customers-shopping-lists-even-before-they-shop.aspx.
Data Acquisition and Preparation
Let’s explore the datasets that will be used as inputs for building the recommendation system.
For this exercise, you will use the dataset that is available in the Azure Machine Learning Studio. Let’s start to explore the dataset that will be used to build the Recommendation model. Azure Machine Learning Studio provides several experiments that can be used to jumpstart your learning on how to build a recommendation system.
In Azure Machine Learning Studio, do the following:
- Click New Experiment.
- In the Search box, enter Restaurant.
- You will see the experiments that are used for training recommenders (shown in Figure 12-1).

Figure 12-1. Using the Restaurant Recommender
- Select the Recommender: Restaurant ratings by hovering on the image, and choose Open in Studio (shown in Figure 12-2).

Figure 12-2. Selecting the Recommender for restaurant rating
After opening the experiment in Azure Machine Learning Studio, you will see the following datasets:
- Restaurant Ratings: Ratings made by each user for a restaurant
- Restaurant Customer: Customer profile, such as whether the customer is a smoker, how often the customer drinks alcohol, dress preference, preferred ambience, marital status, etc.
- Restaurant Feature: Restaurant information, such as the city and state in which the restaurant is located, whether the restaurant serves alcohol, dress code for the restaurant, etc.
Let’s explore what’s in each of the datasets.
- Right-click the output node of the Restaurant Ratings dataset and choose Visualize (shown in Figure 12-3).

Figure 12-3. Visualizing the Restaurant ratings dataset
- After clicking Visualize, you will see that the Restaurant Ratings dataset consists of three columns: userID, placeID, and rating (shown in Figure 12-4). These three columns correspond to the rating that has been made by a user at a specific restaurant. The userID and placeID are used to identify a specific user and restaurant, respectively.

Figure 12-4. Restaurant ratings dataset columns (userID, placeID, and rating)
Let’s dive deeper into the dataset to understand how the data is distributed and the number of ratings made by each user. To do that, do the following.
- Click the userID column (shown in Figure 12-5).

Figure 12-5. Selecting userID to see the number of ratings made by a user
- In the Visualization pane on the right, you will see the number of ratings made by the first 10 users (shown in Figure 12-6).

Figure 12-6. Number of ratings made by the top 10 users
Note that the default number of bins used is 10. To see more users, you can increase the number of bins.
Next, let’s look at the restaurant customers and restaurant feature datasets. In the Restaurant Customer and Restaurant Feature dataset, you will see the columns userID and placeID, respectively. The userID and placeID columns are used as keys to uniquely identify a specific customer or restaurant, and are shown earlier in the Restaurant Ratings dataset (Figure 12-5).
- Right-click the output node of the Restaurant Customer dataset and choose Visualize (shown in Figure 12-7).

Figure 12-7. Restaurant customer dataset
- Right-click the output node of the Restaurant Feature data set and choose Visualize (shown in Figure 12-8).

Figure 12-8. Restaurant feature dataset
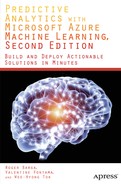
In the experiment, these three datasets will be used as inputs to the Train Matchbox Recommender module (shown in Figure 12-9). In Figure 12-9, you can see that the restaurant rating data is split into a training and test dataset using the Split module (below the Restaurant ratings – Copy dataset).
Figure 12-9. Inputs to the Train Mathbox Recommender module
Click the Split module, and you will see a Recommender Split instead of the default Split (Split Rows). Figure 12-10 shows the settings for the Split module. The Recommender Split is specially designed for recommender systems. It ensure that user-item pairs (and ratings) are evenly divided between the training and test datasets. The Recommender Split provides several properties that can be configured by the user.
- Fraction of training-only users: Specifies the fraction of users that will be used as part of training.
- Fraction of test user ratings for training: Specifies the fraction of user ratings that will be used as part of training.
- Fraction of cold users: Cold users refer to users where no user information is available. Using cold users in an experiment is useful because it enables the recommendation system to make recommendations for users where you do not have complete information.
- Fraction of cold items: Cold items refer to items where no item information is available. In this experiment, this refers to restaurants where you do not have complete information.
- Fraction of ignored users: This is commonly used for performance tuning, where you want the recommendation system to be trained quickly using a subset of the users available.
- Fraction of ignored items: This is commonly used for performance tuning, where you want the recommendation system to be trained quickly using a subset of the items available.
- Remove occasionally produced cold items: This is used to ensure that all users and items in the test dataset are included as part of the training dataset (when the fraction of cold users and items are set to zero).

Figure 12-10. Using the Recommender Split
Training the Model
Having completed the data preprocessing, the next step is to train the Matchbox Recommender using the Train Matchbox Recommender Module.
The goal of recommendation systems is to provide recommendations of one or more items to users of the system. In this experiment, the system recommends restaurants to the users of the system. Often, when a user is new to the system (when the user has not made any ratings for restaurants), recommendations are made using information about the user. This enables the Matchbox recommender to address a common issue faced by most recommendation systems, referred to as “cold-start.” Over time, as the user uses the system and provides more ratings, the Matchbox recommender will be able to use past ratings made by the user to make recommendations.
![]() Note Matchbox is a large-scale Bayesian Recommender System developed by Microsoft Research. It is a hybrid recommender that combines the strength of collaborative and content-based filtering. The Matchbox recommender algorithm is an online learning algorithm that enables the system to incrementally use new data to make sure the system is updated with the latest user preference. Refer to http://research.microsoft.com/en-us/projects/matchbox to learn more about the Matchbox Recommendation System.
Note Matchbox is a large-scale Bayesian Recommender System developed by Microsoft Research. It is a hybrid recommender that combines the strength of collaborative and content-based filtering. The Matchbox recommender algorithm is an online learning algorithm that enables the system to incrementally use new data to make sure the system is updated with the latest user preference. Refer to http://research.microsoft.com/en-us/projects/matchbox to learn more about the Matchbox Recommendation System.
The Train Matchbox Recommender module (Figure 12-11) requires three inputs:
- User-item-rating triplet: Rating made by a specific user for an item
- Users feature: Information about the user
- Items feature: Information about the item
Figure 12-11. Train Matchbox Recommender module
After you have connected the three input datasets to the Train Matchbox Recommender, click the Train Matchbox Recommender module to learn about the two properties that can be set by the user:
- Number of traits: This determines the number of traits that are learned for each user and item. The default value is 4. This can be fine-tuned to a higher number, which will increase the accuracy of the predictions made by the Matchbox Recommender. Usually, this value is set to be between 2 and 20.
- Number of recommendation algorithm iterations: This determines the number of times the Matchbox recommender algorithm iterates over the training data. The default value is 20.
When the value for either of these properties is increased, the training time also increases. The risk of overfitting increases too. Hence, you need to carefully balance how accurate you need the recommendation systems to be, how much time you are willing to spend on training the system, and how much overfitting you will accept. You are now ready to run the experiment. Click Run to run the experiment. Figure 12-12 shows the completed experiment.

Figure 12-12. Recommender – Restaurant ratings experiment
![]() Note Various recommendation web services are also available in the Azure Marketplace to help you get started quickly.
Note Various recommendation web services are also available in the Azure Marketplace to help you get started quickly.
Recommendations: The recommendation web service helps provide item recommendation. See http://datamarket.azure.com/dataset/amla/recommendations.
Model Testing and Validation
After you have successfully run the experiment, you can see the results of the scoring by clicking the Score Matchbox Recommender module. To do this, follow these steps.
- Select the output node of the Score Matchbox Recommender module, and click Visualize (shown in Figure 12-13).

Figure 12-13. Visualizing the scored dataset of a Matchbox Recommender
- After you click Visualize, you will see the restaurant recommendations made for each of the user (shown in Figure 12-14).
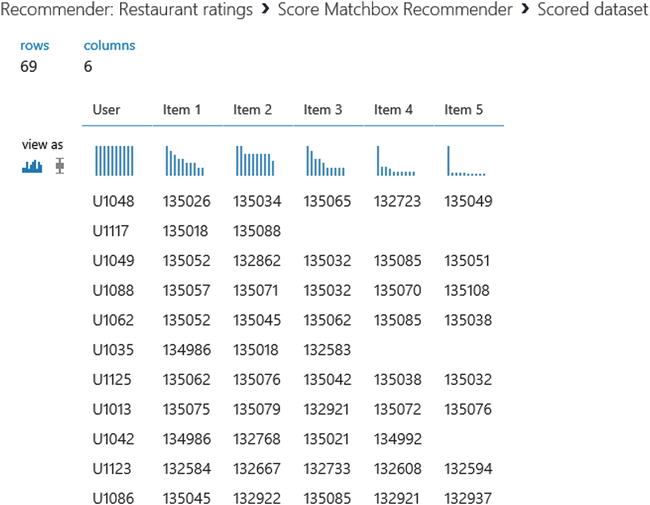
Figure 12-14. Scored dataset for the Matchbox Recommender
- For each of the user, you will see that up to five recommendations are made. For example, user U1048 (first row) has the restaurant recommendations (identified by placeID) 135026, 135034, 135065, 132723, and 135049.
- You can configure the number of item recommendations made by configuring the Score Matchbox Recommender module (shown in Figure 12-15). There are four properties that you can configure. These include
- Recommender prediction kind: This determines whether you require Item Recommendation, Related Users, Related Items, or Ratings Prediction.
- Recommended item selection: From Rated Items, or for all items.
- Maximum number of items to recommend to a user: The default value is set to 5.
- Minimum size of the recommendation pool for single user: The default value is set to 2. This determines the minimum number of items for the item that is being recommended.

Figure 12-15. Properties of Score Matchbox Recommender
The Matchbox Recommender enables you to deliver the results for different prediction types. You can try changing the Recommender Prediction Kind to Related Users or Related Items. After you change the prediction kind, run the experiment. Click Visualize on the Score Matchbox Recommender module to see the results. Figure 12-16 shows the related users for each user, and Figure 12-17 shows the related items for each item.

Figure 12-16. Related Users predictions

Figure 12-17. Related Items predictions
After running the experiment, you can click the Evaluate Recommender module. The output of the Evaluate Recommender module is dependent on the prediction kind that is selected, as follows:
- Item Recommendation: The computed normalized discounted cumulative gain (NDCG) is used to validate the accuracy of the items recommended. The gain is computed using the ratings from the test dataset. In this experiment, you can see the NDCG for item recommendations (shown in Figure 12-18).

Figure 12-18. NDCG for Item Recommendations
- Rating Prediction: Two values are used to determine the accuracy of the rating prediction: mean absolute error (MAE) and root mean squared error (RMSE). If you change the Recommender Prediction Kind to Rating Prediction, you can see these two values (shown in Figure 12-19).
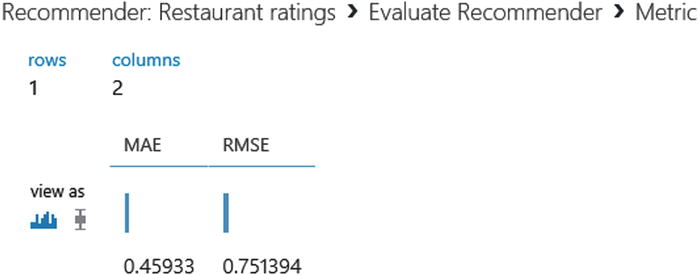
Figure 12-19. MAE and RMSE for Rating Prediction
- Related Users and Related Items: Two values are used to determine the accuracy of the related users prediction: L1 SIM NDCG using Manhattan distance is used to measure similarity, and L2 Sim NDCG uses Euclidean distance to measure similarity.
![]() Note The Discounted Cumulative Gain (DCG) is commonly used in information retrieval to measure ranking quality. DCG measures the gain of an item based on its position in the result list.
Note The Discounted Cumulative Gain (DCG) is commonly used in information retrieval to measure ranking quality. DCG measures the gain of an item based on its position in the result list.
The Normalized Discounted Cumulative Gain (NDCG) is used to ensure that the position of items is normalized, with values ranging from 0.0 to 1.0.
See the Technical Notes at https://msdn.microsoft.com/en-us/library/azure/dn905954.aspx to understand how the NDCG value is computed.
Various datasets are available for Recommendation System experiments:
MovieLens Dataset: Three MovieLens datasets are available for experiments. The datasets contain 100,000, 1 million, 10 million, and 20 million ratings collected from the movielens.org website. The MovieLens website provide non-commercial, personalized movie recommendations, and is run by the GroupLens research group of the University of Minnesota. See http://grouplens.org/datasets/movielens/.
Entree Chicago Recommendation Dataset: The dataset contains users interaction with the Entrée Chicago restaurant recommendation system over a three year period. See http://archive.ics.uci.edu/ml/datasets/Entree+Chicago+Recommendation+Data.
Summary
In this chapter, you learned about various recommendation system scenarios. This list of scenarios is non-exhaustive, and the ability to harness the power of recommendation systems to deliver personalized experiences enables many companies to delight their customers, drive revenue growth, and inspire customers to “stick” with the services provided.
We shared with you the different types of recommendation systems and the problem space addressed by each type. Using the Restaurant Ratings Recommender example from the Azure Machine Learning gallery, you learned how to harness the capabilities of the Matchbox Recommender to predict various recommendation kinds, and how to interpret the metrics used to measure the effectiveness of the recommender.