
Conduction mechanisms in printed thick-film resistors
Abstract:
The current theoretical understanding of the electron transport mechanism in thick-film resistors is reviewed and critically discussed in relation to the transport problem for other classes of conductor–insulator composites. The filler concentration and temperature dependencies of transport are analysed in terms of both percolation and tunnelling (i.e. hopping) processes. In particular, this chapter points out that, since inter-particle tunnelling is the predominant mechanism of transport in thick-film resistors, the percolation theory is not well suited to describe the filler concentration dependence of transport, while a hopping-like approach is more physically sound.
5.1 Introduction
Thick-film resistors (TFR) are composite systems that typically contain a conductive metallic phase dispersed in an insulating and continuous glass matrix. By borrowing a terminology more pertinent to the physics of fluids, TFR may then be regarded as ‘colloidal composites’, to be distinguished from the class of granular composites that are formed by mixtures of conducting and insulating particles. Among the important factors influencing the electrical conduction in TFR are the concentration and distribution of conductive particles in the glass matrix, the glass wetting, the diffusion from conductive nanometric particles into the glassy interfaces, the chemical interactions between conductive particles and the glass, and the conditions during the TFR fabrication. Composites based on metallic oxides such as RuO2, Bi2Ru2O7, Pb2Ru2O6, dispersed into a glass phase of typically lead borosilicate type, represent the most common TFR systems found in various applications exploiting their quite large change in bulk conductivity when subjected to applied deformation.
The electrical transport properties of TFR have aspects in common with those of other types of conductor–insulator composites. Namely, the conductivity displays a strong dependence upon the volume fraction ϕ of the metallic phase characterized by a sharp increase once a ‘critical’ value ϕc is reached. As a function of the temperature T, the conductivity follows a stretched exponential behaviour at low T, which indicates tunnelling-assisted hopping between the conducting particles, and which is found in many other classes of composites in the so-called ‘dielectric’ regime. Furthermore, the rather strong piezoresistive response, i.e. the relative change of the resistivity upon an applied mechanical strain or stress, is comparable to that of polymer-based composites, and is also an indication of a prominently inter-particle tunnelling conduction mechanism.
What makes TFR rather peculiar among the different classes of composites is their marked non-homogeneous dispersion of the conducting phase into the insulating continuum matrix. TFR indeed are fabricated starting from glassy grains whose mean size prior to the thermal processing (firing) is typically of the order of 1–5 μm, which is much larger than that of the conducting particles (from 10 to about 500 nm). The large insulating grains prevent a homogeneous dispersion of the conducting particles in the composites, and the resulting microstructure (commonly referred to as segregated or, less often, cellular) is characterized by large regions depleted of conducting particles, surrounded by areas with a much higher concentration of the conducting phase. An example of this segregated microstructure is shown in Fig. 5.1 for a RuO2-based TFR (Vionnet-Menot, 2005).
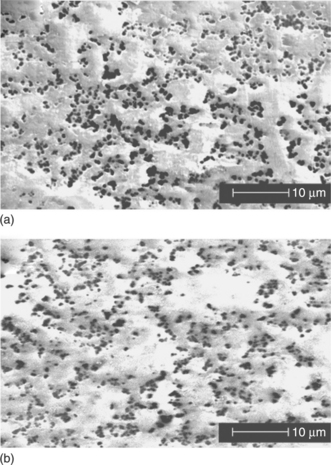
5.1 Scanning electron microscopy images of the surfaces of RuO2-glass TFR with RuO2 volume fraction ϕ = 0.08 and nominal RuO2 grain size of 40 nm for different firing temperatures: (a) 550 °C and (b) 600 °C (Vionnet-Menot et al., 2005).
As will be discussed in more detail in the remainder of this chapter, the main effect of segregation is that of reducing the ‘critical’ volume fraction ϕc below which the composite conductivity is negligible compared to that at larger concentrations. For example, for the TFR of Fig. 5.1, the value of ϕc estimated from conductivity measurements was found to be ϕc ≈ 0.05 (Vionnet-Menot et al., 2005), and even lower values have been reported in the literature (for a short review on ϕc values in TFR see: Dziedzic, 2001). These values of ϕc must be compared with those resulting from homogeneous dispersions of impenetrable spheres in the continuum, for which the percolation threshold coincides with the random close packed value 0.64, or with close-packed mixtures of conducting and insulating spheres, for which ϕc ≈ 0.05 (Scher and Zallen,1970). By varying the relative sizes of the conducting and insulating particles it has been shown that ϕc can be systematically lowered when finer conducting particles are employed in the composite (Carcia et al., 1982; Tamborin et al., 1997). Conversely, TFR fabricated under stirring displays larger ϕc values than the unstirred ones (Pflieger et al., 2009), due to the more homogeneous dispersion of the conducting fillers under stirring conditions.
Another peculiarity of TFR is of historical nature. Indeed, by fitting the conductivity σ versus ϕ data with the power–law relation:
which is predicted by percolation theory (Kirkpatrick, 1973; Sahimi, 2003; Stauffer and Aharoni, 1992), Ru-based TFR were among the first materials showing deviations from the universal value t ≈ 2 of the transport exponent (Pike, 1978). This was expected to hold true for all three-dimensional percolating systems. Subsequent studies have confirmed the non-universality of the transport exponent for TFR as well as for many other types of composites (see Fig. 5.2 for a collection of data), and no definite explanation has yet been proposed to account for it (for a short review see: Vionnet-Menot et al., 2005).
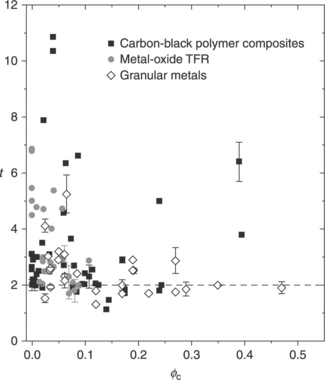
5.2 Collection of the transport critical exponent t as a function of the critical volume fraction ϕc for various conductor–insulator composites. For the complete list of references from which the data have been collected see Vionnet-Menot et al. (2005).
5.2 Current understanding of the conduction mechanism in thick-film resistors
As already pointed out in the introduction, TFR may be regarded as belonging to the general class of colloidal composite, where the conducting particles are dispersed into a continuous insulating matrix. Thermal processing in the fabrication of TFR has the primary effect of softening the glassy phase so as to induce wetting of the conducting particles. As a result, there is usually no physical contact between adjacent conducting fillers, which instead are separated from each other by a thin glassy layer (Chiang et al., 1994). In this situation, electron tunnelling processes dominate the inter-particle conductance gij which, if for the moment we neglect charging energy effects, is given by:
where g0 is a constant ‘contact’ conductance, ξ is the characteristic tunnelling decay length and δij is the minimal distance between the surfaces of two particles i and j. For spherical particles of diameter D, δij = rij − D, where rij is the centre-to-centre distance. In principle, Eq. [5.2] applies to two-phase composites with sharp interfaces separating the conducting and insulating phases, and the tunnelling factor ξ depends on the potential barrier height provided by the glass. However, chemical interactions between the two phases may set in, as is generally the case when high firing temperatures are used in the fabrication process, giving rise to chemical species that can alter the local transport properties (Adachi and Kuno, 1997; Hrovat et al., 2001). For example, in ruthenate-based TFR, the interaction with the glass phase may lead to the formation of RuO2 particles, possibly resulting from a decomposition-precipitation process. Furthermore, when the conducting grains are made of particle agglomerates, the firing process may disperse a fraction of particles of the aggregate, leading to less sharp conductor–insulator interfaces. In these cases, the resulting changes in the local chemical and physical properties can be tentatively described by considering the conducting particles as coated by a third, thin, phase that changes the local charge distribution. In this case, the tunnelling decay length ξ appearing in Eq. [5.2] is an effective one that takes into account the changes in the local dielectric constant.
In the following, we shall review the current theoretical understanding of the filler concentration and temperature dependencies of transport in TFR in order to assess the role played by various important microscopic factors in the overall conductivity behaviour, and to tentatively provide a theoretical framework for the understanding of the transport properties in TFR as a particular class of resistive colloidal composites.
5.2.1 Filler concentration dependence of the conductivity: percolation interpretation
The theoretical framework that has guided much of the understanding of the conducting filler dependencies of the conductivity in TFR, in particular, and in conductor–insulator composites, in general, is based on the concept of percolation (Kirkpatrick, 1973; Sahimi, 2003; Stauffer and Aharoni, 1992). In this picture, the conducting particles are either electrically connected (with some nonzero inter-particle conductance gij) or disconnected (gij = 0). For sufficiently low values of the conducting particle volume fraction ϕ(ϕ = ρv, where ρ is the particle density and v is the volume of a single particle), the connected particles form only isolated clusters in the system which prevent the flow of the current from one side of the sample to the opposite side. In this situation, the macroscopic conductivity σ is either zero or equal to the intrinsic conductivity of the insulating phase. As ϕ increases, new connections are added until, at a critical value ϕc (i.e. the percolation threshold), a cluster of connected particles spanning the entire sample first forms, giving rise to a sharp increase of σ. As more connections are added for ϕ > ϕc, percolation theory predicts that the conductivity follows in the vicinity of ϕc the power–law behaviour of Eq. [5.1], where σ0 is a pre-factor independent of ϕ and t is the dc critical exponent which has the universal value t ≈ 2 for three-dimensional systems (Sahimi, 2003; Stauffer and Aharoni, 1992). Equation [5.1] and its generalization, which includes the effect of a finite conductivity of the insulating matrix, has been applied to several classes of conductor–insulator composites and represents, besides its fundamental signification, a useful tool for characterizing the filler dependencies of real composites. Indeed, apart from the specific value of the exponent t, which will be discussed in more detail below, the most important ingredient of Eq. [5.1] is the explicit dependence of σ on the percolation threshold ϕc Its specific value depends on several factors such as the shape of the conducting fillers, their orientation (in the case of anisotropic filler shapes) and their arrangement or distribution in the composite. Hence the value of ϕc extracted from fits to Eq. [5.1] of experimental σ vs. ϕ data gives important insights on the microscopic properties of the composite.
There are two main theoretical approaches in the study of charge conduction in percolating systems. In the lattice percolation approach, the conducting fillers occupy a fraction p of the sites of a regular or topologically disordered lattice (site percolation model), while the remaining fraction 1 − p of sites is occupied by the insulating particles. The conductance between two neighbouring sites is non-zero only if both of such sites are occupied by the conducting particles. In the bond percolation variant, the percolating elements are the bonds connecting two given (neighbouring) lattice sites. The percolation threshold values pc arising from these lattice models depend on the lattice topology and dimensionality, and have relevance for composite with granular microstructure.
In the second approach to percolation, the positions of the conducting elements are not restricted to occupying the sites of a particular lattice, but rather are continuous variables that can span the entire sample volume. Compared to the lattice percolation construction, this continuum percolation approach therefore constitutes a better description of percolation in colloidal composites. Within this framework, the inter-particle tunnelling mechanism of Eq. [5.2] is taken into account by treating the conducting fillers as core–shell objects, where the impenetrable hard core represents the physical particle and the thickness of the concentric penetrable shell is basically identified with the tunnelling decay length ξ (Berhan and Sastry, 2007; He and Ekere, 2004; Jing et al., 2000; Wang and Ogale, 1993). In light of this tunnelling-percolation model, two spherical fillers are considered electrically connected only if their penetrable shells overlap, so that the resulting percolation threshold scales by a factor approximately proportional to D3/(D + ξ)3, where D is the mean diameter of the conducting filler (Heyes et al., 2006). Although the specific values of ξ depend on the characteristics of the insulating phase, they typically fall between a fraction and a few nanometers, so that the reduction factor D3 /(D + ξ)3 affects prevalently composites with fillers of nanometric sizes.
As already pointed out in the introduction, typical TFR composites have a segregated microstructure that must be taken into consideration in order to understand their low values of ϕc. Qualitatively, the reduction of ϕc can be understood by realizing that, in segregated composites, the conducting phase is constrained to fill the space between the large insulating regions, and that therefore, compared to a homogeneous dispersion, lower amounts of conducting fillers are needed to establish percolation. On a more quantitative level, however, the study of the percolation problem in continuum segregated systems has been pursued at a much lower rate than the more classical percolation problem for homogeneous dispersions. It is illuminating in this respect to realize that, even though the first work on segregated systems was published in 1971 (Malliaris and Turner, 1971), the first Monte Carlo simulations on continuum segregated percolation appeared only in 2002 and in 2004 for two- and three-dimensional cases, respectively (He and Ekere, 2002, 2004). The literature on the subject, indeed, consists almost completely of lattice representations and of discrete approaches to the problem of segregation.
For example in the first model of 1971 (Malliaris and Turner, 1971), formulated to explain the low percolation thresholds of polyethylene–nickel aggregates, the insulating phase was assimilated to large spheres occupying the sites of a cubic lattice and coated with much smaller conducting spheres. Subsequent refinements of this model were aimed to adjust the far too low values of the percolation threshold compared to the experiments by allowing the conducting particles to occupy preferably the interstices between the large insulating spheres (Kusy, 1977). Other lattice models were defined by using cubes and spheres of different sizes to represent respectively the insulating and conducting phases (Kubový, 1986; Pike, 1978; Youngs, 2003), with one or more layers separating the faces of two nearest-neighbour insulating cubes (Lebovka et al., 2006), or small circles occupying the edges of a honeycomb lattice for the description of a two-dimensional segregated structure (Kim et al., 1998). Similar lattice constructions were presented in Grimaldi et al. (2003), where conducting small spheres were allowed to occupy random positions along the edges of a cubic lattice.
A semi-continuum approach was described in Kusy (1997), where sites of a cubic lattice were occupied by conducing spheres of a given diameter, and a segregated structure was generated by removing large spherical volumes randomly according to an overlapping spheres model. At the limit of the zero conducting particle diameter, the conducting phase can be regarded as a continuum, and the segregated construction reduces to the random–void model (Feng et al., 1987). At this limit, the volume fraction at the percolation threshold can be obtained via an exact mapping to a random bond model, where the edges arise from a Voronoi tessellation of the original continuum random–void model. Apart from this particular limit, continuum segregated percolation with finite size ratios of the two species of objects has been considered in He and Ekere (2002, 2004) for a random packing of impenetrable disks and spheres.
All these models provide a general understanding of the role of segregation in lowering the percolation threshold, and so can account for the values of ϕc extracted from the fits of the experimental σ versus ϕ curves to the percolating behaviour of Eq. [5.1]. However, as already noticed above, the values of the transport exponent t extracted from the same fits result to be generally larger or much larger than the universal value t ≈ 2 expected from percolation theory (see Fig. 5.2).
This incongruence is not limited to TFR composites, but it is also shared by other classes of conductor–insulator materials, and its origin has been the subject of several theoretical studies (for a short review, see Vionnet-Menot, 2005). In Heaney (1995) it was argued that long-range interactions could drive the system towards the mean-field regime for which t = tmf = 3. This interpretation cannot however explain the observation of critical exponents much larger than tmf, such as those of carbon–polymer composites or TFR that display values of t as high as t = 5 − 10. Feng, Halperin and Sen (Feng et al., 1987) introduced the random–void model of continuum percolation where current flows through a conducting medium embedding insulating spheres placed at random, thus resembling the situation for an extremely segregated composite (Kusy, 1997). By using an earlier result (Kogut and Straley, 1979) they were able to show that for this model d.c. transport is described by a universality class different from that of the standard percolation model on a lattice. However, the resulting critical exponent was found to be t ≈ 2.4 for three-dimensional systems, which is again a value too small to account for the experimental results.
Within a tunnelling–percolation approach, Balberg (1987) proposed a model of transport non-universality by explicitly taking into account the exponential tunnelling decay of Eq. [5.2] between particles with mutual distances lower than a given cut-off. Within this picture, if the distribution function of the nearest-neighbour inter-particle distances decays much more slowly than the tunnelling decay length ξ, then the critical transport exponent t becomes dependent on the mean inter-particle distance and in principle has no upper bound. The appeal of this model resides in the fact that it considers explicitly the tunnelling inter-particle processes and the statistical properties of the conducting filler distribution in the composite. However, more detailed studies of this model have also evidenced that, actually, very close to the percolation threshold the transport exponent is expected to be universal, while away from ϕc it acquires a strong filler concentration dependence such that t(ϕ) > 2 (Grimaldi and Balberg, 2006). In other words, the critical region in a tunnelling–percolation model is shrunk to a very small region around ϕc, so that the observed non-universality reported in Fig. 5.2 could arise when the composite conductivity data are fitted to Eq. [5.1] by forcing the exponent t to be independent of ϕ outside the region of criticality. Recent Monte-Carlo calculations on homogeneous dispersions of core–shell particles with the tunnelling processes of Eq. [5.2] have evidenced that this ‘apparent’ non-universality is a rather general feature, and that it is not limited to segregated composites (Johner et al., 2008). From a practical point of view, however, the low values of ϕc in segregated systems such as TFR enhance the possibility of measuring large ‘apparent’ t values because of the difficulty of sampling the conductivity behaviour in the vicinity of ϕc when ϕc < < 1.
5.2.2 Filler concentration dependence of the conductivity: the global tunnelling network approach
As pointed out above, in TFR as well as in other classes of colloidal composites in the dielectric regime, the conducting particles are embedded in a continuous insulating matrix and they do not physically touch each other, with the results that the electrical connectedness is established through tunnelling between the conducting filler particles. In this situation, the basic assumptions of percolation theory are, in principle, at odds with the inter-particle tunnelling mechanism. Indeed, while percolation requires the introduction of some sharp cut-off in the inter-particle conductances, i.e. the particles are either connected or disconnected (Sahimi, 2003; Stauffer and Aharoni, 1992), the tunnelling of Eq. [5.2] between particles is a continuous function of inter-particle distances and, hence, it does not imply any sharp cut-off or threshold.
Quite surprisingly, this fundamental incompatibility has hardly been discussed in the literature and basically all the measured conductivity dependencies on the fractional volume content of the conducting phase, σ (ϕ), have been interpreted in terms of Eq. [5.1] assuming the ‘classical’ percolation behaviour. Even more surprising is also the fact that, instead, the temperature dependence of composites in the dielectric regime is commonly described by allowing tunnelling with particles far away from each other (i.e. hopping beyond the first nearest-neighbours), which implicitly assumes that no sharp cut-off exists in the inter-particle conductance. Hence, besides a few cases (e.g. Hu and Shklovskii, 2006; Levin, 1986), basically in all the scientific literature the filler concentration and the temperature dependences are interpreted in terms of, respectively, percolation and hopping processes, which are two mutually incompatible descriptions of the transport mechanisms in composites.
A formulation that goes beyond the percolation description for σ(ϕ) and is therefore compatible with the tunnelling (or hopping) nature of the microscopic transport processes in dielectric composites is the global tunnelling network (GTN) model, in which each conducting filler particle is connected to all others via the tunnelling conductance of Eq. [5.1], and so without imposing the restrictive hypothesis on which the usual core–shell model is based (Ambrosetti et al., 2009, 2010a, 2010b). For a system composed of N conducting particles dispersed into a continuous insulating matrix, the GTN model is equivalent to a weighted disordered network with N nodes, each with coordination number N–1. However, contrary to the usual models of weighted networks (Li et al., 2007), each link weight is not uncorrelated but it is given by Eq. [5.2], which depends on the particular arrangement of the conducting fillers in the composites. This characteristic of the model permits one in principle to describe the ϕ dependence of the conductivity for many different classes of composites with different statistical properties of the microstructures.
When applied to equilibrium dispersions of (impenetrable) particles with different shapes, ranging from spherical ones to rod-like and plate-like geometries, so to simulate systems of recent interest such as nanotubes nanofibres and nanosheets composites (Ambrosetti et al., 2010a), the GTN model is able to reproduce the strong reduction for decreasing the volume fraction ϕ of the conductivity, which is a direct consequence of the fact that as ϕ is reduced the inter-particle distances get larger, leading in turn to a reduction of the local inter-particle conduction gij of Eq. [5.2]. Furthermore, such reduction depends strongly on the shape of the conducting fillers in such a way that stronger filler shape anisotropies entail conductivity drops for lower values of ϕ, as commonly observed in real composite materials.
Another important point of the GTN model applied to such colloidal dispersions is that, by construction, there is not an imposed cut-off and so the system does not display a true percolation threshold. Although at first sight this appears to be in contradiction with the observed behaviour, one must recognize that actually in real composites the lowest measured conductivity σmin is limited by either the experimental setup or by the intrinsic (prevalently of ionic origin) conductivity of the insulating matrix. Hence, in the present picture ϕc can be identified with the value of the volume fraction such that σ (ϕc) ≈ σmin, which represents a (more or less smooth) crossover between the region at ϕ > ϕc, where σ is dominated by inter-particle tunnelling and ϕ < ϕc, where the transport is prevalently sustained only by the insulating phase. This interpretation represents a radical change in perspective with respect to the classical percolation picture, which naturally explains the observed shift of ϕc upon the change of σmin (Pflieger et al., 2009).
Although for the case of colloidal dispersion the tunnelling network conductivity does not follow the percolation-like behaviour of Eq. [5.1], concepts and quantities pertinent to percolation theory are nevertheless very effective and useful in describing the filler dependencies of transport. Indeed, the ϕ -dependence of the conductivity of colloidal composites can be very well approximated by the critical path (CP) approximation, which was originally introduced to study the temperature dependence in amorphous semiconductors (Ambegaokar et al., 1971). When applied to conducting colloidal dispersions, the CP approximation states that the conductivity behaviour is well captured by:
where, for a given ϕ, δc(ϕ) (which depends also on the particle size and anisotropy) is the minimum value of δ such that a cluster of connected core–shell particles with penetrable shell thickness δ/2 spans the sample. The study of how the critical distance δc depends on ϕ and on the geometrical characteristics of the fillers has permitted us to identify approximate but yet accurate formulas for δc (and consequently for σ through Eq. [5.3]), valid for many regimes of interests of colloids with spherical as well as rod-like and plate-like particles. By reinterpreting the many published experimental results on nanospheres, nanotubes, nanofibres and nanosheets in terms of δc, it has been possible to extract the values of the tunnelling decay length ξ, which has been found to fall between 0.1 nm and 10 nm, in accord therefore with the expected value range (Ambrosetti et al., 2010a).
In order to describe TFR composites, or more generally colloidal systems in the segregated regime, the GTN model has been recently generalized to non-homogeneous dispersions of conducting fillers (Nigro et al., 2011). A realistic model of a segregated conductor–insulator composite is schematically illustrated in Fig. 5.3, where the spherical particles of diameter D2 represent the insulating inclusions (e.g. the glassy frit particles in RuO2 TFR), while the conducting particles are modelled as hard spheres of diameter D1. The two kinds of particles are mutually impenetrable and, furthermore, the D2 spheres are assumed to penetrate each other in order to simulate sintering and softening of the insulating grains (Johner et al., 2009). Typically, as in RuO2 TFR composites, D2 is as large as a few micrometres while D1 ranges from tens to hundreds of nanometres, so that the regime D2 > > D1 is the one of practical interest.
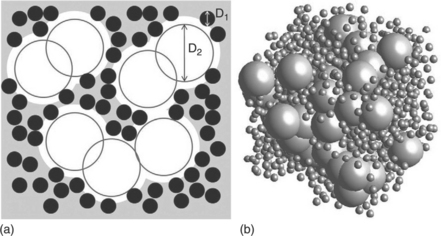
5.3 (a) Schematic representation of a segregated dispersion of conducting particles in the continuum. The insulating (conducting) particles are represented by open (filled) circles of diameter D2 (D1). (b) Example of a segregated distribution for D2/D1 = 4 generated from Monte Carlo.
The overall conductivity arising from the segregated system described above is obtained by solving numerically the tunnelling network equations applied to the subset of D1 particles in the composite. The results are presented in Fig. 5.4(a), where the conductivity σ (symbols) is plotted as a function of the concentration ϕ1 of the conducting particles for D2/D1 = 8 and D1/ξ = 50. In the figure, the different sets of data have been obtained by changing the concentration ϕ2 of the insulating spheres, which, for fixed D2/D1, is equivalent to changing the degree of segregation in the model composite. The reduction in σ for decreasing ϕ1, which is a direct consequence of the fact that as ϕ1 is reduced the inter-particle distances δij in Eq. [5.2] get larger, is strongly mitigated by the segregation which, as will be clarified below, tends instead to decrease δij. One has therefore that, for fixed tunnelling decay length ξ, as the segregation (i.e.ϕ2) is enhanced, the threshold value of ϕ1 required to achieve a given σ decreases considerably. By combining this result with the presence of a lower measurable conductivity σmin, identified by (for example) the ionic conductivity of the glassy matrix, one obtains that more segregated systems entail lower values of ϕc, in agreement with the observed trends.
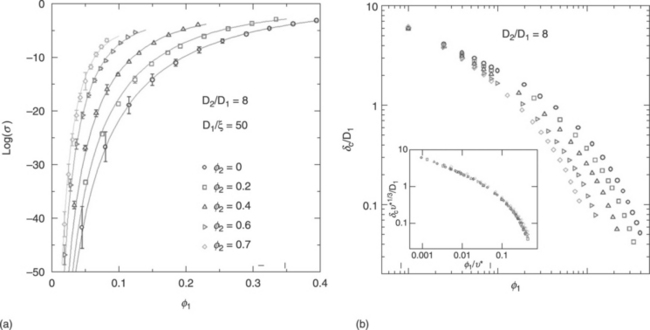
5.4 (a) Calculated conductivity (symbols) as a function of the volume fraction f1 of the conducting spheres with diameter D 1 for D 1/ξ = 50 and for different values of the volume fraction ϕ2 of the insulating spheres with diameter D 2 = 8D 1. The solid lines are fits with Eqs. (3) and (4). (b) Critical distance δc dependence on ϕ1 for the same parameter values of (a). Inset: the same data plotted according to the scaling relation of Eq. [5.4].
The numerical results of Fig. 5.4(a) find a straightforward interpretation by employing the CP approximation of Eq. [5.3]. Indeed, as shown in Fig. 5.4(b) for the same parameters values of (a), the calculated critical tunnelling distances δc decrease as the degree of segregation is enhanced. This decrease can be understood by noticing, as illustrated in Fig. 5.3, that the main effect of the large insulating spheres is that of confining the conducting particles within the volume left over from the insulating D2 spheres, thereby reducing the mutual distances δij, and so δc, of the conducting fillers.
This reasoning can be put in more quantitative terms by introducing the available volume fraction υ*, which is defined as the ratio between the volume, which can be spanned by the centres of the conducting D1 spheres (i.e.: the gray region in Fig. 5.3(a)), and the total volume of the system. For the particular model of segregation in Fig. 5.3, the available volume fraction reduces to υ* = (1 − ϕ2)(1 + D1/D2)3 (Johner et al., 2009; Nigro et al., 2011), but it can be defined also for other kinds of segregation (like those resulting from non-spherical, polydispersed and semipenetrable insulating particles, for example). By assuming that the only relevant variable for describing segregation is υ*, and that consequently the critical distance for a segregated system is a function of only ϕ1 and υ*, then it appears rather natural to argue that the critical distance δc(ϕ1,υ*) for υ* < 1 is proportional to that of a homogeneous system at the effective concentration ϕ1/υ*, i.e. δc(ϕ1/υ*,1). From dimensional considerations one therefore obtains that:
which, as shown in the inset of Fig. 5.4(b), gives a nearly perfect collapse of all the δc data for different ϕ2 values into a single curve. Thus, from Eqs. [5.3] and [5.4], the full ϕ1 dependence of the calculated σ of Fig. 5.4(a) can be expressed in terms of the critical distance of a corresponding homogeneous system. This is illustrated by the solid lines in Fig. 5.4(a), which have been obtained by using in Eq. [5.4] the fitting formula for δc(x,1) given in Ambrosetti et al. (2009).
The procedure described above can be used to reinterpret the filler concentration dependence of the conductivity in real segregated composites, in the same spirit as what has been previously done for homogeneous conductor–insulator systems. In order to illustrate how the theory applies to real composites, let us consider the conductivity data of RuO2-based TFR, which were already reported in Vionnet-Menot et al. (2005). In particular, two series of samples were constituted by RuO2 conducting particles of mean sizes D1 ~ 40 nm and D 1 ~ 100 nm, dispersed in a borosilicate glass. The glassy grains prior to thermal processing (firing) had an average size of about 3 μm, so that for both series of composites D2/D1 > > 1. The two series of samples were fired following identical thermal cycles so that, in principle, they differ only in the mean size D1 of the conducting particles. It should be noted, however, that although the finer RuO2 powders were constituted by nearly spherical and mono-dispersed particles, the series of samples with coarser powders (D1 ~ 100 nm) had actually rather dispersed particle sizes, with less regular shapes. The measured conductivity as a function of RuO2 volume fraction ϕ1 is plotted in Fig. 5.5(a) for both series of TFR composites. In Vionnet-Menot et al. (2005) these same data were interpreted in the framework of percolation theory and were fitted with the power–law relation of Eq. [5.1]. The resulting low percolation threshold values, ϕc ~ 0.07–0.05, were found to be consistent with the segregated distribution of the RuO2 conducting phase observed in the microstructure, while the large transport exponent values, t ~ 3–4, were concluded to arise from the non-universality of the critical behaviour as predicted by the tunnelling–percolation model of Balberg (1987) discussed above. Here, an alternative interpretation of these data based on the GTN theory is offered which, as explained in this chapter, is more justified on physical grounds than the percolation-based one of Vionnet-Menot et al. (2005).
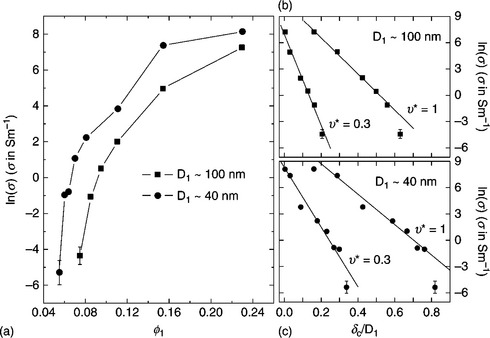
5.5 (a) Measured conductivity data for two series of RuO2-based TFR as a function of RuO2 volume fraction ϕ1 (Vionnet-Menot et al., 2005). The same data are re-plotted as a function of the corresponding critical distance δc for (b) D1 ~ 100 nm and (c) D1 ~ 40 nm for two different values of the available volume fraction υ*. The solid lines in the figure have been obtained by fitting the data to Eq. [5.5].
Let us start by re-plotting the conductivity data of Fig. 5.5(a) in terms of the critical distance δc(ϕ1,υ*) by using the scaling relation of Eq. [5.4] with the functional form of δc(ϕ1/υ*,1) published in Ambrosetti et al. (2009). The available volume fraction υ* is treated as an adjustable parameter. The resulting ln(σ) vs δc plots for two different values of υ* are shown in Fig. 5.5(b) and Fig. 5.5(c) for the D1 ~ 40 nm and D 1 ~ 100 nm samples, respectively. In both cases, the data follow approximately a linear relation that can be fitted to:
which is obtained by taking the natural logarithm of both sides of the CP Eq. [5.3]. From Eq. [5.5], the slope 2/ξ directly gives the value of the tunnelling decay length independently of the specific σ0 value used to fit the data. As apparent from the fits in Fig. 5.5(b) and Fig. 5.5(c), lower values of υ* imply lower values of ξ (i.e. the slopes are larger). This is most clearly seen in Fig. 5.6 where the υ* dependence of the so-obtained ξ values is plotted for both series of samples. Starting from the homogeneous limit at υ* = 1, the tunnelling decay length ξ of the D1 ~ 100 nm series decreases by a factor of five when the available volume fraction is lowered to the minimum value υ* = 0.2 for which a fit Eq. [5.5] was possible, while the D1 ~ 40 nm case displays a weaker decrease in the same range of υ* due to the smaller RuO2 grain size. By realizing that the tunnelling decay length should be independent of the size D1 of the conducting particles, while the specific υ* value could be different for the two series of composites, then ξ must be fall between the two horizontal dashed lines at 4.6 nm and 2.1 nm in Fig. 5.6. However, since the microstructure of both series of composites displays a marked segregated dispersion (Vionnet-Menot et al., 2005) then υ* should be sensibly smaller than the unity, suggesting that the lower limit ξ ~ 2 nm is a more reliable estimate for ξ. This value is fully comparable to those extracted from other conductor–insulator composites (Ambrosetti et al., 2009, 2010a) and, specifically, agrees well with the results of microscopic investigations of TFR composites (Chiang et al., 1994).
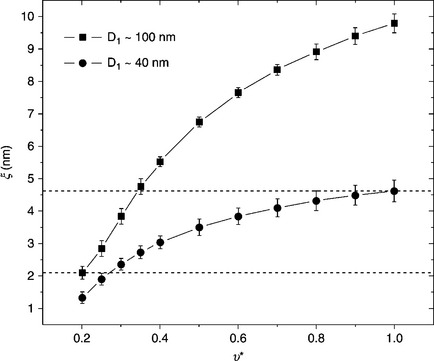
5.6 Values of the tunnelling decay distance ξ as a function of the available volume fraction υ* extracted as explained in the text for the two series of sample in Fig. 5.5.
The application of the GTN method to real segregated composites described above clarifies that the role of segregation is basically that of reducing the mean inter-particle distances, so that realistic values of ξ in the nanometre range can account for conducting particles’ contribution to σ observed for very small ϕ values. From a more general perspective, the above example indicates that, for the ultimate understanding of the conducting filler dependencies of transport, a primary role is played by the statistical properties of the microstructure.
Before concluding this section, it is useful to discuss briefly what the GTN model predicts for the piezoresistive response, which is commonly exploited in Ru-based TFR for pressure and force sensing applications. The piezoresistive response Γ is the relative change of the resistivity upon the application of a mechanical strain ε. Without loss of generality, we assume that the same value of strain ε is applied to all the orthogonal directions x, y and z. From the CP formula of Eq. [5.3] one has therefore:
For fillers having the same elastic properties of the insulating matrix, the last term in Eq. [5.6] is unity, while for elastically rigid fillers this term can be rewritten as [∂ln(δc)/∂ln(ϕ)] ∂ln(ϕ)/∂ε. Since ∂ln(ϕ)/∂ε = − 1 and given that, as ∂ can be inferred from Fig. 5.4, ∂ln(δc)/∂ln(ϕ) has a weak dependence on ϕ, the expected dominant dependence of Γ is thus of the form Γ∝ln(1/σ), which agrees well with the behaviours observed in TFR composites (Tamborin et al., 1997). The Γ∝ln(1/σ) dependence predicted by the GTN model contrasts with the power–law divergence at ϕc of Carcia et al. (1983) obtained from a percolation approach, but is consistent with the logarithmic behaviour Γ ∝ ln(1/(ϕ − ϕc)) reported in Vionnet-Menot et al. (2005).
5.2.3 Temperature dependence of the conductivity
As a function of the temperature T, the conductivity of TFR can often be characterized by two separate regimes at low and high temperatures. At low temperatures, resistivity ρ displays a negative temperature coefficient (i.e.: dρ/dT < 0) which, as will be discussed in more detail below, is a signature of hopping-assisted transport, while at sufficiently high temperatures ρ has a ‘metal-like’ behaviour, i.e. it increases with T. The crossover between the two regimes is identified by a characteristic Tmin, which is the temperature at which ρ has a minimum. In order to account for this behaviour, various explanations have been proposed which, although they basically agree on the hopping-like origin of the T < Tmin regime, differ substantially in what concerns the large T behaviour at T > Tmin. For example, Forlani and Prudenziati (1976) studied the effect of the temperature dependence of the prefactor σ0 appearing in the hopping conductivity formula (see eq. [5.7] below) and noticed that it can provide a possible cause for the change of sign of the temperature coefficient. Pike and Seager (1977) interpreted the positive temperature coefficient as orginating from diffusive transport of the conductive grains. The dρ/dT > 0 regime has also been explained in terms of the thermal expansion affecting the inter-particle tunnelling distances (Kubový, 1995), in analogy to what is observed in polymer composites (Costa et al., 2011), or by invoking the temperature-induced strain due to the mismatch between the temperature expansion coefficients of the resistor and the substrate (Fawcett and Hill, 2000; Sion et al., 1994).
In order to explain the change in sign of the temperature coefficient of resistance (TCR)in TFR, and so the resistance minimum at Tmin, two important points have to be taken into consideration. First, this temperature behaviour of transport is not unique to TFR, but it is also observed in other kinds of conductor–insulator composites, like co-sputtered granular metals (McAlister et al., 1985; Peng et al., 1999; Savvides et al., 1982), for example, or some polymer composites (Carmona and Mouney, 1992; Celzard et al., 1998; Jović et al., 2008), which may suggest that the mechanism responsible for the minimum of resistance is not necessarily linked to some specific characteristics of TFR. Second, generally Tmin increases as the concentration of the conducting phase decreases (and at the same time, the negative temperature coefficient of the resistance becomes larger in absolute value), which indicates that the distribution of the conducting particles in the composite and the temperature behaviour of transport are intimately connected. Indeed, on average, larger volume fractions entail shorter tunnelling distances, so that hopping between neighbouring conducting particles, even in the presence of some activation energy, becomes increasingly favourable. In this respect, the crossover towards the positive temperature coefficient regime may be viewed as the tendency of the system to behave effectively as a dirt metal as ϕ increases, in some analogy to the situation encountered in co-sputtered granular metals on the verge of the percolation threshold of coalescing metallic particles (McAlister et al., 1985; Savvides et al., 1982). This crossover is facilitated in composites with large conducting particles or aggregates because of the lower activation energies participating in the hopping processes.
Let us turn now to discuss in more detail the dielectric regime of TFR, i.e. the one characterized by dρ/dT < 0. As in many other kinds of conductor–insulator composites, the low temperature dependence of the conductivity in TFR displays a stretched exponential dependence of the type:
where T0 is a characteristic temperature and α is a dimensionless number. At sufficiently large temperatures α ≈ 1, which indicates activated behaviour, while at low T the exponent is usually lower than the unity. In particular, both α = ¼ and α = ½ have been shown to provide reasonably good fits to the temperature dependence of σ, depending on the particular composite considered, although also values of α different from ¼ and ½ have been reported repeatedly.
The α = ¼ law is reminiscent of the Mott variable-range hopping behaviour observed in amorphous semiconductors, while the Efros–Shklovskii α = ½ case is the one usually observed to arise when Coulomb effects are important in semiconductors (Efros and Shklovskii, 1975). The origin of the α = ¼ and α = ½ behaviours in semiconductors stems from the energy E dependence of the density of states ρ(E) in the vicinity of the Fermi level E = 0. When ρ(E) is constant and different from zero about E = 0, Eq. [5.7] follows the Mott behaviour with α = ¼ (for three-dimensional systems), while the soft Coulomb gap ρ(E) ∝ E2 arising from the long-range Coulomb interaction in charged unscreened impurities leads to the Efros–Shklovskii law α = ½.
Although Eq. [5.7] provides a good understanding for the transport mechanism in doped semiconductors, its application to composite materials in general, and to TFR in particular, is still rather problematic. Indeed, even if the Efros–Shklovskii law with α = ½ is the one that provides, on average, rather good fits to the low temperature dependence of σ in composites, its implications are non-trivial. For example, from the original work of Efros–Shklovskii, the parameter T0 in Eq. [5.7] is expected to be T0 ≈ e2/κξ, where e is the electron charge, κ is the dielectric constant and ξ is the tunnelling decay length (we have used units in which the Boltzmann constant KB is unity). Typically, in TFR, T0 is of the order of a fraction of meV, which implies for ξ values as large as 2 μm, which are clearly unphysical and too large if referred to as the direct tunnelling of electrons between conducting particles (Roman et al., 1997). Similar considerations apply also for those TFR composites showing the Mott α = ¼ behaviour. For example, in Forlani and Prudenziati (1976), the values of ξ from the fits with the Mott law, where T0∝ ξ3/ρ, have resulted to be of the order of 40–80 nm. In order to resolve this discrepancy, it has been argued that, actually, the glassy layer separating adjacent conducting grains is doped with hopping centres generated by the interaction between the insulating and the conducting phases. Alternatively, it has been proposed that the temperature behaviour of σ actually follows that of a fluctuation-induced tunnelling model, which predicts that σ∝ exp[− T0(T + T1)], where T0 and T1 are parameters depending on ξ and on the area and separation of the tunnelling barriers (Sheng et al., 1978). However, this model also predicts that, at T < < T1, the conductivity become temperature-independent, while TFR show no sign of such a behaviour down to millikelvin temperatures (Bat’ko et al., 1994).
If one considers the problem of the temperature dependence of σ of TFR from the more general perspective in which TFR are viewed as just a particular class of conductor–insulator composites, then one should also realize that this problem, although having attracted very wide attention for decades, is still open to debate and only recently has some real understanding been achieved. For example, although the Efros–Shklovskii regime with α = ½ appears to be generic for both irregular and strictly periodic granular arrays, its manifestation has remained a challenging puzzle for a long time. Now, it appears rather established that, in order to allow tunnelling with spatially remote and not only adjacent conducting grains (a condition necessary for the stretched–exponential behaviour of Eq. [5.7]), electrons use virtual electron levels in a sequence of grains (for a recent review on this matter, see Beloborodov et al., 2007). This co-tunnelling mechanism (Averin and Nazarov,1990), which can be both elastic and inelastic, leads to an effective tunnelling decay length ξ, which can be much larger than the decay length ξ0 of direct inter-particle tunnelling processes. For example, for a row of spherical particles of diameter D separated by insulating layers of thickness δ, the effective decay length for elastic co-tunnelling scales approximately as ξ∝ ξ0D/δ (Zhang and Shklowskii, 2004). Hence, the large tunnelling decay length values extracted from fits to Eq. [5.7] with α = ½ in TFR appear more realistic if interpreted in terms of an effective ξ, as resulting from the co-tunnelling mechanism.
As pointed out at the beginning of this section, TFR display low-temperature stretched exponential behaviours also with α different from ¼ and ½. In part, this could result from the experimental limitation to accurately determine the coefficient α, which accurately account for the data, but it could also arise from the effect of the statistical properties of the conducting phase dispersion into the insulating host matrix. In this respect, not much has been done without invoking ad hoc assumptions, and much work still has to be done in order to fully understand the origin of such α values.
5.3 Conclusion and future trends
As discussed above, the general behaviour of transport in TFR does not deviate from that of other classes of conductor–insulator composites, although some peculiarities in their microstructure or other local properties are certainly responsible for features that are characteristic of TFR, like for example their high level of conductivity for low or very low contents of the conducting phase driven by the segregated microstructure. In this respect, the theoretical understanding of the transport properties in TFR as well as in other classes of conductor–insulator composites will certainly profit if the temperature and the concentration dependencies of σ are considered in conjunction, instead of being studied separately as has been generally done in the literature. It is indeed worth remembering that, as a result of these separate approaches, the ϕ and T dependences are commonly interpreted in terms of, respectively, percolation and hopping mechanisms that, as already stressed above, are in principle two incompatible representations of the transport mechanism in conductor–insulator composites.
5.4 References
Adachi, K., Kuno, H. Decomposition of ruthenium oxides in lead borosilicate glass. J Am Ceram Soc. 1997; 50:1055–1064.
Ambegaokar, V., Halperin, B.I., Langer, J.S. Hopping conductivity in disordered systems. Phys Rev B. 1971; 4:2612–2620.
Ambrosetti, G., Johner, N., Grimaldi, C., Maeder, T., Ryser, P., et al. Electron tunnelling in conductor–insulator composites with spherical fillers. J Appl Phys. 2009; 106:016103.
Ambrosetti, G., Grimaldi, C., Balberg, I., Maeder, T., Danani, A., et al. Solution of the tunnelling–percolation problem in the nanocomposite regime. Phys Rev B. 2010; 81:155434.
Ambrosetti, G., Balberg, I., Grimaldi, C. Percolation-to-hopping crossover in conductor–insulator composites. Phys Rev B. 2010; 82:134201.
Averin, D.V., Nazarov, Y.V. Virtual electron diffusion during quantum tunnelling of the electric charge. Phys Rev Lett. 1990; 65:2446–2449.
Balberg, I. Tunneling and nonuniversal conductivity in composite materials. Phys Rev Lett. 1987; 59:1305–1308.
Bat’ko, I., Flachbart, K., Somora, M., Vanický, D. Design of RuO2-based thermometers for the millikelvin temperature range. Cryogenics. 1994; 35:105–108.
Berhan, L., Sastry, A.M. Modeling percolation in high-aspect-ratio fiber systems. I. Soft-core versus hard-core models. Phys Rev E. 2007; 75:041120.
Beloborodov, S., Lopatin, A.V., Vinokur, V.M., Efetov, K.B. Granular electronic systems. Rev Mod Phys. 2007; 79:469–518.
Carcia, P.F., Ferretti, A., Suna, A. Particle size effects in thick-film resistors. J Appl Phys. 1982; 53:5282–5288.
Carcia, P.F., Suna, A., Childers, W.D. Electrical conduction and strain sensitivity in RuO2 thick-film resistors. J Appl Phys. 1983; 54:6002–6008.
Carmona, F., Mouney, C. Temperature-dependent resistivity and conduction mechanism in carbon particle-filled polymers. J Mater Sci. 1992; 27:1322–1326.
Celzard, A., McRae, E., Marêché, J.F., Furdin, G. Conduction mechanisms in some graphite–polymer composites: effects of temperature and hydrostatic pressure. J Appl Phys. 1998; 83:1410–1419.
Chiang, Y.-M., Silverman, L.A., French, R.H., Cannon, R.M. Thin glass film between ultrafine conductor particles in thick-film resistors. J Am Ceram Soc. 1994; 77:1143–1152.
Costa, L.C., Chakki, A., Achour, M.E., Graça, M.P.F. PTCR effect in carbon black/copolymer composites. Physica B: Condensed Matter. 2011; 406:245–249.
Dziedzic, A. Percolation theory and its application in materials science and microelectronics. (Part II – Experiments and numerical simulations). Inform. MIDEM. 2001; 31:141–152.
Efros, A.L., Shklovskii, B.I. Coulomb gap and low temperature conductivity of disordered systems. J Phys C. 1975; 8:L49–L51.
Fawcett, N., Hill, M. A contribution to the debate on the resistance–temperature characteristics of thick-film resistor materials. Sensors and Actuators. 2000; 86:52–57.
Feng, S., Halperin, B.I., Sen, P.N. Transport properties of continuum systems near the percolation threshold. Phys Rev B. 1987; 35:197–214.
Forlani, F., Prudenziati, M. Electrical conduction by percolation in thick-film resistors. Electrocomp Sci Technol. 1976; 3:77–83.
Grimaldi, C., Maeder, T., Ryser, P., Strässler, S. Segregated tunneling–percolation model for transport nonuniversality. Phys Rev B. 2003; 68:024207.
Grimaldi, C., Balberg, I. Tunneling and nonuniversality in continuum percolation systems. Phys Rev Lett. 2006; 96:066602.
He, D., Ekere, N.N. Two dimensional percolation and cluster structure of the random packing of binary disks. Phys Rev E. 2002; 65:061304.
He, D., Ekere, N.N. Effect of particle size ratio on the conducting percolation threshold of granular conductive-insulating composites. J Phys D: Appl Phys. 2004; 37:1848–1852.
Heaney, M.B. Measurement and interpretation of nonuniversal critical exponents in disordered conductor–insulator composites. Phys Rev B. 1995; 52:12 477–12 480.
Heyes, D.M., Cas, M., Bra![]() ca, A.C. Percolation threshold of hard-sphere fluids in between the soft-core and hard-core limits. Mol Phys. 2006; 104:3137–3146.
ca, A.C. Percolation threshold of hard-sphere fluids in between the soft-core and hard-core limits. Mol Phys. 2006; 104:3137–3146.
Hrovat, M., Samardžija, Z., Holc, J. Microstructural and electrical characteristics of some overfired thick-film resistors. J Mater Sci Lett. 2001; 20:347–351.
Hu, T., Shklovskii, B.I. Theory of hopping conductivity of a suspension of nanowires in an insulator. Phys Rev B. 2006; 74:054205.
Jing, X., Zhao, W., Lan, L. The effect of particle size on electric conducting percolation threshold in polymer/conducting particle composites. J Mater Sci Lett. 2000; 19:377–379.
Johner, N., Grimaldi, C., Balberg, I., Ryser, P. Transport exponent in a three-dimensional continuum tunnelling-percolation model. Phys Rev B. 2008; 77:174204.
Johner, N., Grimaldi, C., Maeder, T., Ryser, P. Optimal percolation of disordered segregated composites. Phys Rev E. 79, 2009. [020104(R)].
Jović, N., Dudić, D., Montone, A., Vittori Antisari, M., Mitrić, M., et al. Temperature dependence of the electrical conductivity of epoxy/expanded graphite nanosheet composites. Scripta Materialia. 2008; 58:846–849.
Kim, W.J., Taya, M., Yamada, K., Kamiya, N. Percolation study on electrical resistivity of SiC/Si3N4 composites with segregated distribution. J Appl Phys. 1998; 83:2593–2598.
Kirkpatrick, S. Percolation and conduction. Rev Mod Phys. 1973; 45:574–588.
Kogut, P.M., Straley, J.P. Distribution-induced non-universality of the percolation conductivity exponents. J Phys C. 1979; 12:2151–2159.
Kubový, A. A percolation model of the conduction threshold in thick-film resistors: segregated structures. J Phys D: Appl Phys. 1986; 19:2171–2183.
Kubový, A. Model of electric conductivity of thick-film resistors Part III. Temperature dependence of sheet resistivity. Ceramics-Silikáty. 1995; 39:1–40.
Kusy, R. Influence of particle size ratio on the continuity of aggregates. J Appl Phys. 1977; 48:5301–5305.
Kusy, A. Classical percolation threshold and resistance versus temperature behaviour of RuO2-glass films. Physica B. 1997; 240:226–241.
Lebovka, N., Lisunova, M., Mamunya, Ye P., Vygornitskii, N. Scaling in percolating behaviour in conductive–insulating composites with particles of different sizes. J Phys D: Appl Phys. 2006; 39:2264–2271.
Levin, G.A. Concentration dependence of hopping conductivity in granular metals. Phys Rev B. 1986; 34:6318–6321.
Li, G., Braunstein, L.A., Buldyrev, S.V., Havlin, S., Stanley, H.E. Transport and percolation theory in weighted networks. Phys Rev E. 75, 2007. [045103(R)].
Malliaris, A., Turner, D.T. Influence of particle size on the electrical resistivity of compacted mixtures of polymeric and metallic powders. J Appl Phys. 1971; 42:614–618.
McAlister, S.P., Inglis, A.D., Kayll, P.M. Conduction in cosputtered Au-SiO2 films. Phys Rev B. 1985; 31:5113–5120.
Nigro, B., Ambrosetti, G., Grimaldi, C., Maeder, T., Ryser, P. Transport properties of nonhomogeneous segregated composites. Phys Rev B. 2011; 83:064203.
Peng, D.L., Sumiyama, K., Konno, T.J., Hihara, T., Yamamuro, S. Characteristic transport properties of CoO-coated monodispersive Co cluster assemblies. Phys Rev B. 1999; 60:2093–2100.
Pflieger, R., Malki, M., Guari, Y., Larionova, J., Grandjean, A. Electrical conductivity of RuO2-borosilicate glasses: effect of the synthesis route. J Am Ceram Soc. 2009; 92:1560–1566.
Pike, G.E. Conductivity of thick-film (cermet) resistors as a function of metallic particle volume fraction. In: Garland J.C., Tanner D.B., eds. Electrical transport and optical properties of inhomogeneous media. New York: American Institute of Physics; 1978:366–371.
Pike, G.E., Seager, C.H. Electrical properties and conduction mechanisms of Ru-based thick-film (cermet) resistors. J Appl Phys. 1977; 48:5152–5169.
Roman, J., Pavlik, V., Flachbart, K., Adkins, C.J., Leib, J. Electronic transport in RuO2-based thick-film resistors at low temperatures. J Low Temp Phys. 1997; 108:373–382.
Sahimi, M. Heterogeneous Materials. New York: Springer; 2003.
Savvides, N., McAlister, S.P., Hurd, C.M., Shiozaki, I. Localization in the metallic regime of granular Cu-SiO2 films. Solid State Comm. 1982; 42:143–145.
Scher, H., Zallen, R. Critical density in percolation processes. J Chem Phys. 1970; 53:3759–3761.
Sheng, P., Sichel, E.K., Gittleman, J.I. Fluctuation-induced tunnelling conduction in carbon–polyvinylchloride composites. Phys Rev Lett. 1978; 40:1197–1200.
Sion, R.P., Atkinson, J.K., Turner, J.D. A novel model for the temperature characteristic of a thick-film piezoresistive sensor. Sensors and Actuators A. 1994; 41–42:460–464.
Stauffer, D., Aharoni, A. Introduction to Percolation Theory. London: Taylor & Francis; 1992.
Tamborin, M., Piccinini, S., Prudenziati, M., Morten, B. Piezoresistive properties of RuO2-based thick-film resistors: the effect of RuO2 grain size. Sensors and Actuators A. 1997; 58:159–164.
Vionnet-Menot, S., Grimaldi, C., Maeder, T., Strässler, S., Ryser, P. Tunneling-percolation origin of nonuniversality: theory and experiments. Phys Rev B. 2005; 71:064201.
Wang, J.F., Ogale, A.A. Simulation of percolation behavior of anisotropic short-fiber composites with a continuum model and non-cubic control geometry. Compos Sci Technol. 1993; 46:389–398.
Youngs, I.J. A geometrical pecolation model for non-spherical excluded volumes. J Phys D: Appl Phys. 2003; 36:738–747.
Zhang, J., Shklovskii, B.I. Density of states and conductivity of a granular metal or an array of quantum dots. Phys Rev B. 2004; 70:115317.