
Tracing
Once you identify what is taking too much time, you probably want to be able to know in more detail which methods are the culprits. You can do this by creating trace files with the help of a tracing-specific method, and then analyze them with the Traceview tool.
Debug.startMethodTracing()
Android provides the Debug.startMethodTracing() method to create trace files that can then be used with the Traceview tool to debug and profile your application. There are actually four variants of the Debug.startMethodTracing() method:
- startMethodTracing()
- startMethodTracing(String traceName)
- startMethodTracing(String traceName, int bufferSize)
- startMethodTracing(String traceName, int bufferSize, int flags)
The traceName parameter specifies the name of the file to write the trace information into. (If the file already exists it will be truncated.) You need to make sure your application has write access to this file. (By default, the file will be created in the sdcard directory unless an absolute path is given.) The bufferSize parameter specifies the maximum size of the trace file. Trace information can use a fair amount of space and your storage capacity may be limited so try to use a sensible value (default is 8MB). Android currently defines only one flag, Debug.TRACE_COUNT_ALLOCS, so the flags parameter should be set to either 0 or Debug.TRACE_COUNT_ALLOCS (to add the results from Debug.startAllocCounting() to the trace, that is, the number and aggregate size of memory allocations). Android also provides the Debug.stopMethodTracing() method, which, you would have guessed, stops the method tracing. The usage is very similar to time measurements seen earlier, as shown in Listing 6–5.
Listing 6–5. Enabling Tracing
    Debug.startMethodTracing(“/sdcard/awesometrace.trace”);


    // perform operation you want to trace here

    BigInteger fN = Fibonacci.computeRecursivelyWithCache(100000);


    Debug.stopMethodTracing();


    // now there should be a file named awesometrace.trace in /mnt/sdcard, get it in

Eclipse DDMS
The trace file will be saved onto your Android device (or the emulator), so you will need to copy the file from the device to your host machine, for example in Eclipse (using DDMS) or with the “adb pull” command.
Using the Traceview Tool
The Android SDK comes with a tool named Traceview, which can use these trace files and give you a graphical representation of the trace, as shown in Figure 6–1. You can find the Traceview tool in the SDK's tools directory and simply type traceview awesometrace.trace on a command line to start Traceview.
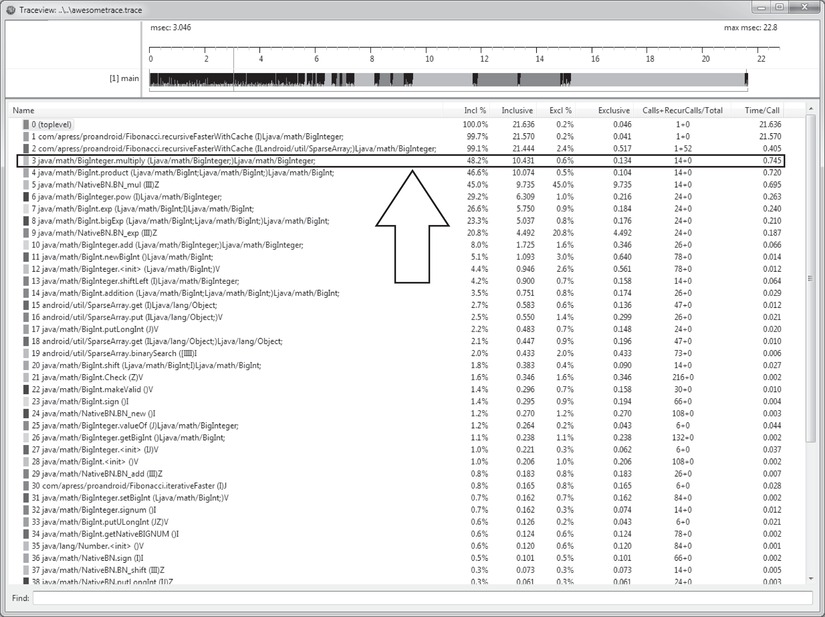
Figure 6–1. Traceview window
The trace basically contains the list of all the function calls together with how much time these calls took and how many were made. Seven columns are displayed:
- Name: the name of the method
- Incl %: the percentage of time spent in that method (including children methods)
- Inclusive: the time in milliseconds spent in that method (including children methods)
- Excl %: the percentage of time spent in that method (excluding children methods)
- Exclusive: the time in milliseconds spent in that method (excluding children methods)
- Calls+RecurCalls/Total: the number of calls and recursive calls
- Time/Call: the average time per call in milliseconds
For example, a total of 14 calls to BigInteger.multiply() were made for a total of 10.431 milliseconds, or 745 microseconds per call. Because the VM will run more slowly when tracing is enabled, you should not consider the time values as definitive numbers. Instead, use these time values simply to determine which method or run is faster.
If you click on a method name, Traceview will show you more detailed information for that specific method, as shown in Figure 6–2. This includes:
- Parents (the methods calling this method)
- Children (the methods called by this method)
- Parents while recursive (if method is recursive)
- Children while recursive (if method is recursive)
As you can see in Figure 6–2, most of the time is spent on four methods:
- BigInteger.multiply()
- BigInteger.pow()
- BigInteger.add()
- BigInteger.shiftLeft()
Even though we established where the bottlenecks were in Chapter 1 already, Traceview allows you to very quickly determine where they can be without having to perform any expansive research. In this particular case, you can quickly see that BigInteger.multiply() is where most of the time is spent, followed by BigInteger.pow(). This is not surprising as multiplications are intuitively more complicated than additions and shifts done by BigInteger.add() and BigInteger.shiftLeft().
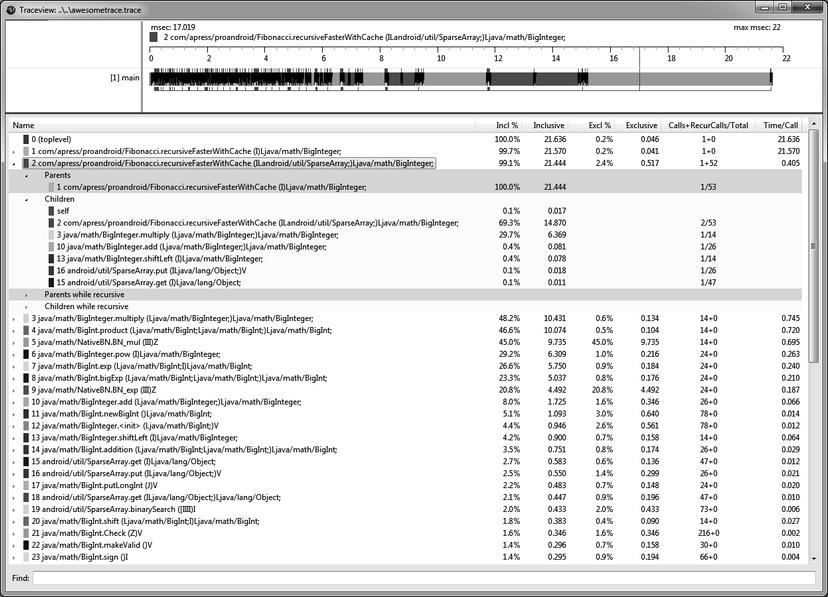
Figure 6–2. A method's detailed information
At the top of the window, you can see the timeline for the main thread. You can zoom in by selecting a certain region in this timeline, and zoom out by double-clicking on the time scale. Familiarize yourself with the Traceview tool and learn how to navigate from one method to another. Hint: it's easy. Just click on a method's name!
Because the Just-In-Time compiler is disabled when tracing is enabled, the results you get can be somewhat misleading. In fact, you may think a method takes a certain time when in reality it can be much faster since it can be compiled into native code by the Dalvik Just-In-Time compiler. Also, the trace won't show you how much time is spent in native functions. For example, Figure 6–1 shows calls to NativeBN.BN_mul() and NativeBN.BN_exp(), but if you click on these methods, you won't see what other methods they may call.
Traceview in DDMS
Another way to trace calls and use Traceview is to generate a trace file directly from the Eclipse DDMS perspective. After you select a specific process, you can click on the Start Method Profiling icon, and then click again to stop profiling. Once you stop profiling, the trace will be visible in the Debug perspective in Eclipse and it will be like using Traceview. Figure 6–3 shows how to start method profiling from the DDMS perspective, and Figure 6–4 shows you the method profiling view in the Debug perspective.
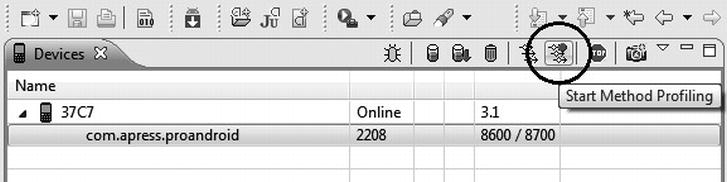
Figure 6–3. Starting method profiling from the DDMS perspective
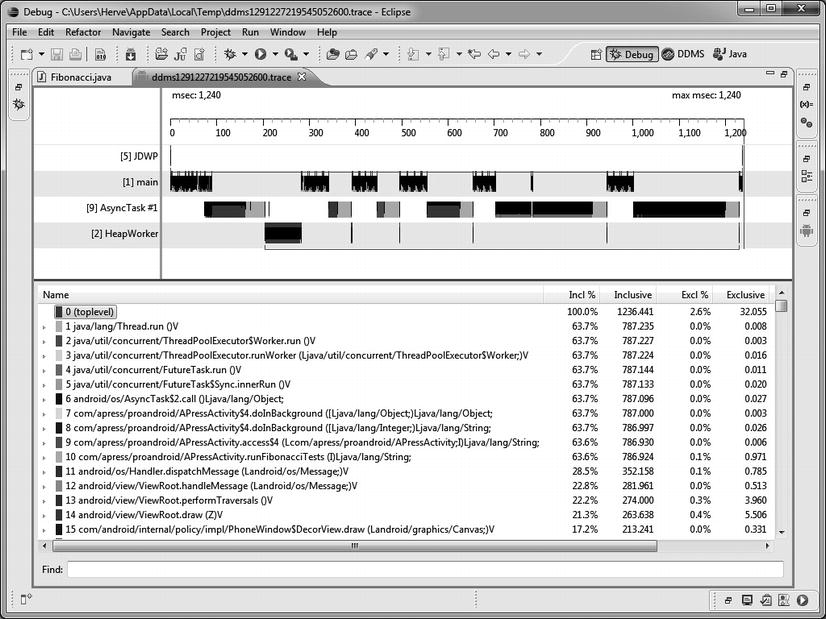
Figure 6–4. Method profiling in the Debug perspective
As you can see in Figure 6–4, timelines for multiple threads can be shown.
Traceview is not perfect, however it can give you great insight into what code is actually executed and where the bottlenecks may be. When it is time to achieve better performance, this should be one of your preferred tools to detect where you should focus your attention.
TIP: Remember to delete the trace files when you are done with your debugging and profiling. You can use the Eclipse DDMS perspective to delete files from your device.
Native Tracing
In addition to profiling Java methods with the startMethodTracing() APIs, Android also supports native tracing (including kernel code). Native tracing is also referred to as QEMU tracing. In this section you learn how to generate the QEMU trace files and how to convert them into a file Traceview can interpret..
To generate QEMU traces, you have to do two things:
- Start the emulator using the
–traceoption (for example, “emulator –trace mytrace –avd myavd”). - Start and then stop native tracing, either by calling
Debug.startNativeTracing()andDebug.stopNativeTracing(), or by pressing the F9 key (the first time will start tracing, the second time will stop tracing).
In the AVD's traces directory on your host machine, you will then find a mytrace directory containing several QEMU emulator trace files:
- qtrace.bb
- qtrace.exc
- qtrace.insn
- qtrace.method
- qtrace.pid
- qtrace.static
NOTE: QEMU is an open-source emulator. Refer to http://wiki.qemu.org for more information.
Generating Trace File For Traceview
To use the traces in Traceview like we did for Java methods, you need to generate a trace file that Traceview can understand. To do this, you will use the tracedmdump command (not to be confused with the dmtracedump SDK tool, which is a tool used to create the call stack as a tree diagram). The tracedmdump command is defined in the Android source code, in build/envsetup.sh. For access to this command, you have to download the Android source code and compile Android.
To download the full Android code, follow the instructions on:
http://source.android.com/source/downloading.html.
To compile Android, follow the instructions on
http://source.android.com/source/building.html
You can also compile your own emulator from the Android source code instead of relying on the one from the SDK. Once Android is compiled, you should have all the tools you need to create the trace file Traceview needs.
In the AVD's traces directory, you can now simply run tracedmdump mytrace, which will create a trace file you can open with Traceview, as shown in Figure 6–5. Make sure your path is set so that all the commands executed by tracedmdump can succeed. If tracedmdump fails with a “command not found” error message, it is likely your path is not set properly. For example, tracedmdump will call post_trace, which is located in the out/host/linux-x86/bin directory.
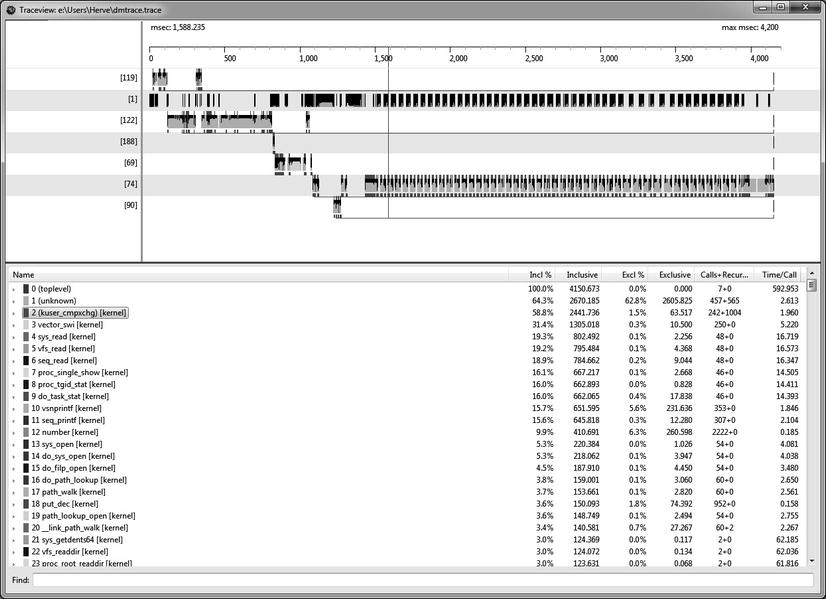
Figure 6–5. Native tracing with Traceview
While the user interface stays the same, what you actually see in Figure 6–5 is the list of native functions being called, such as vsnprintf() and sys_open(), respectively #10 and #13.
Two files representing the same data are actually created by tracedmdump:
- dmtrace
- dmtrace.html
The first file is to be used with Traceview while the second can be opened with any web browser, including Lynx.
NOTE: Many users report problems when using tracedmdump, and error messages are not always very clear. If you encounter an error, search for a solution on the Internet as it is very likely someone had the same problem and published a solution.
Sometimes simply having a real-time, human-readable description of what is happening in your application can help you tremendously. Logging messages have been used for a very long time before sophisticated debugging tools were invented, and many developers will heavily rely on logs to debug or profile applications.