
This chapter is something of a grab bag of features that build on the foundation of an OLAP cube to provide additional usability for end users. The first section, "Business Intelligence," includes those enhancements that can be added with the Business Intelligence Wizard, including time intelligence (period-to-date, rolling average, and so forth), account intelligence (asset, liability, income, expense), the unary operator (to indicate how values should be aggregated up a hierarchy), attribute ordering, and currency conversion.
Then you'll work with some of the tools available via the Calculations tab. You'll spend some time on calculated members, building measures that derive from other measures. A common example of a calculated measure is an average function, dividing a total value by the number of units (for instance, test scores divided by the number of students). This will also take us into the script organizer, where you'll look at some of the functions available there, and the template manager.
Named sets are also found on the Calculations tab, and provide a way of presenting a predefined collection of dimension members. You can either build a fixed set that is a common subset of members (for example, a group of location members that are manufacturing plants or retail stores), or a dynamic set that is determined on demand ("top sellers this year").
In the final section, you will look at four other areas of the Cube Designer. Key performance indicators (KPIs) provide a way to encapsulate business performance. A lot of the analysis performed on analytic data is to determine how a business is performing (or why it isn't performing). A key performance indicator is a quick, visual way to evaluate performance against a specified goal. Analysis Services enables you to define KPIs in a cube so that everyone is using the same metrics.
Actions are an interesting and, in my opinion, underused feature of Analysis Services. Actions are passed through to a client that is capable of implementing them. They are forwarded to the user, usually in a context menu, providing some kind of amplifying information regarding the selected data. For example, an action can launch a browser to a specific URL, or it may execute an MDX statement.
I showed you a little bit about perspectives earlier in the book. When you consider how vast a robust cube can get, working through all the various dimensions and measures can be painful. SSAS provides a way to filter all the features of a cube based on various functions. For example, a finance user will see only those dimensions, measures, actions, and so on that concern financial functions.
Translations provide a way to enable cubes for multilingual use. In the Translations tab, you can create a set of translated terms and phrases for the visible features of the cube.
So let's dig in and take a look at what we can do with our cubes.
You can add business intelligence features to a cube or a dimension by invoking the Business Intelligence Wizard, as shown in Figure 10-1. First, you need to either select your cube in the Solution Explorer, or ensure that your cube is open and selected in the Cube Designer. Invoke the wizard from the BIDS menu bar by clicking Cube
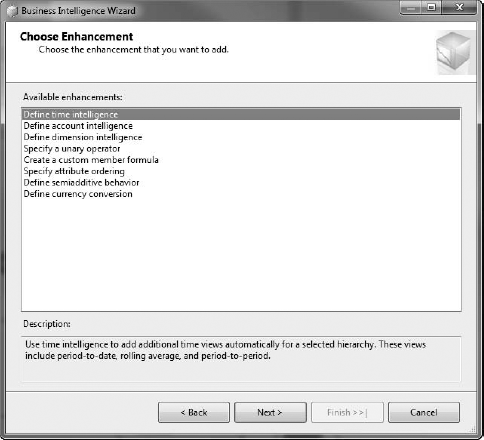
The wizard makes changes to the objects involved and their metadata to support the feature you're adding. If it's necessary to select a dimension, measure, or other object, the wizard will prompt you as appropriate.
The Time Intelligence Enhancement enables you to select a specific time hierarchy, and then select from a list of time-based calculations to add to that hierarchy. The calculations offered will depend on the hierarchy selected (for example, you can't add Year Over Year Growth to a fiscal-quarter hierarchy). The following list shows a few of the time calculations available to you via the wizard:
- Period to date:
These will give you shortcut calculations for year to date, semester to date, quarter, month, and 12 months to date. These will return the aggregation of a measure value from the beginning of the time period to the current date.
- Moving averages:
These will calculate an average for each date for the time period prior. For example, a three-month moving average will calculate the average from January through March for April, February through April for May, and so on.
- Periodic growth:
These provide either actual value or percentage change from one time period to another—for example, year over year. This calculates the year-to-date value for this year and the previous year and performs the comparison between the two of them.
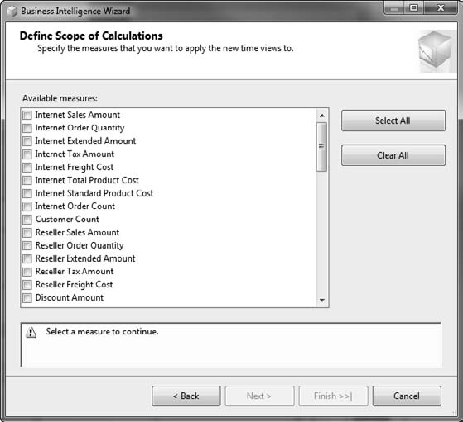
After selecting the calculations, you will have to select the measures you want the new time views applied to, as shown in Figure 10-2. Because every dimension on a measure increases the processing time when processing the cube (to calculate and preload aggregations), we want to be cautious when adding these calculated measures, and add them to the measures only where we truly need them for reporting.
After you select the measures and click Next, the final page of the wizard presents a summary of the changes to be made to the cube by the wizard. After you review these, click Finish, and the wizard makes the necessary changes to the cube's metadata:
Create the named calculation in the time dimension in the data source view (the underlying data source isn't affected).
Create a dimension attribute in the time dimension mapped to the new calculated column. The dimension attribute will have its
IsAggregatablevalue set tofalse, to indicate that the value needs to be calculated at each hierarchy level and can't just be summed up.In addition, a static default member will be created to be the default member for use when slicing the cube (remember that when you slice a cube, every dimension must have a member selected—making the default member here a static member aids scalability).
After those changes are made, you just have to deploy the cube and process it. The calculations will show up as an attribute hierarchy under the time dimension you selected in the wizard. You can then use them like any hierarchy and members.
Another enhancement available in the Business Intelligence Wizard is Define Account Intelligence. To understand account intelligence, consider an account book—columns of assets and liabilities. We add assets together and subtract liabilities; you'll look at how to handle this later in the "Unary Operators" section. Then there's the issue of income vs. assets: income is a recurring value that should be added together, but assets are fixed, and shouldn't. For example, retail receipts are recorded every day, and need to be added together to give the value for a month, a quarter, or a year. On the other hand, assets are recorded each month—15 motor pool cars on hand on January 1, February 1, March 1, and so forth. We can't total these numbers, or we'd end the year with 180 autos. So to report on our assets, we need to take the last number reported.
Account intelligence enables us to annotate a dimension to indicate how to handle various values in a measure so they are aggregated appropriately in a cube. You select a dimension in the wizard to apply the changes to (for example, the Account dimension), and then map the attributes of the dimension to the attributes that Analysis Services is expecting, as shown in Figure 10-3.
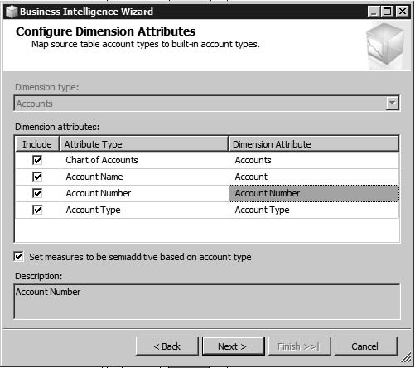
The next step is to map the Account Type in the dimension to the built-in account types, which SSAS understands how to handle. The options here are as follows:
- Asset or Liability:
These are fixed values that should not be aggregated over time. Instead Analysis Services takes the last nonempty value and then converts it based on the currency conversion rate.
- Expense or Income:
These values will be summed over time, and will also be converted based on the currency rate.
- Balance:
A recorded bookkeeping value, SSAS will take the last nonempty value, and convert it to local currency.
- Statistical:
A nonmonetary value, this does not aggregate over time and is not converted. If there is no value in place, none will be reported (no roll-up).
- Flow:
A numerical value that aggregates over time (such as income or expense), but is not converted with a currency exchange rate.
The comments about exchange rates are another factor in account business intelligence. This wizard establishes the metadata on accounts for use by the currency conversion put in place by the Currency Conversion Business Intelligence Wizard.
After the account attributes are defined, the final wizard page summarizes the changes to be made. Clicking the Finish button makes the changes. You will have to deploy and process the cube for the changes to take effect.
Dimension intelligence is the more abstract version of account intelligence. Essentially, both these functions assign well-known types to dimensions to normalize them and make them more recognizable. Then client applications can take advantage of the dimension in a standard way. For example, assigning the Product dimension type to the Product dimension, and the well-known attribute types to the attributes, could enable a client application to use the dimensions to fill catalog pages. Whereas account business intelligence triggers specific behaviors from Analysis Services itself, dimension intelligence tags only the dimension and attributes for use by other applications.
Part of working with a cube is to have the right data. But usually you'll want to do something with that data, manipulate it in different ways so that you can analyze it. You have the ability to manipulate data via predefined unary operators, and through custom expressions that you write yourself by using the Business Intelligence Wizard. You can order attributes in a dimension. You can even deal with the seemingly trivial, but really quite important issue of currency conversion.
Specifying a unary operator goes hand in hand with adding account intelligence to a cube. As I pointed out in the section on account intelligence, an accounts ledger will have income and expenses, assets and liabilities. In account intelligence, we specified that the first pair should be added over time, and the second pair should not.
What do we do in cases where we have income and expenses in a list of accounts? Income is added, and expenses subtracted. Assets have positive value, and liabilities are negative. How do we ensure that the proper signs are accounted for?
If you look at the accounts table that the dimension is based on (open the Adventure Works data source view, find the Accounts table, right-click, and select Explore Data), you'll see a column named Operator, as shown in Figure 10-4. Running the Unary Operator Enhancement enables you to map this attribute to a specific operator attribute that Analysis Services understands to apply when summing members of the hierarchy.
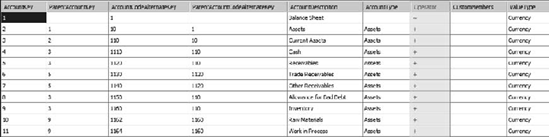
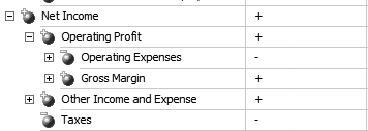
Figure 10-5 shows the Account dimension in the browser in BIDS. The column to the right shows the Unary Operator attribute, but more importantly, if you look at the icon to the left of each member, you'll see a small + or – sign, indicating how that member will operate when summed.
If you go to the cube browser in BIDS and pull the Accounts hierarchy to rows, and then pull Financial Reporting
The Create a Custom Member Formula enhancement, when chosen from the Business Intelligence Wizard, enables you to indicate a specific formula that will be used to define the members of a dimension. The custom member formula will be stored as an MDX statement in a column in the data source for the dimension. The wizard here is very straightforward; select a dimension, and then select the attribute that will use the custom formula, and the column where the formula is located.
The Attribute Ordering Enhancement is a quick way to clean up how you want all the attributes ordered in a dimension. You may not always want attributes ordered alphabetically or by the index. For example, you may want the abbreviations for items ordered in accordance with the full names of the members of the dimension.
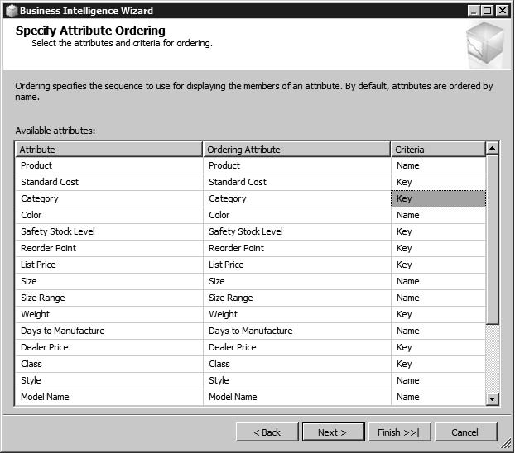
The wizard will (as usual) have you select a dimension, and then will present a list of attributes and allow you to select how to order them, as shown in Figure 10-6. For each attribute, you can select the attribute to order it by, and which aspect of that attribute (the key or the name) to order it by.
After making any changes, the Next button will take you to the standard summary page, and clicking Finish will affect the changes.
I mentioned currencies in the section on account intelligence. SQL Server Analysis Services has the ability to automatically convert currency in order to unify reporting. In order to do so, the currency conversion feature must be enabled by using this option in the BI Wizard.
After selecting the Currency Conversion option, the next page enables you to select the measure group that contains exchange rates to be used in the conversions, as shown in Figure 10-7. After you've selected an exchange rate measure, the wizard will list the values in the attribute group marked as destination currency to select a pivot currency.
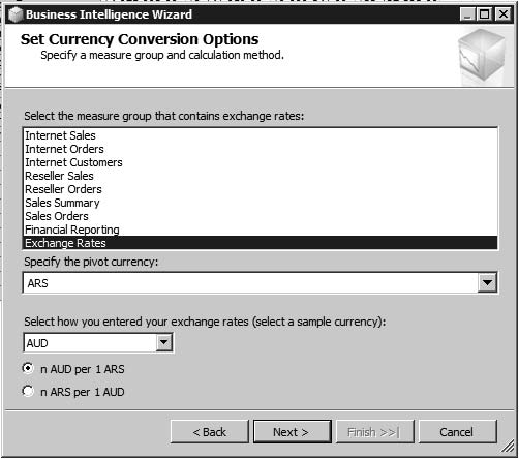
The pivot currency is the currency for which all the other exchange rates are defined. For example, if you choose US dollars (USD), then for USD in the exchange rate table, 1USD = 1USD. The next entry enables you to define in which direction the exchange rate is defined.
The next page of the wizard enables you to select where to apply the exchange rate metadata changes; you can select one or more measures, the Account hierarchy, or members of the Account hierarchy. After that, you select whether the cube is defined with one currency that needs to be converted to multiple local currencies, multiple local currencies that must be converted to a single central currency, or if conversions will happen between multiple currencies. Finally, you select where the destination currency code is defined in the measure, and what currencies it will be necessary to report on. Finish the wizard and reprocess the cube.
Next we're going to take a look at calculated measures and named sets. These are accessible on the toolbar of the Calculations tab. A typical view of the Calculations tab is shown in Figure 10-8, which displays the Script Organizer pane, the Calculation Tools pane, and the MDX Form view.
When there's no other way to make the numbers do what you need them to, you can always write MDX. Calculated measures enable you to create extended totals, represent taxes, perform averages, calculate net and gross values, and so on. After you've created a calculated measure, it's available just as any other measure.
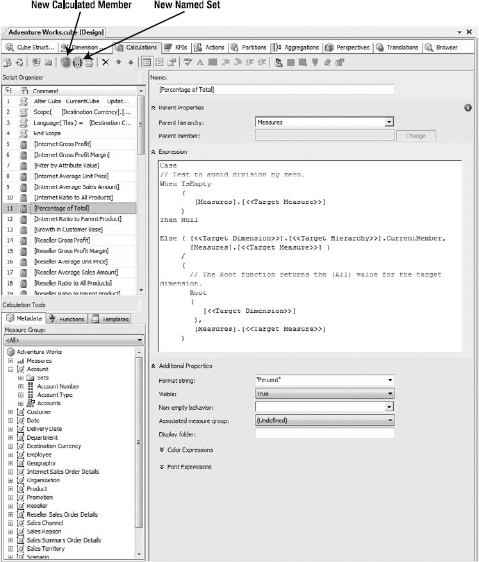
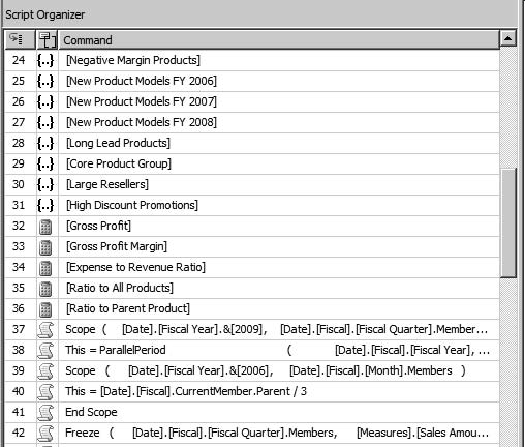
Open the AdventureWorks cube in BIDS, and then select the Calculations tab. This is where you'll find script commands, calculated members, and named sets (which are all defined with bits of MDX script). In the top left is the Script Organizer, which lists all the existing scripts, with an icon to indicate script command, calculated measure, or named set, as shown in Figure 10-9.
If you select any script with a calculator icon, you'll see the calculated measure window come up in the center. Shown in Figure 10-10 is the definition for [Internet Ratio to All Products]. You can see that you define the name and select a parent hierarchy, as well as a parent member in a multilevel hierarchy. At the bottom are formatting options: the format string, whether or not the member is visible, a folder to use, font, and color.
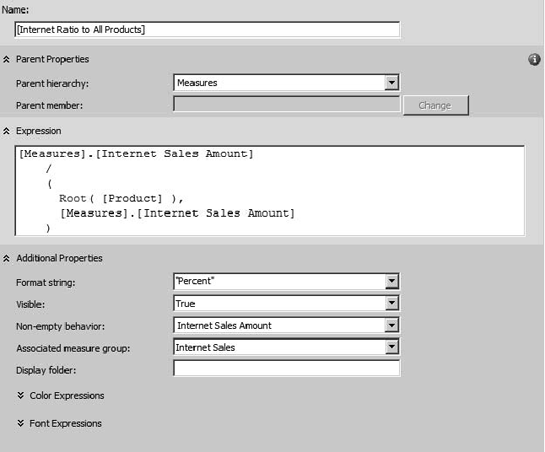
The Non-Empty Behavior setting and Associated Measure Group are used to point to a measure that SSAS can use as a guide if the calculated measure should be evaluated. If the cell in the associated measure group is empty, the calculated measure won't be evaluated.
Last but not least is the Expression in the center window. The expression is MDX. In this case, we have a pretty straightforward expression:
[Measures].[Internet Sales Amount]
    /
    (
      Root( [Product] ),
      [Measures].[Internet Sales Amount]
    )
This is saying that for any cell (sliced by any dimensions), the ratio of sales to all products is the Internet Sales Amount divided by value of the Internet Sales Amount at the root of the Product hierarchy. In other words, the ratio is the value of the current product, category, or subcategory divided by the total of products sold.
In the lower-left corner of BIDS is a pane of calculation tools. The Metadata tab lists all the objects in the cube; you can drag and drop to get an idea of proper syntax for defining measures, dimensions, and other objects. The Functions tab lists all the MDX functions available and is good as a quick reference. When you drag a function over, it will have a small bit of hint text indicating how it should be used. For example:
'Hierarchy'.ALLMEMBERS
Finally, the Templates tab lists some useful complex templates that you can use as a starting point if you need to go that route.
Named sets are essentially a collection of members. There are two types of named sets: static and dynamic. Static named sets have a fixed set of members. An example is the set Southeastern States, which consists of Florida, Georgia, Alabama, and South Carolina. There may be a specific set of products you always want to keep an eye on, or certain machines in the shop you want a report on.
The other type, dynamic named sets, offer a way to dynamically filter the members of a dimension based on some aspect of the measures. A classic example is Top 25 Selling Products. To create a named set, we simply enter the MDX expression that defines the set. For example, Top 25 Selling Products is as follows:
TopCount
    (
       [Product].[Product].[Product].Members,
       25,
       [Measures].[Sales Amount]
    )
This is pretty easy to figure out—this will return a set of the top 25 products based on the total sales. But notice that we're filtering based on the total sales amount; this will return our all-time top 25 selling products. If you want the top 25 products for a given year, you'll have to write a query and make that part of the SELECT statement.
In this final section, you will look at four other areas of the Cube Designer. Key performance indicators offer you several ways to measure and trend your business's performance, while actions can pass XMLA data from your cube to your OLAP client. You will finish this chapter with perspectives and translations.
Key performance indicators (KPIs) are metrics that enable you to define a target value for a specific measure value. A standard example is revenue. Every company has specific revenue targets, and they want to understand how they are performing relative to that target. One problem that many organizations have faced is differences in how a metric is defined. When you consider revenue, should returns be subtracted back out? What about recalls?
An important consideration here is that the actual definition isn't as critical as consistency. When you are trying to identify root-cause problems, the ability to compare "apples to apples" across an organization makes the difference between easy analysis and simply not being able to do any analysis.
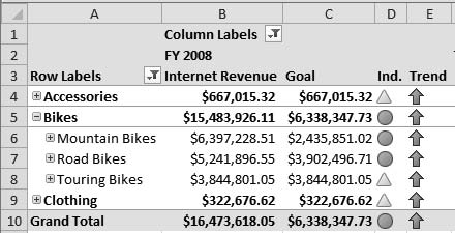
If we embed our metrics into our data mart, they are standardized across the data structure. If revenue is defined as product sales, not including tax, minus returns, but not deducting recalls, then by defining the metric in the cube, everyone will be on the same page. Also, by defining the KPI in the cube, we can get a uniform representation of the indicator in various user interfaces. In Figure 10-11, you can see as Analysis Services KPI in Excel.
KPIs are set up on the KPIs tab of the Cube Designer in BIDS. The lower-left pane is the Calculation Tools collection you learned about from the Calculations tab. In the top left is the KPI organizer, which lists all the KPIs in the cube. In the center is the KPI Designer. In the designer, you select the measure group for the KPI to be associated with (although because all the KPI metrics are MDX, you're not restricted to that measure group for defining value, goal, and so forth).
The Value Expression is very straightforward; this is generally going to be a measure value, although you could enter a calculation as well. The Goal Expression (target) may be a lookup from another table, a set of fixed values, or a calculation based on other measures (for example, the Internet Revenue KPI uses the Internet Sales Amount for the previous year plus ten percent).
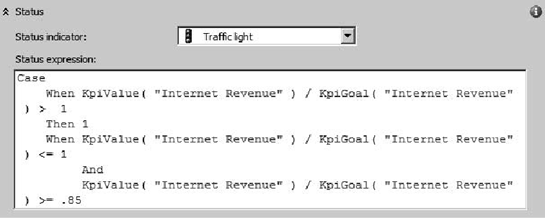
The Status, which drives the status indicator (shown in Figure 10-12), enables you to select an indicator type and then enter a status expression. Note the expression is a CASE statement that evaluates the value as compared to the target, and returns –1, 0, or 1. Each of those values will be translated by the display interface to match up to a state of the status indicator (in this case, –1 is Red, 0 is Yellow, and 1 is Green).
Note
An indicator is sent to the client via XMLA only as a text value (for example, Traffic light/Red). So there is likely to be some degree of visual difference in the user interface. But the essential part should be consistent as described.
The next section is a trend indicator. This works exactly like the status indicator—a graphical image and an MDX expression that returns values to set the appearance of the indicator. In this case, the indicator is an arrow that points up, across, or down to indicate the trend of the KPI. The MDX here, as you can see, compares the current value to the previous value.
The trend indicator uses the ParallelPeriod function to dynamically select the previous fiscal year. The member for the previous fiscal year, combined with the member for the KPI value, makes a tuple for the KPI value for the previous year. The equation then boils down to this:
(Current value – Previous Value)/Previous Value
This results in a normalized value for the trend—positive is up, and negative is down. The statement compares the normalized value to +/– .02 to allow for some rounding error on the "no change" arrow.
The additional properties allow for definition of a folder to organize the KPIs, assignment of a parent KPI to create a hierarchy, current time member to create a KPI that changes with the calendar, and weighting. When you have a collection of KPIs, you may want some considered more strongly than others when rolling them together. (Or give the KPI a weight of zero and it won't get rolled in.)
Note
Although it's great to have KPIs centralized in the Analysis Server, there are a lot of capabilities in a scorecard that aren't provided—custom indicators, multiple targets, associated reports, and so on. If you're interested in a more powerful scorecard platform, check out one of Philo's books: Pro PerformancePoint Server 2007 (Apress, 2008) if you're on MOSS 2007, or Building Integrated Business Intelligence Solutions with SQL Server 2008 R2 and Office 210 (McGraw-Hill, 210) if you're on SharePoint Server 210.
Very often in a business intelligence solution, you want to provide your end users with some type of amplifying detail— detailed chart for a measure value, a map to show the location of a store that's a member of a dimension, or a form with some of the attribute values for a member.
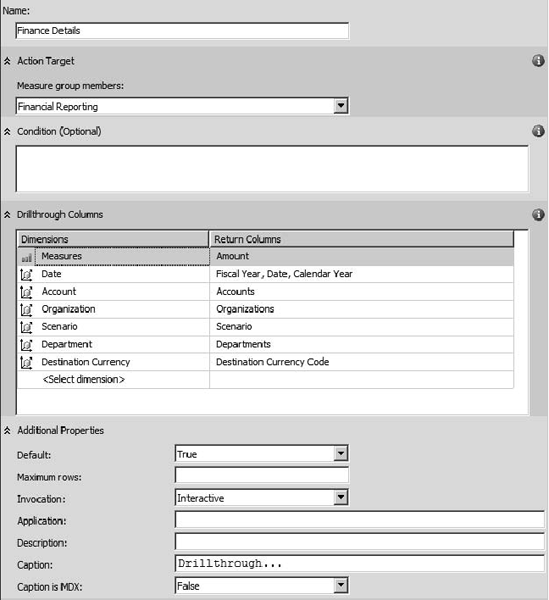
OLAP solutions have a standard metadata construct called an action that can be attached to a measure value. The data is passed to the client through XMLA; it's up to the client to implement the action in some form. Clients have various levels of compliance with SSAS actions. Your best bet is always to experiment directly with a client to see whether an action you are contemplating is implemented. Actions are defined on the Actions tab for the cube. There are three types of actions, defined when you create the action: general action, drillthrough action, and reporting action.
A drill-through action, shown in Figure 10-13, defines a record set to be returned to the client. When the user chooses to execute an action on a cell containing a measure value, SSAS will return a defined recordset of the underlying data values, with the columns defined in the Drillthrough Columns section. Also note the Condition section, which enables you to limit the scope of the recordset returned. For example, if there are 20 years of detailed manufacturing data in the data mart, you may not want end users trying to drill down on all 20 years worth of data. In that case, you could put a filter that would restrict drill-down data to the last two years. You can also limit the size of returned recordsets with the Maximum rows value.
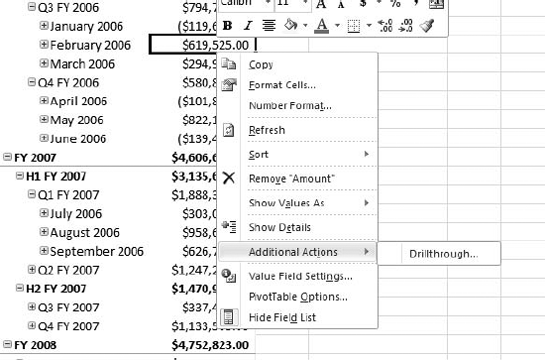
To execute the action, open the context menu for a value in Excel. Select the Additional Actions option, and you should see any available actions in the flyout, as shown in Figure 10-14. For the drill-through action, Excel will create a new sheet in the current workbook and place the data table there. You can have more than one action available for a given measure. All actions will be listed on the context menu.
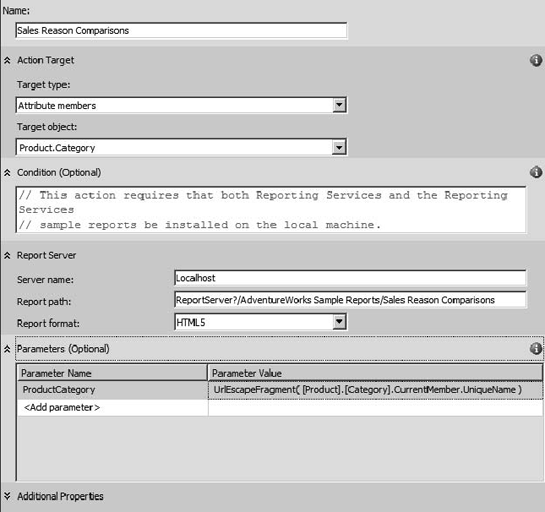
A reporting action will open a SQL Server Reporting Services report when invoked, as shown in Figure 10-15. Note that the Target type allows selecting from dimensions, members, and attributes. So you can create a report that shows, for example, the product data from a specific product if selected. You select the target type, and then the target object will populate with the appropriate objects to select from. Then you configure the report server and report, and add any parameters you need to add. (Most important—if you want a contextual report, you'll need to pass some kind of identifying information to the report!)
Finally, let's look at general actions; the designer is shown in Figure 10-16. With a general action, you can again select which type of object to apply it to (attribute members, cells, cube, dimension members, hierarchy, and hierarchy members, level and level members). After you select a target type, you can select the specific object from the Target Object drop-down.
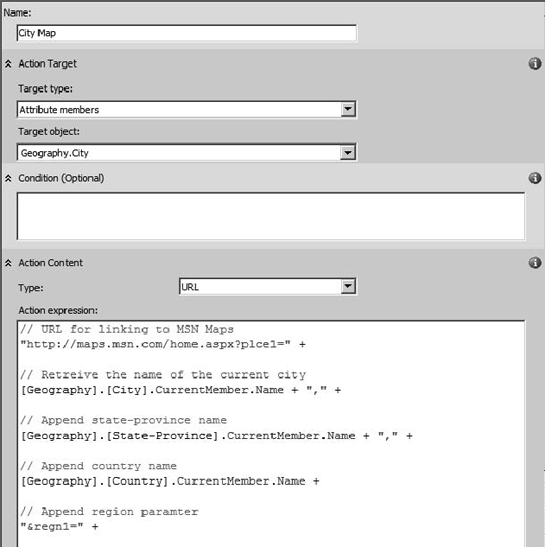
The action Type determines what will be returned to the client—data set, proprietary, row set, statement, or URL. The client will implement the action based on the action type. For example, the URL type will be launched into the default browser. Here are the specifics:
- Data set:
An MDX statement that parses to a multidimensional data set. The data set is passed to the client, which will act on it (perhaps opening another instance with the data set).
- Proprietary:
A string value (which can be dynamically built with MDX) that will be interpreted by the client application defined by the application string in the additional properties below the action expression.
- Rowset:
Similar to the data set, except in this case it returns a tabular data set.
- Statement:
A string that is a command to be executed by the client application.
- URL:
An MDX expression that renders a URL passed back to the client application (which can render it with a browser.)
And as I mentioned, the action expression is an MDX expression that renders the appropriate content for the action type selected. The City Map action in AdventureWorks is a URL type, and the expression assembles a URL string for MSN maps, with the city, state, and country from the Geography hierarchy.
That sums it up for actions. The most important thing to remember, again, is that how various actions are supported depends on the client application, so be sure to test early and test often!
The AdventureWorks database has dozens of measures, dozens of dimensions (each of which may have one or more attributes and hierarchies), 12 KPIs, and a handful of actions. If you consider a finance analyst who is concerned with a few account measures and product-oriented dimensions, the rest of the cubes will just be taking up space in his or her UI. Worst case is that the analyst will have to scroll up and down to get the right objects for any given report or query.
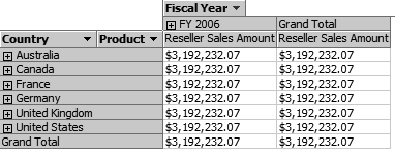
Also, as you've worked with the AdventureWorks cube, you've probably tripped over a few times where selecting the wrong dimension for a given measure doesn't do what you expect it to, as shown in Figure 10-17. This is a pivot table using Reseller Sales Amount and the Customer Geography. Because there is no relationship between the Customer dimension and the measure group, it doesn't break down the values, and you get the repeating top-level values.
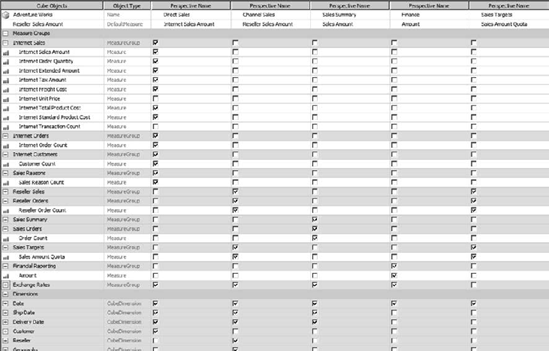
Perspectives can solve both of these problems by offering a user a more targeted selection of objects to work with. The Perspective Designer is shown in Figure 10-18. Creating a perspective is pretty straightforward; after you create it and name it, it's just a matter of deselecting the objects you don't want displayed (when you create a new perspective, all objects are selected by default).
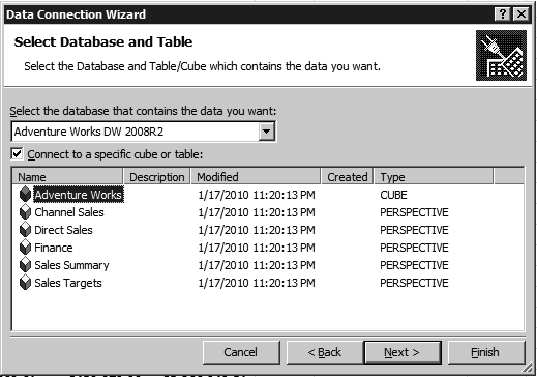
After you've created the perspective, deployed it, and processed it, it's available to end users. The perspective looks just like a cube, as seen in the Data Connection Wizard from Excel in Figure 10-19. Now our Finance user has a Finance perspective. By selecting that, the user will have a more focused view of the AdventureWorks cube for their purposes.
The final cube feature we're going to look at is the translation. This is very straightforward. The Translation Designer is shown in Figure 10-20. You can add as many languages as you choose, and entry for each language is optional. This will provide your non-English-speaking users a cube with labels in their native language.
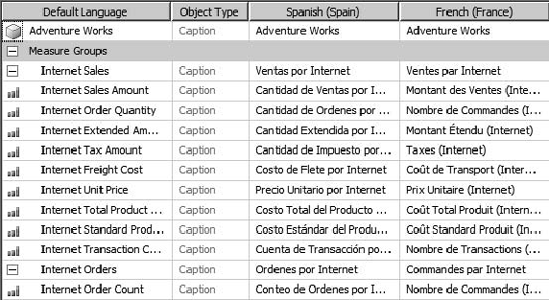
In addition to the caption (display title) for each object, many objects have other aspects that can be translated—descriptions, display folder names, and a few other labels. Client applications can then request data in a specific language. If the client does not request a specific language or the computer doesn't have the language requested, then the default translation is used.
As I said, this was a whirlwind tour around many of the ancillary objects in Analysis Services. Although they're not all directly in service of the cube, they really show the power of this platform. In the next chapter, you're going to look at figuring out answers when you don't even know what question to ask—by data mining.