

Quality Management1

20.0 INTRODUCTION
During the past twenty years, there has been a revolution in quality. Improvements have occurred not only in product quality, but also in leadership quality and project management quality. The changing views of quality appear in Table 20-1.
Unfortunately, it takes an economic disaster or a recession to get management to recognize the need for improved quality. Prior to the recession of 1979–1982, Ford, General Motors, and Chrysler viewed each other as the competition rather than the Japanese. Prior to the recession of 1989–1994, high-tech engineering companies never fully recognized the need for shortening product development time and the relationship between project management, total quality management, and concurrent engineering.
The push for higher levels of quality appears to be customer driven. Customers are now demanding:
- Higher performance requirements
- Faster product development
- Higher technology levels
- Materials and processes pushed to the limit
- Lower contractor profit margins
- Fewer defects/rejects
One of the critical factors that can affect quality is market expectations. The variables that affect market expectations include:
- Salability: the balance between quality and cost
- Produceability: the ability to produce the product with available technology and workers, and at an acceptable cost
- Social acceptability: the degree of conflict between the product or process and the values of society (i.e., safety, environment)
- Operability: the degree to which a product can be operated safely
- Availability: the probability that the product, when used under given conditions, will perform satisfactorily when called upon
- Reliability: the probability of the product performing without failure under given conditions and for a set period of time
- Maintainability: the ability of the product to be retained in or restored to a performance level when prescribed maintenance is performed
TABLE 20-1. CHANGING VIEWS OF QUALITY
| Past | Present |
|
|
Customer demands are now being handled using total quality management (TQM). Total quality management is an ever-improving system for integrating various organizational elements into the design, development, and manufacturing efforts, providing cost-effective products or services that are fully acceptable to the ultimate customer. Externally, TQM is customer oriented and provides for more meaningful customer satisfaction. Internally, TQM reduces production line bottlenecks and operating costs, thus enhancing product quality while improving organizational morale.
20.1 DEFINITION OF QUALITY
PMBOK® Guide, 4th Edition
Chapter 8 Introduction
Mature organizations readily admit that they cannot accurately define quality. The reason is that quality is defined by the customer. The Kodak definition of quality is those products and services that are perceived to meet or exceed the needs and expectations of the customer at a cost that represents outstanding value. The ISO 9000 definition is “the totality of feature and characteristics of a product or service that bears on its ability to satisfy stated or implied needs.” Terms such as fitness for use, customer satisfaction, and zero defects are goals rather than definitions.
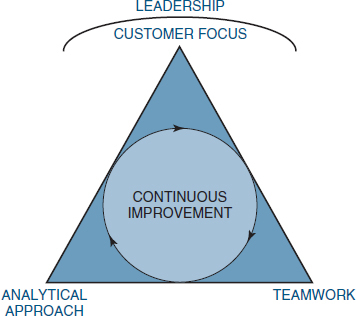
FIGURE 20-1. Kodak's five quality principles.
Most organizations view quality more as a process than a product. To be more specific, it is a continuously improving process where lessons learned are used to enhance future products and services in order to
- Retain existing customers
- Win back lost customers
- Win new customers
Therefore, companies are developing quality improvement processes. Figure 20-1 shows the five quality principles that support Kodak's quality policy. Figure 20-2 shows a more detailed quality improvement process. These two figures seem to illustrate that organizations are placing more emphasis on the quality process than on the quality product and, therefore, are actively pursuing quality improvements through a continuous cycle.
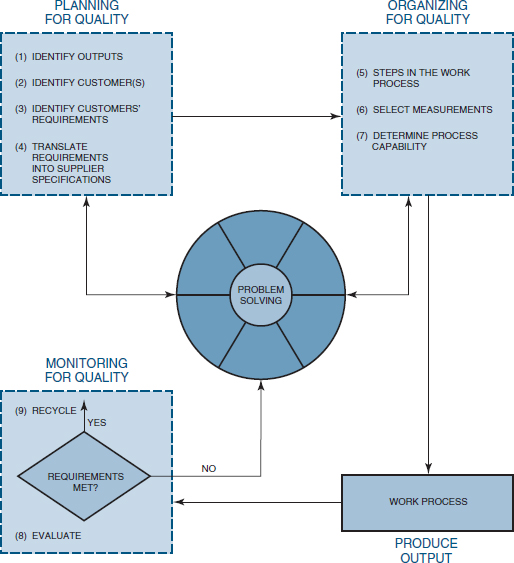
FIGURE 20-2. The quality improvement process. (Source unknown.)
20.2 THE QUALITY MOVEMENT
PMBOK® Guide, 4th Edition
Chapter 8 Introduction
During the past hundred years, the views of quality have changed dramatically. Prior to World War I, quality was viewed predominantly as inspection, sorting out the good items from the bad. Emphasis was on problem identification. Following World War I and up to the early 1950s, emphasis was still on sorting good items from bad. However, quality control principles were now emerging in the form of:
- Statistical and mathematical techniques
- Sampling tables
- Process control charts
From the early 1950s to the late 1960s, quality control evolved into quality assurance, with its emphasis on problem avoidance rather than problem detection. Additional quality assurance principles emerged, such as:
- The cost of quality
- Zero-defect programs
- Reliability engineering
- Total quality control
Today, emphasis is being placed on strategic quality management, including such topics as:
- Quality is defined by the customer.
- Quality is linked with profitability on both the market and cost sides.
- Quality has become a competitive weapon.
- Quality is now an integral part of the strategic planning process.
- Quality requires an organization-wide commitment.
Although many experts have contributed to the success of the quality movement, the three most influential contributors are W. Edwards Deming, Joseph M. Juran, and Phillip B. Crosby. Dr. Deming pioneered the use of statistics and sampling methods from 1927 to 1940 at the U.S. Department of Agriculture. During these early years, Dr. Deming was influenced by Dr. Shewhart, and later applied Shewhart's Plan/Do/Check/Act cycle to clerical tasks. Figure 20-3 shows the Deming Cycle for Improvement.
Deming believed that the reason companies were not producing quality products was that management was preoccupied with “today” rather than the future. Deming postulated that 85 percent of all quality problems required management to take the initiative and change the process. Only 15 percent of the quality problems could be controlled by the workers on the floor. As an example, the workers on the floor were not at fault because of the poor quality of raw materials that resulted from management's decision to seek out the lowest cost suppliers. Management needed to change the purchasing policies and procedures and develop long-term relationships with vendors.

FIGURE 20-3. The Deming Cycle for Improvement.
Processes had to be placed under statistical analysis and control to demonstrate the repeatability of quality. Furthermore, the ultimate goals should be a continuous refinement of the processes rather than quotas. Statistical process control charts (SPCs) allowed for the identification of common cause and special (assignable) cause variations. Common cause variations are inherent in any process. They include poor lots of raw material, poor product design, unsuitable work conditions, and equipment that cannot meet the design tolerances. These common causes are beyond the control of the workers on the floor and therefore, for improvement to occur, actions by management are necessary.
Special or assignable causes include lack of knowledge by workers, worker mistakes, or workers not paying attention during production. Special causes can be identified by workers on the shop floor and corrected, but management still needs to change the manufacturing process to reduce common cause variability.
Deming contended that workers simply cannot do their best. They had to be shown what constitutes acceptable quality and that continuous improvement is not only possible, but necessary. For this to be accomplished, workers had to be trained in the use of statistical process control charts. Realizing that even training required management's approval, Deming's lectures became more and more focused toward management and what they must do.
Dr. Juran began conducting quality control courses in Japan in 1954, four years after Dr. Deming. Dr. Juran developed his 10 Steps to Quality Improvement (see Table 20-2), as well as the Juran Trilogy: Quality Improvement, Quality Planning, and Quality Control. Juran stressed that the manufacturer's view of quality is adherence to specifications but the customer's view of quality is “fitness for use.” Juran defined five attributes of “fitness for use.”
TABLE 20-2. VARIOUS APPROACHES TO QUALITY IMPROVEMENT

- Quality of design: There may be many grades of quality
- Quality of conformance: Provide the proper training; products that maintain specification tolerances; motivation
- Availability: reliability (i.e., frequency of repairs) and maintainability (i.e., speed or ease of repair)
- Safety: The potential hazards of product use
- Field use: This refers to the way the product will be used by the customer
Dr. Juran also stressed the cost of quality (Section 20.8) and the legal implications of quality. The legal aspects of quality include:
- Criminal liability
- Civil liability
- Appropriate corporate actions
- Warranties
Juran believes that the contractor's view of quality is conformance to specification, whereas the customer's view of quality is fitness for use when delivered and value. Juran also admits that there can exist many grades of quality. The characteristics of quality can be defined as:
- Structural (length, frequency)
- Sensory (taste, beauty, appeal)
- Time-oriented (reliability, maintainability)
- Commercial (warrantee)
- Ethical (courtesy, honesty)
The third major contributor to quality was Phillip B. Crosby. Crosby developed his 14 Steps to Quality Improvement (see Table 20-2) and his Four Absolutes of Quality:
- Quality means conformance to requirements.
- Quality comes from prevention.
- Quality means that the performance standard is “zero defects.”
- Quality is measured by the cost of nonconformance.
Crosby found that the cost of not doing things right the first time could be appreciable. In manufacturing, the price of nonconformance averages 40 percent of operating costs.
20.3 COMPARISON OF THE QUALITY PIONEERS
Deming's definition of quality is “continuous improvement.” Although variations cannot be entirely eliminated, we can learn more about them and eventually reduce them. The ultimate goal obviously is zero defects, but this error-free work may not be economically feasible or practical.
Juran believes that for quality to improve, we must resolve “sporadic” problems and “chronic” problems. Sporadic problems are short-term problems that generate sudden changes for the worse in quality; techniques exist for identifying and controlling them.
TABLE 20-3. COMPARISON OF THE EXPERTS

“Chronic” problems, on the other hand, may require scientific breakthrough to achieve higher levels of quality. Chronic problems exist because workers may not accept change and refuse to admit that there may be a better way of doing things. Solving chronic problems requires breakthrough projects, specific targets usually established on a yearly basis, strong and visible senior management support, and the use of quality experts to lead the company-wide quality improvement programs. Unlike Deming, who avoids the use of targets and quotas, Juran's objective is to get management to accept the habit of an annual quality improvement program based upon well-defined targets.
Juran's method for determining the cost of quality, therefore, suggests that the pursuit of quality will pay for itself only up to a certain point, and beyond that point costs may rise significantly.
Crosby argues that the cost of quality includes only the nonconformance costs, whereas Juran includes both conformance and nonconformance costs. Crosby's argument is that the conformance costs of prevention and appraisal are not really the cost of quality but more so the cost of doing business. Therefore, Crosby argues that quality is free, and the only associated costs of quality should be those of nonconformance. Crosby does not emphasize analytical techniques other than measurement methods for nonconformance costs, and he relies heavily upon motivation and the role of senior management.
Table 20-3 compares the approach to quality of the three experts. Although all three emphasize the need for quality and the importance/role of senior management, each goes about it differently.
20.4 THE TAGUCHI APPROACH2
PMBOK® Guide, 4th Edition
8.1.2.5 Design of Experiments
After World War II the allied forces found that the quality of the Japanese telephone system was extremely poor and totally unsuitable for long-term communication purposes. To improve the system, the allied command recommended that Japan establish research facilities similar to the Bell Laboratories in the United States in order to develop a state-of-the-art communication system. The Japanese founded the Electrical Communication Laboratories (ECL) with Dr. Taguchi in charge of improving the R&D productivity and enhancing product quality. He observed that a great deal of time and money was expended in engineering experimentation and testing. Little emphasis was given to the process of creative brainstorming to minimize the expenditure of resources.
Dr. Taguchi started to develop new methods to optimize the process of engineering experimentation. He developed techniques that are now known as the Taguchi Methods. His greatest contribution lies not in the mathematical formulation of the design of experiments, but rather in the accompanying philosophy. His approach is more than a method to lay out experiments. His is a concept that has produced a unique and powerful quality improvement discipline that differs from traditional practices.
These concepts are:
- Quality should be designed into the product and not inspected into it.
- Quality is best achieved by minimizing the deviation from a target. The product should be so designed that it is immune to uncontrollable environmental factors.
- The cost of quality should be measured as a function of deviation from the standard and the losses should be measured system-wide.
Taguchi built on Deming's observation that 85 percent of poor quality is attributable to the manufacturing process and only 15 percent to the worker. Hence, he developed manufacturing systems that were “robust” or insensitive to daily and seasonal variations of environment, machine wear, and other external factors. The three principles were his guides in developing these systems, testing the factors affecting quality production, and specifying product parameters.
Taguchi believed that the better way to improve quality was to design and build it into the product. Quality improvement starts at the very beginning, that is, during the design stages of a product or a process, and continues through the production phase. He proposed an “off-line” strategy for developing quality improvement in place of an attempt to inspect quality into a product on the production line. He observed that poor quality cannot be improved by the process of inspection, screening, and salvaging. No amount of inspection can put quality back into the product; it merely treats a symptom. Therefore, quality concepts should be based upon, and developed around, the philosophy of prevention. The product design must be so robust that it is immune to the influence of uncontrolled environmental factors on the manufacturing processes.
His second concept deals with actual methods of effecting quality. He contended that quality is directly related to deviation of a design parameter from the target value, not to conformance to some fixed specifications. A product may be produced with properties skewed toward one end of an acceptance range yet show shorter life expectancy. However, by specifying a target value for the critical property and developing manufacturing processes to meet the target value with little deviation, the life expectancy may be much improved.
His third concept calls for measuring deviations from a given design parameter in terms of the overall life-cycle costs of the product. These costs would include the cost of scrap, rework, inspection, returns, warranty service calls, and/or product replacement. These costs provide guidance regarding the major parameters to be controlled.
Limitations
The most severe limitation of the Taguchi method is the need for timing with respect to product/process development. The technique can only be effective when applied early in the design of the product/process system. After the design variables are determined and their nominal values are specified, experimental design may not be cost-effective. Also, though the method has wide-ranging applications, there are situations in which classical techniques are better suited; in simulation studies involving factors that vary in a continuous manner, such as the torsional strength of a shaft as a function of its diameter, the Taguchi method may not be a proper choice.
Selecting Design Parameters for Reduced Variation
Taguchi strives to attain quality by reducing the variation around the target. In an effort to reduce variations, he searched for techniques that allow variability to be reduced without necessarily eliminating the causes of variation. Often in an industrial setting, totally removing the causes of variation can be expensive. A no-cost or low-cost solution may be achieved by adjusting the levels and controlling the variation of other factors. This is what Taguchi tries to do through his parameter design approach where there is no cost or low cost in reducing variability. Furthermore, the cost savings realized far exceed the cost of additional experiments needed to reduce variations.

FIGURE 20-4. Factors and levels for a pound cake experiment.

FIGURE 20-5. A Taguchi experiment flow diagram. Source: Ranjit Roy, A Primer on the Taguchi Method (Dearborn, MI: Society of Manufacturing Engineers, 1990), p. 231. Reproduced by permission.
The Taguchi method is most effective when applied to experiments with multiple factors. But the concept of selecting the proper levels of design factors, and reducing the variation of performance around the optimum/target value, can be easily illustrated through an example.
Consider a baking process. Assume several bakers are given the same ingredients to bake a pound cake, the object being to produce the best-tasting cake. Within limits, they can adjust the amount of ingredients, but they can only use the ingredients provided. They are to make the best cake within available design parameters. Taguchi's approach would be to design an experiment considering all baking ingredients and other influencing factors such as baking temperature, baking time, oven type (if a variable), and so on.
The idea is to combine the factors at appropriate levels, each within the respective acceptable range, to produce the best result and yet exhibit minimum variation around the optimum result. Our objective is to determine the right proportions of the five major ingredients—eggs, butter, milk, flour, and sugar—so that the recipe will produce the best cake most of the time. Based on past experience, the working ranges of these factors are established at the levels shown in Figure 20-4. At this point we face the following questions. How do we determine the right combination? How many experiments do we need to run and in what combination? Figure 20-5 shows a Taguchi experiment flow diagram.
20.5 THE MALCOLM BALDRIGE NATIONAL QUALITY AWARD
PMBOK® Guide, 4th Edition
Chapter 8 Introduction
To become a world-class competitor, companies need a model to integrate the continuous improvement tools into a system that involves participative cross-functional implementation. In 1987, this need was recognized at the national level with the establishment of the Malcolm Baldrige National Quality Award. The award is presented to those companies that have achieved a level of world-class competition through quality management of products and services.
The criteria for the award include:
- The leadership category: Examines primarily how the senior executives create and sustain a clear and visible quality value system along with a supporting management system to guide all activities of the company. Also examines the senior executives' and the company's leadership and support of quality developments both inside and outside the company.
- The strategic planning category: Examines how the company sets strategic directions, and how it determines key action plans. Also examines how the plans are translated into an effective performance management system.
- The customer and market focus category: Examines how the company determines requirements and expectations of customers and markets. Also examines how the company enhances relationships with customers and determines their satisfaction.
- The information and analysis category: Examines the management and effectiveness of the use of data and information to support key company processes and the company's performance management system.
- The human resource development and management category: Examines how the workforce is enabled to develop and utilize its full potential, aligned with the company's objectives. Also examines the company's efforts to build and maintain an environment conducive to performance excellence, full participation, and personal and organizational growth.
- The process management category: Examines the key aspects of process management, including customer-focused design, product, and service delivery processes, support processes, and supplier and partnering processes involving all work units. The category examines how key processes are designed, effectively managed, and improved to achieve better performance.
- The business results category: Examines the company's performance and improvement in key business areas: customer satisfaction, financial and marketplace performance, human resource, supplier and partner performance, and operational performance. Also examined are performance levels relative to competitors.
Some companies that have been honored with the award include IBM, General Motors, Xerox, Kodak, AT&T, Westinghouse, Federal Express, Ritz-Carlton, Armstrong Building Products, and Motorola. Generally speaking, only two or three companies a year win the award.
20.6 ISO 9000
The International Organization for Standardization (ISO), based in Geneva, Switzerland, is a consortium of approximately 100 of the world's industrial nations. The American National Standards Institute (ANSI) represents the United States. ISO 9000 is not a set of standards for products or services, nor is it specific to any one industry. Instead, it is a quality system standard applicable to any product, service, or process anywhere in the world.
The information included in the ISO 9000 series includes:
ISO 9000: This defines the key terms and acts as a road map for the other standards within the series.
ISO 9001: This defines the model for a quality system when a contractor demonstrates the capability to design, produce, and install products or services.
ISO 9002: This is a quality system model for quality assurance in production and installation.
ISO 9003: This is a quality system model for quality assurance in final inspection and testing.
ISO 9004: This provides quality management guidelines for any organization wishing to develop and implement a quality system. Guidelines are also available to determine the extent to which each quality system model is applicable.
There are several myths concerning the ISO 9000 series. First, ISO 9000 is not a European standard, although it may be necessary to do business within the European Community. ISO 9000 is based on American quality standards that are still being used. Second, ISO 9000 is not a paperwork nightmare. Although documentation is a necessary requirement, the magnitude of the documentation is less than most people believe. Third, becoming ISO 9000 certified does not guarantee that your organization will produce quality products or services. Instead, it confirms that the appropriate system is in place.
ISO 9000 is actually a three-part, never-ending cycle including planning, controlling, and documentation. Planning is required to ensure that the objectives, goals, authority, and responsibility relationships of each activity are properly defined and understood. Controlling is required to ensure that the goals and objectives are met, and that problems are anticipated or averted through proper corrective actions. Documentation is used predominantly for feedback on how well the quality management system is performing to satisfy customer's needs and what changes may be necessary.
There always exists the question of how ISO 9000 relates to the Malcolm Baldrige Award. ISO 9000 requirements fall predominantly into the “quality assurance of products and services” section of the Malcolm Baldrige Award. It does touch the other six sections in varying degrees.
ISO 9000 provides minimum requirements needed for certification. The Malcolm Baldrige National Quality Award (MBNQA) tries to identify the “best in class.” Organizations wishing to improve quality are encouraged to consider practices of and benchmark against past recipients of the MBNQA as “role models.”
The International Organization for Standardization has recently developed the ISO 14000 series standards. ISO 14000 is an evolving series that provides business management with the structure for managing environmental impacts, including the basic management system, performance evaluation, auditing, labeling, and life-cycle assessment.
20.7 QUALITY MANAGEMENT CONCEPTS
The project manager has the ultimate responsibility for quality management on the project. Quality management has equal priority with cost and schedule management. However, the direct measurement of quality may be the responsibility of the quality assurance department or the assistant project manager for quality. For a labor-intensive project, management support (i.e., the project office) is typically 12–15 percent of the total labor dollars of the project. Approximately 3–5 percent can be attributed to quality management. Therefore, as much as 20–30 percent of all the labor in the project office could easily be attributed to quality management.
From a project manager's perspective, there are six quality management concepts that should exist to support each and every project. They include:
- Quality policy
- Quality objectives
- Quality assurance
- Quality control
- Quality audit
- Quality program plan
Ideally, these six concepts should be embedded within the corporate culture.
Quality Policy
The quality policy is a document that is typically created by quality experts and fully supported by top management. The policy should state the quality objectives, the level of quality acceptable to the organization, and the responsibility of the organization's members for executing the policy and ensuring quality. A quality policy would also include statements by top management pledging its support to the policy. The quality policy is instrumental in creating the organization's reputation and quality image.
Many organizations successfully complete a good quality policy but immediately submarine the good intentions of the policy by delegating the implementation of the policy to lower-level managers. The implementation of the quality policy is the responsibility of top management. Top management must “walk the walk” as well as “talk the talk.” Employees will soon see through the ruse of a quality policy that is delegated to middle managers while top executives move onto “more crucial matters that really impact the bottom line.”
A good quality policy will:
- Be a statement of principles stating what, not how
- Promote consistency throughout the organization and across projects
- Provide an explanation to outsiders of how the organization views quality
- Provide specific guidelines for important quality matters
- Provide provisions for changing/updating the policy
Quality objectives are a part of an organization's quality policy and consist of specific objectives and the time frame for completing them. The quality objectives must be selected carefully. Selecting objectives that are not naturally possible can cause frustration and disillusionment. Examples of acceptable quality objectives might be: to train all members of the organization on the quality policy and objectives before the end of the current fiscal year, to set up baseline measurements of specific processes by the end of the current quarter, to define the responsibility and authority for meeting the organization's quality objectives down to each member of the organization by the end of the current fiscal year, etc.
Good quality objectives should:
- Be obtainable
- Define specific goals
- Be understandable
- State specific deadlines
Quality Assurance
PMBOK® Guide, 4th Edition
8.2 Quality Assurance
Quality assurance is the collective term for the formal activities and managerial processes that attempt to ensure that products and services meet the required quality level. Quality assurance also includes efforts external to these processes that provide information for improving the internal processes. It is the quality assurance function that attempts to ensure that the project scope, cost, and time functions are fully integrated.
The Project Management Institute Guide to the Body of Knowledge (PMBOK)® refers to quality assurance as the management section of quality management. This is the area where the project manager can have the greatest impact on the quality of his project. The project manager needs to establish the administrative processes and procedures necessary to ensure and, often, prove that the scope statement conforms to the actual requirements of the customer. The project manager must work with his team to determine which processes they will use to ensure that all stakeholders have confidence that the quality activities will be properly performed. All relevant legal and regulatory requirements must also be met.
A good quality assurance system will:
- Identify objectives and standards
- Be multifunctional and prevention oriented
- Plan for collection and use of data in a cycle of continuous improvement
- Plan for the establishment and maintenance of performance measures
- Include quality audits
Quality Control
Quality control is a collective term for activities and techniques, within the process, that are intended to create specific quality characteristics. Such activities include continually monitoring processes, identifying and eliminating problem causes, use of statistical process control to reduce the variability and to increase the efficiency of processes. Quality control certifies that the organization's quality objectives are being met.
The PMBOK® refers to quality control as the technical aspect of quality management. Project team members who have specific technical expertise on the various aspects of the project play an active role in quality control. They set up the technical processes and procedures that ensure that each step of the project provides a quality output from design and development through implementation and maintenance. Each step's output must conform to the overall quality standards and quality plans, thus ensuring that quality is achieved.
A good quality control system will:
- Select what to control
- Set standards that provide the basis for decisions regarding possible corrective action
- Establish the measurement methods used
- Compare the actual results to the quality standards
- Act to bring nonconforming processes and material back to the standard based on the information collected
- Monitor and calibrate measuring devices
- Include detailed documentation for all processes
Quality Audit
PMBOK® Guide, 4th Edition
8.2.2.2 Quality Audit
A quality audit is an independent evaluation performed by qualified personnel that ensures that the project is conforming to the project's quality requirements and is following the established quality procedures and policies.
A good quality audit will ensure that:
- The planned quality for the project will be met.
- The products are safe and fit for use.
- All pertinent laws and regulations are followed.
- Data collection and distribution systems are accurate and adequate.
- Proper corrective action is taken when required.
- Improvement opportunities are identified.
Quality Plan
PMBOK® Guide, 4th Edition
8.1.3.1 Quality Plan
The quality plan is created by the project manager and project team members by breaking down the project objectives into a work breakdown structure. Using a treelike diagramming technique, the project activities are broken down into lower-level activities until specific quality actions can be identified. The project manager then ensures that these actions are documented and implemented in the sequence that will meet the customer's requirements and expectations. This enables the project manager to assure the customer that he has a road map to delivering a quality product or service and therefore will satisfy the customer's needs.
A good quality plan will:
- Identify all of the organization's external and internal customers
- Cause the design of a process that produces the features desired by the customer
- Bring in suppliers early in the process
- Cause the organization to be responsive to changing customer needs
- Prove that the process is working and that quality goals are being met
20.8 THE COST OF QUALITY
PMBOK® Guide, 4th Edition
8.1.2.2 Cost of Quality
To verify that a product or service meets the customer's requirements requires the measurement of the costs of quality. For simplicity's sake, the costs can be classified as “the cost of conformance” and “the cost of nonconformance.” Conformance costs include items such as training, indoctrination, verification, validation, testing, maintenance, calibration, and audits. Nonconforming costs include items such as scrap, rework, warranty repairs, product recalls, and complaint handling.
Trying to save a few project dollars by reducing conformance costs could prove disastrous. For example, an American company won a contract as a supplier of Japanese parts. The initial contract called for the delivery of 10,000 parts. During inspection and testing at the customer's (i.e., Japanese) facility, two rejects were discovered. The Japanese returned all 10,000 components to the American supplier stating that this batch was not acceptable. In this example, the nonconformance cost could easily be an order of magnitude greater than the conformance cost. The moral is clear: Build it right the first time. Another common method to classify costs includes the following:
- Prevention costs are the up-front costs oriented toward the satisfaction of customer's requirements with the first and all succeeding units of product produced without defects. Included in this are typically such costs as design review, training, quality planning, surveys of vendors, suppliers, and subcontractors, process studies, and related preventive activities.
- Appraisal costs are costs associated with evaluation of product or process to ascertain how well all of the requirements of the customer have been met. Included in this are typically such costs as inspection of product, lab test, vendor control, in-process testing, and internal–external design reviews.
- Internal failure costs are those costs associated with the failure of the processes to make products acceptable to the customer, before leaving the control of the organization. Included in this area are scrap, rework, repair, downtime, defect evaluation, evaluation of scrap, and corrective actions for these internal failures.
- External failure costs are those costs associated with the determination by the customer that his requirements have not been satisfied. Included are customer returns and allowances, evaluation of customer complaints, inspection at the customer, and customer visits to resolve quality complaints and necessary corrective action.
Figure 20-6 shows the expected results of the total quality management system on quality costs. Prevention costs are expected to actually rise as more time is spent in prevention activities throughout the organization. As processes improve over the long run, appraisal costs will go down as the need to inspect in quality decreases. The biggest savings will come from the internal failure areas of rework, scrap, reengineering, redo, and so on. The additional time spent in up-front design and development will really pay off here. And, finally, the external costs will also come down as processes yield first-time quality on a regular basis. The improvements will continue to affect the company on a long-term basis in both improved quality and lower costs. Also, as project management matures, there should be further decreases in the cost of both maintaining quality and developing products.

FIGURE 20-6. Total quality cost.
Figure 20-6 shows that prevention costs can increase. This is not always the case. Prevention costs actually decrease without sacrificing the purpose of prevention if we can identify and eliminate the costs associated with waste, such as waste due to
- Rejects of completed work
- Design flaws
- Work in progress
- Improperly instructed manpower
- Excess or noncontributing management (who still charge time to the project)
- Improperly assigned manpower
- Improper utilization of facilities
- Excessive expenses that do not necessarily contribute to the project (i.e., unnecessary meetings, travel, lodgings, etc.)
Another important aspect of Figure 20-6 is that 50 percent or more of the total cost of quality can be attributed to the internal and external failure costs. Complete elimination of failures may seem like an ideal solution but may not be cost-effective. As an example, see Figure 20-7. There are assumptions in the development of this figure. First, the cost of failure (i.e., nonconformance) approaches zero as defects become fewer and fewer. Second, the conformance costs of appraisal and prevention approach infinity as defects become fewer and fewer.
If the ultimate goal of a quality program is to continuously improve quality, then from a financial standpoint, quality improvement may not be advisable if the positive economic return becomes negative. Juran argued that as long as the per unit cost for prevention and appraisal were less expensive than nonconformance costs, resources should be assigned to prevention and appraisal. But when prevention and appraisal costs begin to increase the per unit cost of quality, then the policy should be to maintain quality. The implication here is that zero defects may not be a practical solution since the total cost of quality would not be minimized.
Figure 20-6 shows that the external failure costs are much lower than the internal failure costs. This indicates that most of the failures are being discovered before they leave the functional areas or plants. This is particularly important if we consider the life-cycle cost model discussed in Section 14.19. We showed that typical life-cycle costs are:
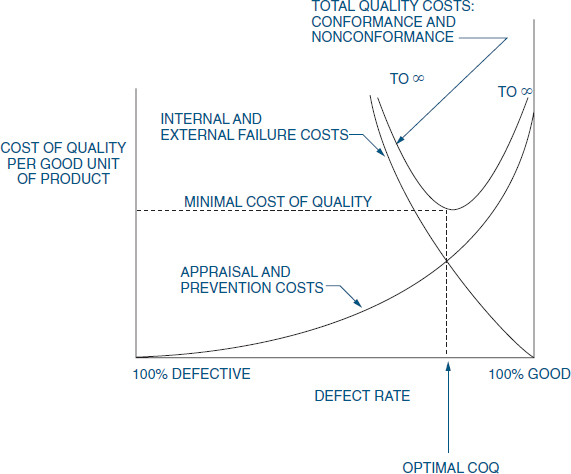
FIGURE 20-7. Minimizing the costs of quality (COQ).
- R&D: 12 percent
- Acquisition: 28 percent
- Operations and support: 60 percent
Since 60 percent of the life-cycle cost occurs after the product is put into service, then small increases in the R&D and acquisition areas could generate major cost savings in operation and support due to better design, higher quality, less maintenance, and so forth.
20.9 THE SEVEN QUALITY CONTROL TOOLS3
PMBOK® Guide, 4th Edition
8.3 Perform Quality Control
Over the years, statistical methods have become prevalent throughout business, industry, and science. With the availability of advanced, automated systems that collect, tabulate, and analyze data, the practical application of these quantitative methods continues to grow.
More important than the quantitative methods themselves is their impact on the basic philosophy of business. The statistical point of view takes decision-making out of the subjective autocratic decision-making arena by providing the basis for objective decisions based on quantifiable facts. This change provides some very specific benefits:
- Improved process information
- Better communication
- Discussion based on facts
- Consensus for action
- Information for process changes
Statistical process control (SPC) takes advantage of the natural characteristics of any process. All business activities can be described as specific processes with known tolerances and measurable variances. The measurement of these variances and the resulting information provide the basis for continuous process improvement. The tools presented here provide both a graphical and measured representation of process data. The systematic application of these tools empowers business people to control products and processes to become world-class competitors.
The basic tools of statistical process control are data figures, Pareto analysis, cause-and-effect analysis, trend analysis, histograms, scatter diagrams, and process control charts. These basic tools provide for the efficient collection of data, identification of patterns in the data, and measurement of variability. Figure 20-8 shows the relationships among these seven tools and their use for the identification and analysis of improvement opportunities. We will review these tools and discuss their implementation and applications.

FIGURE 20-8. The seven quality control tools.
Data Tables
Data tables, or data arrays, provide a systematic method for collecting and displaying data. In most cases, data tables are forms designed for the purpose of collecting specific data. These tables are used most frequently where data are available from automated media. They provide a consistent, effective, and economical approach to gathering data, organizing them for analysis, and displaying them for preliminary review. Data tables sometimes take the form of manual check sheets where automated data are not necessary or available. Data figures and check sheets should be designed to minimize the need for complicated entries. Simple-to-understand, straightforward tables are a key to successful data gathering.
Figure 20-9 is an example of an attribute (pass/fail) data figure for the correctness of invoices. From this simple check sheet, several data points become apparent. The total number of defects is 34. The highest number of defects is from supplier A, and the most frequent defect is incorrect test documentation. We can subject these data to further analysis by using Pareto analysis, control charts, and other statistical tools.

FIGURE 20-9. Check sheet for material receipt and inspection.
In this check sheet, the categories represent defects found during the material receipt and inspection function. The following defect categories provide an explanation of the check sheet:
- Incorrect invoices: The invoice does not match the purchase order.
- Incorrect inventory: The inventory of the material does not match the invoice.
- Damaged material: The material received was damaged and rejected.
- Incorrect test documentation: The required supplier test certificate was not received and the material was rejected.
Cause-and-Effect Analysis
After identifying a problem, it is necessary to determine its cause. The cause-and-effect relationship is at times obscure. A considerable amount of analysis often is required to determine the specific cause or causes of the problem.
Cause-and-effect analysis uses diagramming techniques to identify the relationship between an effect and its causes. Cause-and-effect diagrams are also known as fishbone diagrams. Figure 20-10 demonstrates the basic fishbone diagram. Six steps are used to perform a cause-and-effect analysis.
Step 1. Identify the problem. This step often involves the use of other statistical process control tools, such as Pareto analysis, histograms, and control charts, as well as brainstorming. The result is a clear, concise problem statement.
Step 2. Select interdisciplinary brainstorming team. Select an interdisciplinary team, based on the technical, analytical, and management knowledge required to determine the causes of the problem.
PMBOK® Guide, 4th Edition
8.3.2 Perform Quality Control—Tools and Techniques
8.3.2.1 Cause-and-Effect Diagram
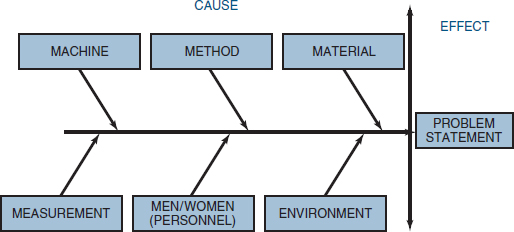
FIGURE 20-10. Cause-and-effect diagram.
Step 3. Draw problem box and prime arrow. The problem contains the problem statement being evaluated for cause and effect. The prime arrow functions as the foundation for their major categories.
Step 4. Specify major categories. Identify the major categories contributing to the problem stated in the problem box. The six basic categories for the primary causes of the problems are most frequently personnel, method, materials, machinery, measurements, and environment, as shown in Figure 20-10. Other categories may be specified, based on the needs of the analysis.
Step 5. Identify defect causes. When you have identified the major causes contributing to the problem, you can determine the causes related to each of the major categories. There are three approaches to this analysis: the random method, the systematic method, and the process analysis method.
Random method. List all six major causes contributing to the problem at the same time. Identify the possible causes related to each of the categories, as shown in Figure 20-11.
Systematic method. Focus your analysis on one major category at a time, in descending order of importance. Move to the next most important category only after completing the most important one. This process is diagrammed in Figure 20-12.
Process analysis method. Identify each sequential step in the process and perform cause-and-effect analysis for each step, one at a time. Figure 20-13 represents this approach.
Step 6. Identify corrective action. Based on (1) the cause-and-effect analysis of the problem and (2) the determination of causes contributing to each major category, identify corrective action. The corrective action analysis is performed in the same manner as the cause-and-effect analysis. The cause-and-effect diagram is simply reversed so that the problem box becomes the corrective action box. Figure 20-14 displays the method for identifying corrective action.


FIGURE 20-12. Systematic method.
Histogram
A histogram is a graphical representation of data as a frequency distribution. This tool is valuable in evaluating both attribute (pass/fail) and variable (measurement) data. Histograms offer a quick look at the data at a single point in time; they do not display variance or trends over time. A histogram displays how the cumulative data look today. It is useful in understanding the relative frequencies (percentages) or frequency (numbers) of the data and how those data are distributed. Figure 20-15 illustrates a histogram of the frequency of defects in a manufacturing process.
Pareto Analysis
A Pareto diagram is a special type of histogram that helps us to identify and prioritize problem areas. The construction of a Pareto diagram may involve data collected from data figures, maintenance data, repair data, parts scrap rates, or other sources. By identifying types of nonconformity from any of these data sources, the Pareto diagram directs attention to the most frequently occurring element.
PMBOK® Guide, 4th Edition
8.3.2.5 Perform Quality Control—Tools and Techniques
There are three uses and types of Pareto analysis. The basic Pareto analysis identifies the vital few contributors that account for most quality problems in any system. The comparative Pareto analysis focuses on any number of program options or actions. The weighted Pareto analysis gives a measure of significance to factors that may not appear significant at first—such additional factors as cost, time, and criticality.

FIGURE 20-13. Process analysis method.

FIGURE 20-14. Identify corrective action.
The basic Pareto analysis chart provides an evaluation of the most frequent occurrences for any given data set. By applying the Pareto analysis steps to the material receipt and inspection process described in Figure 20-16, we can produce the basic Pareto analysis demonstrated in Figure 20-17. This basic Pareto analysis quantifies and graphs the frequency of occurrence for material receipt and inspection and further identifies the most significant, based on frequency.
A review of this basic Pareto analysis for frequency of occurrences indicates that supplier A is experiencing the most rejections with 38 percent of all the failures.
Pareto analysis diagrams are also used to determine the effect of corrective action, or to analyze the difference between two or more processes and methods. Figure 20-18 displays the use of this Pareto method to assess the difference in defects after corrective action.
PMBOK® Guide, 4th Edition
8.3.2.4 Histrogram

FIGURE 20-15. Histogram for variables.

FIGURE 20-16. Basic Pareto analysis.
Scatter Diagrams
PMBOK® Guide, 4th Edition
8.3.2.7 Perform Quality Control—Tools and Techniques
Another pictorial representation of process control data is the scatter plot or scatter diagram. A scatter diagram organizes data using two variables: an independent variable and a dependent variable. These data are then recorded on a simple graph with X and Y coordinates showing the relationship between the variables. Figure 20-19 displays the relationship between two of the data elements from solder qualification test scores. The independent variable, experience in months, is listed on the X axis. The dependent variable is the score, which is recorded on the Y axis.

FIGURE 20-17. Basic Pareto analysis.

FIGURE 20-18. Comparative Pareto analysis.
These relationships fall into several categories, as shown in Figure 20-20. In the first scatter plot there is no correlation—the data points are widely scattered with no apparent pattern. The second scatter plot shows a curvilinear correlation demonstrated by the U shape of the graph. The third scatter plot has a negative correlation, as indicated by the downward slope. The final scatter plot has a positive correlation with an upward slope.
From Figure 20-19 we can see that the scatter plot for solder certification testing is somewhat curvilinear. The least and the most experienced employees scored highest, whereas those with an intermediate level of experience did relatively poorly. The next tool, trend analysis, will help clarify and quantify these relationships.
PMBOK® Guide, 4th Edition
8.3.2.7 Perform Quality Control—Tools and Techniques

FIGURE 20-19. Solder certification test scores.
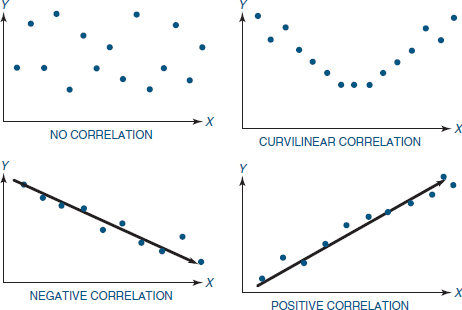
FIGURE 20-20. Scatter plot correlation.
Trend Analysis
Trend analysis is a statistical method for determining the equation that best fits the data in a scatter plot. Trend analysis quantifies the relationships of the data, determines the equation, and measures the fit of the equation to the data. This method is also known as curve fitting or least squares.
Trend analysis can determine optimal operating conditions by providing an equation that describes the relationship between the dependent (output) and independent (input) variables. An example is the data set concerning experience and scores on the solder certification test (see Figure 20-21).
The equation of the regression line, or trend line, provides a clear and understandable measure of the change caused in the output variable by every incremental change of the input or independent variable. Using this principle, we can predict the effect of changes in the process.
One of the most important contributions that can be made by trend analysis is forecasting. Forecasting enables us to predict what is likely to occur in the future. Based on the regression line we can forecast what will happen as the independent variable attains values beyond the existing data.
Control Charts
The use of control charts focuses on the prevention of defects, rather than their detection and rejection. In business, government, and industry, economy and efficiency are always best served by prevention. It costs much more to produce an unsatisfactory product or service than it does to produce a satisfactory one. There are many costs associated with producing unsatisfactory goods and services. These costs are in labor, materials, facilities, and the loss of customers. The cost of producing a proper product can be reduced significantly by the application of statistical process control charts.

FIGURE 20-21. Scatter plot solder quality and certification score.
PMBOK® Guide, 4th Edition
8.3.2.2 Perform Quality Control—Tools and Techniques
Control Charts and the Normal Distribution
The construction, use, and interpretation of control charts is based on the normal statistical distribution as indicated in Figure 20-22. The centerline of the control chart represents the average or mean of the data (![]() ). The upper and lower control limits (UCL and LCL), respectively, represent this mean plus and minus three standard deviations of the data (
). The upper and lower control limits (UCL and LCL), respectively, represent this mean plus and minus three standard deviations of the data (![]() ± 3s). Either the lowercase s or the Greek letter σ (sigma) represents the standard deviation for control charts.
± 3s). Either the lowercase s or the Greek letter σ (sigma) represents the standard deviation for control charts.
The normal distribution and its relationship to control charts is represented on the right of the figure. The normal distribution can be described entirely by its mean and standard deviation. The normal distribution is a bell-shaped curve (sometimes called the Gaussian distribution) that is symmetrical about the mean, slopes downward on both sides to infinity, and theoretically has an infinite range. In the normal distribution 99.73 percent of all measurements lie within ![]() + 3s and
+ 3s and ![]() − 3s; this is why the limits on control charts are called three-sigma limits.
− 3s; this is why the limits on control charts are called three-sigma limits.
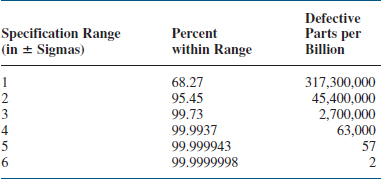
Companies like Motorola have embarked upon a six-sigma limit rather than a three-sigma limit. The benefit is shown in Table 20-4. With a six-sigma limit, only two defects per billion are allowed. Maintaining a six-sigma limit can be extremely expensive unless the cost can be spread out over, say, 1 billion units produced.
Control chart analysis determines whether the inherent process variability and the process average are at stable levels, whether one or both are out of statistical control (not stable), or whether appropriate action needs to be taken. Another purpose of using control charts is to distinguish between the inherent, random variability of a process and the variability attributed to an assignable cause. The sources of random variability are often referred to as common causes. These are the sources that cannot be changed readily, without significant restructuring of the process. Special cause variability, by contrast, is subject to correction within the process under process control.

FIGURE 20-22. The control chart and the normal curve.
- Common cause variability or variation: This source of random variation is always present in any process. It is that part of the variability inherent in the process itself. The cause of this variation can be corrected only by a management decision to change the basic process.
TABLE 20-4. ATTRIBUTES OF THE NORMAL (STANDARD) DISTRIBUTION
- Special cause variability or variation: This variation can be controlled at the local or operational level. Special causes are indicated by a point on the control chart that is beyond the control limit or by a persistent trend approaching the control limit.
To use process control measurement data effectively, it is important to understand the concept of variation. No two product or process characteristics are exactly alike, because any process contains many sources of variability. The differences between products may be large, or they may be almost immeasurably small, but they are always present. Some sources of variation in the process can cause immediate differences in the product, such as a change in suppliers or the accuracy of an individual's work. Other sources of variation, such as tool wear, environmental changes, or increased administrative control, tend to cause changes in the product or service only over a longer period of time.
To control and improve a process, we must trace the total variation back to its sources: common cause and special cause variability. Common causes are the many sources of variation that always exist within a process that is in a state of statistical control. Special causes (often called assignable causes) are any factors causing variation that cannot be adequately explained by any single distribution of the process output, as would be the case if the process were in statistical control. Unless all the special causes of variation are identified and corrected, they will continue to affect the process output in unpredictable ways.
The factors that cause the most variability in the process are the main factors found on cause-and-effect analysis charts: people, machines, methodology, materials, measurement, and environment. These causes can either result from special causes or be common causes inherent in the process.
- The theory of control charts suggests that if the source of variation is from chance alone, the process will remain within the three-sigma limits.
- When the process goes out of control, special causes exist. These need to be investigated, and corrective action must be taken.
Control Chart Types
PMBOK® Guide, 4th Edition
8.3.2.2 Perform Quality Control—Tools and Techniques
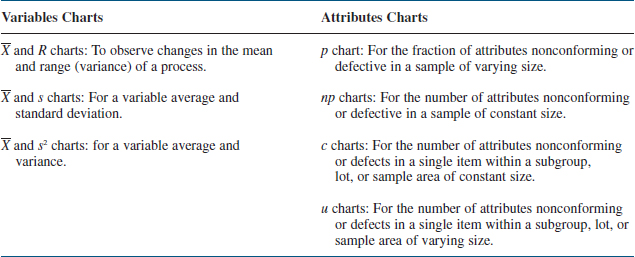
Just as there are two types of data, continuous and discrete, there are two types of control charts: variable charts for use with continuous data and attribute charts for use with discrete data. Each type of control chart can be used with specific types of data. Table 20-5 provides a brief overview of the types of control charts and their applications.
Variables Charts. Control charts for variables are powerful tools that we can use when measurements from a process are variable. Examples of variable data are the diameter of a bearing, electrical output, or the torque on a fastener.
As shown in Table 20-5, ![]() and R charts are used to measure control processes whose characteristics are continuous variables such as weight, length, ohms, time, or volume. The p and np charts are used to measure and control processes displaying attribute characteristics in a sample. We use p charts when the number of failures is expressed as a fraction, or np charts when the failures are expressed as a number. The c and u charts are used to measure the number or portion of defects in a single item. The c control chart is applied when the sample size or area is fixed, and the u chart when the sample size or area is not fixed.
and R charts are used to measure control processes whose characteristics are continuous variables such as weight, length, ohms, time, or volume. The p and np charts are used to measure and control processes displaying attribute characteristics in a sample. We use p charts when the number of failures is expressed as a fraction, or np charts when the failures are expressed as a number. The c and u charts are used to measure the number or portion of defects in a single item. The c control chart is applied when the sample size or area is fixed, and the u chart when the sample size or area is not fixed.
TABLE 20-5. TYPES OF CONTROL CHARTS AND APPLICATIONS
Attribute Charts. Although control charts are most often thought of in terms of variables, there are also versions for attributes. Attribute data have only two values (conforming/nonconforming, pass/fail, go/no-go, present/absent), but they can still be counted, recorded, and analyzed. Some examples are: the presence of a required label, the installation of all required fasteners, the presence of solder drips, or the continuity of an electrical circuit. We also use attribute charts for characteristics that are measurable, if the results are recorded in a simple yes/no fashion, such as the conformance of a shaft diameter when measured on a go/no-go gauge, or the acceptability of threshold margins to a visual or gauge check.
It is possible to use control charts for operations in which attributes are the basis for inspection, in a manner similar to that for variables but with certain differences. If we deal with the fraction rejected out of a sample, the type of control chart used is called a p chart. If we deal with the actual number rejected, the control chart is called an np chart. If articles can have more than one nonconformity, and all are counted for subgroups of fixed size, the control chart is called a c chart. Finally, if the number of nonconformities per unit is the quantity of interest, the control chart is called a u chart.
The power of control charts (Shewhart techniques) lies in their ability to determine if the cause of variation is a special cause that can be affected at the process level, or a common cause that requires a change at the management level. The information from the control chart can then be used to direct the efforts of engineers, technicians, and managers to achieve preventive or corrective action.
The use of statistical control charts is aimed at studying specific ongoing processes in order to keep them in satisfactory control. By contrast, downstream inspection aims to identify defects. In other words, control charts focus on prevention of defects rather than detection and rejection. It seems reasonable, and it has been confirmed in practice, that economy and efficiency are better served by prevention rather than detection.
All control charts have certain features in common (Figure 20-23). Each control chart has a centerline, statistical control limits, and the calculated attribute or control data. Some control charts also contain specification limits.
The centerline is a solid (unbroken) line that represents the mean or arithmetic average of the measurements or counts. This line is also referred to as the X bar line (![]() ). There are two statistical control limits: the upper control limit for values greater than the mean and the lower control limit for values less than the mean.
). There are two statistical control limits: the upper control limit for values greater than the mean and the lower control limit for values less than the mean.
Specification limits are used when specific parametric requirements exist for a process, product, or operation. These limits usually apply to the data and are the pass/fail criteria for the operation. They differ from statistical control limits in that they are prescribed for a process, rather than resulting from the measurement of the process.
The data element of control charts varies somewhat among variable and attribute control charts. We will discuss specific examples as a part of the discussion on individual control charts.
Control Chart Interpretation
PMBOK® Guide, 4th Edition
8.3.2.2 Perform Quality Control—Tools and Techniques
There are many possibilities for interpreting various kinds of patterns and shifts on control charts. If properly interpreted, a control chart can tell us much more than whether the process is in or out of control. Experience and training can help extract clues regarding process behavior, such as that shown in Figure 20-24. Statistical guidance is invaluable, but an intimate knowledge of the process being studied is vital in bringing about improvements.
A control chart can tell us when to look for trouble, but it cannot by itself tell us where to look, or what cause will be found. Actually, in many cases, one of the greatest benefits from a control chart is that it tells when to leave a process alone. Sometimes the variability is increased unnecessarily when an operator keeps trying to make small corrections, rather than letting the natural range of variability stabilize. The following paragraphs describe some of the ways the underlying distribution patterns can behave or misbehave.

FIGURE 20-23. Control chart elements.

FIGURE 20-24. Control chart interpretation.
Runs. When several successive points line up on one side of the central line, this pattern is called a run. The number of points in that run is called the length of the run. As a rule of thumb, if the run has a length of seven points, there is an abnormality in the process. Figure 20-25 demonstrates a run.
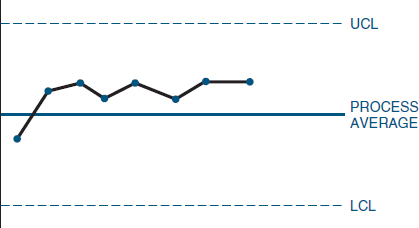

FIGURE 20-26. Control chart trends.
Trends. If there is a continued rise of all in a series of points, this pattern is called a trend. In general, if seven consecutive points continue to rise or fall, there is an abnormality. Often, the points go beyond one of the control limits before reaching seven. Figure 20-26 demonstrates a trend.
Periodicity. Points that show the same pattern of change (rise or fall) over equal intervals denote periodicity. Figure 20-27 demonstrates periodicity.
Hugging the Centerline or Control Limit. Points on the control chart that are close to the central line, or to the control limit, are said to hug the line. Often, in this situation, a different type of data or data from different factors have been mixed into the subgroup. In such cases it is necessary to change the subgrouping, reassemble the data, and redraw the control chart. To decide whether there is hugging of the centerline, draw two lines on the control chart, one between the centerline and the UCL and the other between the centerline and the LCL. If most of the points are between these two lines, there is an abnormality. To see whether there is hugging of one of the control limits, draw a line two-thirds of the distance between the centerline and each of the control lines. There is abnormality if 2 out of 3 points, 3 out of 7 points, or 4 out of 10 points lie within the outer one-third zone. The abnormalities should be evaluated for their cause(s) and the corrective action taken. Figure 20-28 demonstrates data hugging the LCL.
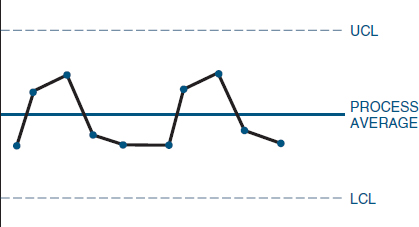
FIGURE 20-27. Control chart periodicity.

FIGURE 20-28. Hugging the centerline.
Out of Control. An abnormality exists when data points exceed either the upper or lower control limits. Figure 20-29 illustrates this occurrence.
In Control. No obvious abnormalities appear in the control chart. Figure 20-30 demonstrates this desirable process state.

FIGURE 20-29. Control chart out of control.

FIGURE 20-30. Process in control.
20.10 PROCESS CAPABILITY (CP)
Process capability, for a stable manufacturing process, is the ability to produce a product that conforms to design specifications. Because day-to-day variations can occur during manufacturing, process capability is a statement about product uniformity. Process capability, as measured by the quality characteristics of the product of the process, is expressed as the mean value plus or minus three standard deviations. Mathematically:
![]()
It is desirable for CP to be greater than one. This implies that the process of three-sigma limit is well within the customer's specification limits, as shown in Figure 20-31.
The following are generally accepted rules for CP:
- CP > 1.33: The process is well within the customer's specifications requirements.
- 1.33 ≥ Cp > 1.0: The process is marginally acceptable. The process may not completely satisfy the customer's requirements. Improvements in process control are needed.
- CP ≤ 1.0: The process is unacceptable as is. Improvements are mandatory.
To illustrate the use of the formula, assume that your customer's requirements are to produce metal rods that are 10 inches ± .05 inches. Your manufacturing process has a sigma of 0.008.


FIGURE 20-31. Calculating process capability.
Looking at Figure 20-31, CP is the relative spread of the process width within the specification width. Unfortunately, the spread of the process capability, even for very good values, could be poorly positioned within the specification width. The process width could easily be hugging either the USL or LSL. Today, process capability is measured by both CP and CPk, where CPk is the capability index with correction (k) for noncentrality. According to Dr. Frank Anbari, the formula for CPk can be simplified as:
![]()
where CL is the center of the process, that is, its average.
Dr. Anbari postulates that the CP provides an upper limit for the CPk, which is reached when the process is fully centered around the nominal dimension.
20.11 ACCEPTANCE SAMPLING
PMBOK® Guide, 4th Edition
8.3 Perform Quality Control
Acceptance sampling is a statistical process of evaluating a portion of a lot for the purpose of accepting or rejecting the entire lot. It is an attempt to monitor the quality of the incoming product or material after the completion of production.
The alternatives to developing a sampling plan would be 100% inspection and 0% inspection. The costs associated with 100% are prohibitive, and the risks associated with 0% inspection are likewise large. Therefore, some sort of compromise is needed. The three most commonly used sampling plans are:
- Single sampling: This is the acceptance or rejection of a lot based upon one sampling run.
- Double sampling: A small sample size is tested. If the results are not conclusive, then a second sample is tested.
- Multiple sampling: This process requires the sampling of several small lots.
Regardless of what type of sampling plan is chosen, sampling errors can occur. A shipment of good-quality items can be rejected if a large portion of defective units are selected at random. Likewise, a bad-quality shipment can be accepted if the tested sample contains a disproportionately large number of quality items. The two major risks are:
- Producer's risk: This is called the α (alpha) risk or type I error. This is the risk to the producer that a good lot will be rejected.
- Consumer's risk: This is called the β (beta) risk or type II error. This is the consumer's risk of accepting a bad lot.
When a lot is tested for quality, we can look at either “attribute” or “variable” quality data. Attribute quality data are either quantitative or qualitative data for which the product or service is designed and built. Variable quality data are quantitative, continuous measurement processes to either accept or reject the lot. The exact measurement can be either destructive or nondestructive testing.
20.12 IMPLEMENTING SIX SIGMA4
PMBOK® Guide, 4th Edition
Chapter 8 Introduction
Six Sigma is a business initiative first espoused by Motorola in the early 1990s. Recent Six Sigma success stories, primarily from the likes of General Electric, Sony, AlliedSignal, and Motorola, have captured the attention of Wall Street and have propagated the use of this business strategy. The Six Sigma strategy involves the use of statistical tools within a structured methodology for gaining the knowledge needed to create products and services better, faster, and less expensively than the competition. The repeated, disciplined application of the master strategy on project after project, where the projects are selected based on key business issues, is what drives dollars to the bottom line, resulting in increased profit margins and impressive return on investment from the Six Sigma training. The Six Sigma initiative has typically contributed an average of six figures per project to the bottom line. The Six Sigma project executioners are sometimes called “black belts,” “top guns,” “change agents,” or “trailblazers,” depending on the company deploying the strategy. These people are trained in the Six Sigma philosophy and methodology and are expected to accomplish at least four projects annually, which should deliver at least $500,000 annually to the bottom line. A Six Sigma initiative in a company is designed to change the culture through breakthrough improvement by focusing on out-of-the-box thinking in order to achieve aggressive, stretch goals. Ultimately, Six Sigma, if deployed properly, will infuse intellectual capital into a company and produce unprecedented knowledge gains that translate directly into bottom line results.5
Former General Electric (GE) CEO Jack Welch described Six Sigma as “the most challenging and potentially rewarding initiative we have ever undertaken at General Electric.” The GE 1997 annual report stated that Six Sigma delivered more than $300 million to its operating income. In 1998, they expected to more than double this operating profit impact. GE listed in its annual report the following to exemplify these Six Sigma benefits:
- Medical Systems described how Six Sigma designs have produced a 10-fold increase in the life of CT scanner X-ray tubes—increasing the “uptime” of these machines and the profitability and level of patient care given by hospitals and other health care providers.
- Superabrasives—our industrial diamond business—described how Six Sigma quadrupled its return on investment and, by improving yields, is giving it a full decade's worth of capacity despite growing volume—without spending a nickel on plant and equipment capacity.
- Our railcar leasing business described 62% reduction in turnaround time at its repair shops: an enormous productivity gain for our railroad and shipper customers and for a business that's now two or three times faster than its nearest rival because of Six Sigma improvements. In the next phase across the entire shop network, black belts and green belts, working with their teams, redesigned the overhaul process, resulting in a 50% further reduction in cycle time.
- The plastics business, through rigorous Six Sigma process work, added 300 million pounds of new capacity (equivalent to a “free plant”), saved $400 million in investment and will save another $400 by 2000.6
20.13 LEAN SIX SIGMA AND DMAIC7
Six Sigma is a quality initiative that was born at Motorola in the 1980s. The primary focus of the Six Sigma process improvement methodology, also known as DMAIC, is to reduce defects that are defined by the customer of the process. This customer can be internal or external. It is whoever is in receipt of the process output. Defects are removed by careful examination from a Six Sigma team made up of cross-functional positions having different lines of sight into the process. The team follows the rigor of the define, measure, analyze, improve, and control (DMAIC) methodology to determine the root cause(s) of the defects. The team uses data and appropriate numerical and graphical analysis tools to raise awareness of process variables generating defects. Data collection and analysis is at the core of Six Sigma. “Extinction by instinct” is the phrase often used to describe intuitive decision-making and performance analysis. It has been known to generate rework, frustration, and ineffective solutions. Six Sigma prescribes disciplined gathering and analysis of data to effectively identify solutions.
Lean manufacturing is another aspect of process improvement derived mostly from the Toyota Production System (TPS). The primary focus of lean is to remove waste and improve process efficiency. Lean is often linked with Six Sigma because both emphasize the importance of minimal process variation. Lean primarily consists of a set of tools designed to assist in the identification and steady elimination of waste (muda), allowing for the improvement of quality as well as cycle time and cost reduction. To solve the problem of waste, lean manufacturing utilizes several tools. These include accelerated DMAIC projects known as kaizen events, cause-and-effect analysis using “five whys” and error proofing with a technique known as poka-yoke.
Kaizen Events. The source of the word kaizen is Japanese: Kai (take apart) and Zen (make good). This is an action-oriented approach to process improvement. Team members devote 3-5 consecutive days to quickly work through the DMAIC methodology in a workshop fashion.
Five Whys. This technique is used to move past symptoms of problems and drill down to the root causes. With every answer comes a new question until you've gotten to the bottom of the problem. Five is a rule of thumb. Sometimes you'll only need three questions, other times it might take seven. The goal is to identify the root cause of process defects and waste.
Poka-Yoke. The source of this technique is Japanese: Yokeru (to avoid) and Poka (inadvertent errors). There are three main principles of poka-yoke. (1) Make wrong actions more difficult. (2) Make mistakes obvious to the person so that the mistake can be corrected. (3) Detect errors so that downstream consequences can be prevented by stopping the flow or other corrective action. The philosophy behind this technique is that it's good to do things right the first time, but it is even better to make it impossible to do it wrong the first time.
When Six Sigma and lean manufacturing are integrated, the project team utilizes the project management methodology to lead them through the lean Six Sigma toolbox and make dramatic improvements to business processes. The overall goal is to reduce defects that impact the internal and external customer and eliminate waste that impact the cycle times and costs.
20.14 QUALITY LEADERSHIP8
Chapter 9 Human Resources Management
Consider for a moment the following seven items:
- Teamwork
- Strategic integration
- Continuous improvement
- Respect for people
- Customer focus
- Management-by-fact
- Structured problem-solving
Some people contend that these seven items are the principles of project management when, in fact, they are the seven principles of the total quality management program at Sprint. Project management and TQM have close similarity in leadership and team-based decision-making. According to Breyfogle,9 American managers have often conducted much of their business through an approach that is sometimes called management by results. This type of management tends to focus only on the end result, that is, process yield, gross margin, sales dollars, return on investment, and so on. Emphasis is placed on a chain of command with a hierarchy of standards, objectives, controls, and accountability. Objectives are translated into work standards or quotas that guide the performance of employees. Use of these numerical goals can cause short-term thinking, misdirected focus, fear (e.g., of a poor job performance rating), fudging the numbers, internal conflict, and blindness to customer concerns. This type of management is said to be like trying to keep a dog happy by forcibly wagging its tail.
Quality leadership is an alternative that emphasizes results by working on methods. In this type of management, every work process is studied and constantly improved so that the final product or service not only meets but exceeds customer expectations. The principles of quality leadership are customer focus, obsession with quality, effective work structure, control yet freedom (e.g., management in control of employees yet freedom given to employees), unity of purpose, process defect identification, teamwork, and education and training. These principles are more conducive to long-term thinking, correctly directed efforts, and a keen regard for the customer's interest.
Quality leadership does have a positive effect on the return on investment. In 1950, Deming described this chain reaction of getting a greater return on investment as follows: improve quality → decrease costs → improve productivity → decrease prices → increase market share in business → provide jobs → increase return on investment. Quality is not something that can be delegated to others. Management must lead the transformation process.
To give quality leadership, the historical hierarchical management structure needs to be changed to a structure that has a more unified purpose using project teams. A single person can make a big difference in an organization. However, one person rarely has enough knowledge or experience to understand everything within a process. Major gains in both quality and productivity can often result when a team of people pool their skills, talents, and knowledge.
Teams need to have a systematic plan to improve the process that creates mistakes/defects, breakdowns/delays, inefficiencies, and variation. For a given work environment, management needs to create an atmosphere that supports team effort in all aspects of business. In some organizations, management may need to create a process that describes hierarchical relationships between teams, the flow of directives, how directives are transformed into action and improvements, and the degree of autonomy and responsibility of the teams. The change to quality leadership can be very difficult. It requires dedication and patience to transform an entire organization.
20.15 RESPONSIBILITY FOR QUALITY
Everyone in an organization plays an important role in quality management. In order for an organization to become a quality organization, all levels must actively participate, and, according to Dr. Edwards Deming, the key to successful implementation of quality starts at the top.
Top management must drive fear from the workplace and create an environment where cross-functional cooperation can flourish. The ultimate responsibility for quality in the organization lies in the hands of upper management. It is only with their enthusiastic and unwavering support that quality can thrive in an organization.
The project manager is ultimately responsible for the quality of the project. This is true for the same reason the president of the company is ultimately responsible for quality in a corporation. The project manager selects the procedures and policies for the project and therefore controls the quality. The project manager must create an environment that fosters trust and cooperation among the team members. The project manager must also support the identification and reporting of problems by team members and avoid at all costs a “shoot the messenger” mentality.
The project team members must be trained to identify problems, recommend solutions, and implement the solutions. They must also have the authority to limit further processing when a process is outside of specified limits. In other words, they must be able to halt any activity that is outside of the quality limits set for the project and work toward a resolution of the problem at any point in the project.
20.16 QUALITY CIRCLES
Quality circles are small groups of employees who meet frequently to help resolve company quality problems and provide recommendations to management. Quality circles were initially developed in Japan and have achieved some degree of success in the United States. The employees involved in quality circles meet frequently either at someone's home or at the plant before the shift begins. The group identifies problems, analyzes data, recommends solutions, and carries out management-approved changes. The success of quality circles is heavily based upon management's willingness to listen to employee recommendations.
The key elements of quality circles include:
- They give a team effort.
- They are completely voluntary.
- Employees are trained in group dynamics, motivation, communications, and problem solving.
- Members rely upon each other for help.
- Management support is active but as needed.
- Creativity is encouraged.
- Management listens to recommendations.
The benefits of quality circles include:
- Improved quality of products and services
- Better organizational communications
- Improved worker performance
- Improved morale
20.17 JUST-IN-TIME MANUFACTURING (JIT)
Just-in-time manufacturing is a process that continuously stresses waste reduction by optimizing the processes and procedures necessary to maintain a manufacturing operation. Part of this process is JIT purchasing or inventory where the materials needed appear just in time for use, thus eliminating costs associated with material handling, storage, paperwork, and even inspection. In order to eliminate inspection, the customer must be convinced that the contractor has adhered to all quality requirements. In other words, JIT inventory pushes quality assurance and quality control for that product down to the contractor's level.
The customer benefits from JIT purchasing by developing long-term relationships with fewer suppliers, thus lowering subcontractor management costs. The contractor benefits by having long-term contracts. However, the contractor must agree to special conditions such as on-site inspections by the customer's executives, project manager, or quality team, or even allowing an on-site customer representative at the contractor's location.
JIT purchasing has been widely adopted in Japan, but only marginal success has occurred here in the United States. Table 20-6 shows the relative comparison of American versus Japanese quality practices.
Another part of JIT manufacturing is the identification and continuous reduction of waste. Shigeo Shingo of Toyota Motor Company has identified seven wastes that should be the targets of a continuous improvement process. These appear in Table 20-7.
TABLE 20-6. COMPARATIVE ANALYSIS OF PURCHASING PRACTICE: TRADITIONAL U.S. AND JAPANESE JIT
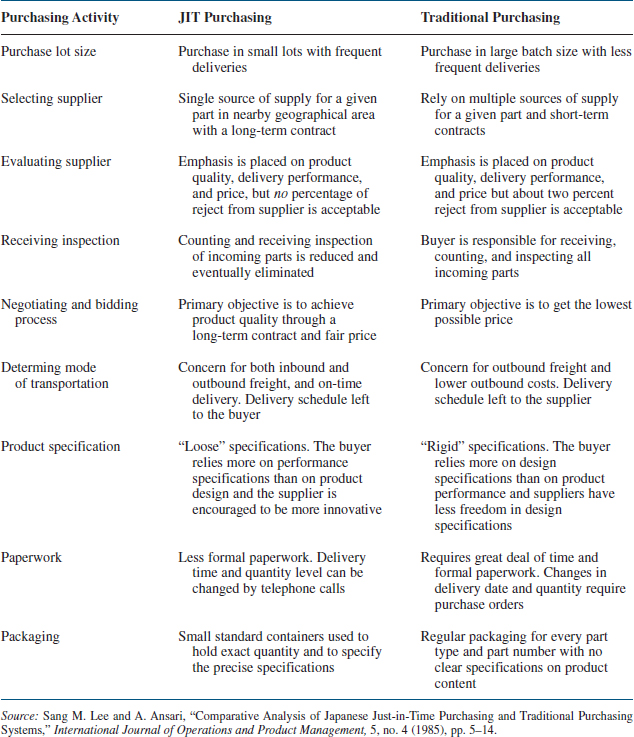
Two new topics are now being discussed as part of JIT manufacturing: value-added manufacturing and stockless production. Value-added manufacturing advocates the elimination of any step in the manufacturing process that does not add value to the product for the customer. Examples include process delays, transporting materials, work-in-process inventories, and excessive paperwork. Stockless production promotes little inventories for raw materials, work in process, and finished goods. Everything ends up being made to order and then delivered as needed. Waste becomes nonexistent. The practicality and risks of this approach may not be feasible for either the company or the project manager.

20.18 TOTAL QUALITY MANAGEMENT (TQM)10
PMBOK® Guide, 4th Edition
8.1.1 Quality Planning
There is no explicit definition of total quality management. Some people define it as providing the customer with quality products at the right time and at the right place. Others define it as meeting or exceeding customer requirements. Internally, TQM can be defined as less variability in the quality of the product and less waste.
Figure 20-32 shows the basic objectives and focus areas of a TQM process. Almost all companies have a primary strategy to obtain TQM, and the selected strategy is usually in place over the long term. The most common primary strategies are listed below. A summary of the seven primary improvement strategies mapped onto 17 corporations is shown in Table 20-8.
Primary strategies:
- Solicit ideas for improvement from employees.
- Encourage and develop teams to identify and solve problems.
FIGURE 20-32. TQM objectives and focus areas. Source: C. Carl Pegels, Total Quality Management (Danvers, MA: Boyd & Fraser, 1995), p. 6.
- Encourage team development for performing operations and service activities resulting in participative leadership.
- Benchmark every major activity in the organization to ensure that it is done in the most efficient and effective way.
- Utilize process management techniques to improve customer service and reduce cycle time.
TABLE 20-8. PRIMARY IMPROVEMENT STRATEGIES EMPLOYED BY LISTED CORPORATIONS

TABLE 20-9. SECONDARY IMPROVEMENT STRATEGIES EMPLOYED BY LISTED CORPORATIONS

- Develop and train customer staff to be entrepreneurial and innovative in order to find ways to improve customer service.
- Implement improvements so that the organization can qualify as an ISO 9000 supplier.

There also exist secondary strategies that, over the long run, focus on operations and profitability. Typical secondary strategies are shown below, and Table 20-10 identifies the secondary improvement strategies by listed companies.
Secondary strategies:
- Maintain continuous contact with customers; understand and anticipate their needs.
- Develop loyal customers by not only pleasing them but by exceeding their expectations.
- Work closely with suppliers to improve their product/service quality and productivity.
- Utilize information and communication technology to improve customer service.
- Develop the organization into manageable and focused units in order to improve performance.
- Utilize concurrent or simultaneous engineering.
TABLE 20-10. SUMMARY ILLUSTRATIONS OF QUANTIFIED IMPROVEMENTS ACHIEVED

- Encourage, support, and develop employee training and education programs.
- Improve timeliness of all operation cycles (minimize all cycle times).
- Focus on quality, productivity, and profitability.
- Focus on quality, timeliness, and flexibility.
Information about quality improvements is difficult to obtain from corporations. Most firms consider this information confidential and do not like to publish for fear of providing an advantage to their competitors. As a result, the information in Table 20-11 is sketchy. It is simply a snapshot of a limited number of quantitative performance improvements that were achieved by firms as part of their total quality management programs.
One noteworthy achievement is Ford's reduction in man-hours to build a vehicle from 15 to 7.25. Although this took 10 years to achieve, it is still a sterling example of productivity improvement. IBM Rochester, Minnesota's reduction in defects per million by a factor of 32 over a 4-year period is also noteworthy. And the ability of Chrysler and General Motors to reduce their design development times for new vehicles from 60 and 48 months to the current 33 and 34 months, respectively, is an achievement that indicates the return of competitiveness to the U.S. automobile industry.
20.19 STUDYING TIPS FOR THE PMI® PROJECT MANAGEMENT CERTIFICATION EXAM
This section is applicable as a review of the principles to support the knowledge areas and domain groups in the PMBOK® Guide. This chapter addresses:
- Quality Management
Understanding the following principles is beneficial if the reader is using this text to study for the PMP® Certification Exam:
- Contributions by the quality pioneers
- Concept of total quality management (TQM)
- Ddifferences between quality planning, quality assurance, and quality control
- Importance of a quality audit
- Quality control tools
- Concept of cost of quality
The following multiple-choice questions will be helpful in reviewing the principles of this chapter:
- Which of the following is not part of the generally accepted view of quality today?
- In today's view of quality, who defines quality?
- Contractors' senior management
- Project management
- Workers
- Customers
- Which of the following are tools of quality control?
- Sampling tables
- Process charts
- Statistical and mathematical techniques
- All of the above
- Which of the following is true of modern quality management?
- Quality is defined by the customer.
- Quality has become a competitive weapon.
- Quality is now an integral part of strategic planning.
- All are true.
- A company dedicated to quality usually provides training for:
- Senior management and project managers
- Hourly workers
- Salaried workers
- All employees
- Which of the following quality gurus believe “zero-defects” is achievable?
- Deming
- Juran
- Crosby
- All of the above
- What are the components of Juran's Trilogy?
- Quality Improvement, Quality Planning, and Quality Control
- Quality Improvement, Zero-Defects, and Quality Control
- Quality Improvement, Quality Planning, and Pert Charting
- Quality Improvement, Quality Inspections and Quality Control
- Which of the following is not one of Crosby's Four Absolutes of Quality?
- Quality means conformance to requirements.
- Quality comes from prevention.
- Quality is measured by the cost of conformance.
- Quality means that the performance standard is “zero-defects.”
- According to Deming, what percentage of the costs of quality is generally attributable to management?
- 100%
- 85%
- 55%
- 15%
- Inspection:
- The Taguchi Method philosophies concentrate on improving quality during the:
- Conceptual Phase
- Design Phase
- Implementation Phase
- Closure Phase
- A well-written policy statement on quality will:
- Be a statement of how, not what or why
- Promote consistency throughout the organization and across projects
- Provide an explanation of how customers view quality in their own organizations
- Provide provisions for changing the policy only on a yearly basis
- Quality assurance includes:
- Identifying objectives and standards
- Conducting quality audits
- Planning for continuous collection of data
- All of the above
- What is the order of the four steps in Deming's Cycle for Continuous Improvement?
- Plan, do, check, and act
- Do, plan, act, and check
- Check, do, act, and plan
- Act, check, do, and plan
- Quality audits:
- Are unnecessary if you do it right the first time
- Must be performed daily for each process
- Are expensive and therefore not worth doing
- Are necessary for validation that the quality policy is being followed and adhered to
- Which of the following are typical tools of statistical process control?
- Pareto analysis
- Cause-and-effect analysis
- Process control charts
- All of the above
- Which of the following methods is best suited to identifying the “vital few?”
- Pareto analysis
- Cause-and-effect analysis
- Trend analysis
- Process control charts
- When a process is set up optimally, the upper and lower specification limits typically are:
- Set equal to the upper and lower control limits
- Set outside the upper and lower control limits
- Set inside the upper and lower control limits
- Set an equal distance from the mean value
- The upper and lower control limits are typically set:
- One standard deviation from the mean in each direction
- 3 σ (three sigma) from the mean in each direction
- Outside the upper and lower specification limits
- To detect and flag when a process may be out of control
- Which of the following is not indicative of today's views of the quality management process applied to a given project?
- Defects should be highlighted and brought to the surface.
- The ultimate responsibility for quality lies primarily with senior management or sponsor but everyone should be involved.
- Quality saves money.
- Problem identification leads to cooperative solutions.
- If the values generated from a process are normally distributed around the mean value, what percentage of the data points generated by the process will not fall within plus or minus three standard deviations of the mean?
- 99.7%
- 95.4%
- 68.3%
- 0.3%
ANSWERS
- B
- D
- D
- D
- D
- C
- A
- C
- B
- B
- B
- B
- D
- A
- D
- D
- A
- B
- B
- B
- D
1. Appreciation is given to Terry Fischer (PMP) and Dr. Frank Anbari (PMP) for their invaluable assistance in the preparation of this chapter.
2. Taken from Ranjit Roy, A Primer on the Taguchi Method (Dearborn, MI: Society of Manufacturing Engineers, 1990), Chapter 2. Reproduced by permission.
3. This section is taken from H. K. Jackson and N. L. Frigon, Achieving the Competitive Edge (New York: Wiley, 1996), Chapters 6 and 7. Reproduced by permission.
4. Adapted from Forrest W. Breyfogle, III, Implementing Six Sigma (New York: Wiley, 1999), pp. 5–7.
5. Information in this paragraph was contributed by J. Kiemele, Ph.D., of Air Academy Associates.
6. 1998 GE Annual Report.
7. The section was provided by Anne Foley, Director of Six Sigma for the International Institute for Learning.
8. Adapted from Forrest W. Breyfogle, III, Implementing Six Sigma (New York: Wiley, 1999), pp. 28–29.
9. Adapted from Forrest W. Breyfogle, III, Implementing Six Sigma (New York: Wiley, 1999), pp. 28–29.
10. This section has been adapted from C. Carl Pegels, Total Quality Management (Danvers, MA: Boyd & Fraser, 1995), pp. 4-27.