An important objective of this book is to help define and identify the cash impact of improvement projects. Many attempt to use accounting tools and metrics to represent the cost of the project and the improvement benefit. This will not suffice. We need an approach that focuses on understanding and modeling cash dynamics and the factors that influence the flow of cash. Only by modeling cash effectively can we understand and manage the impact we have on cash with our improvement projects.
Before diving into the process of turning improvements into cash, we need critical context for thinking about and modeling cash. Practically everything in the methodology presented in this book revolves around one key objective: how do we ensure improvement projects make money for our firm? Of course, there are projects where making money is not the objective and that is fine. However, the purpose of this book is to help project teams and companies actually make money by creating a positive cash return on investment, or CROI, from the projects they implement.
Why do we need this context? Taken at face value, having an objective that cash-based improvement projects create more cash than was spent is a fairly benign notion. However, when we look under the covers, it’s much more complicated.
Consider the cost of the improvement project. Let’s say someone is estimating the cost of the project and they identify the need for a resource. They can either use an internal employee or an external resource. Assume the line item on a project budget for the person is for $20 thousand. If the “cost” is $20 thousand for the internal employee, but only $15 thousand for a similarly skilled outside resource, who would you pick? One may think it’s better, from a profitability perspective, to go with the cheaper outside resource, as there is a significant difference between the two ($20 thousand versus $15 thousand), and you’ve already increased the profit by $5 thousand over what is budgeted. However, when considering cash spent by the organization, it’s a no-brainer; $0 cash for the internal resource as discussed in Chapter 2 versus $15 thousand cash for the external.
The same thing happens when calculating benefits. Again, from Chapter 2, which is better, making a $100 thousand resource 10 percent more efficient resulting in $10 thousand in savings, or saving $7 thousand by buying lower priced materials? As discussed, making a salaried person more efficient doesn’t change what they’re paid, so the $10 thousand is not money. The $7 thousand bogey is a much more desirable target from a cash perspective. When the goal is cash and you’re looking at the most appropriate data, these answers are obvious. The answers may not be intuitive to most, especially those who are vested in using accounting techniques to calculate savings, so let’s take a deeper dive.
What I have found is that most savings calculations methodologies that I’ve seen are focused on calculating the monetary value of savings using accounting-based information. This is a mistake for two reasons. The first is that most accounting values such as costs and profits have nothing to do with money or cash.1 The second is, many accounting numbers significantly skew monetary values in a way that misrepresents reality.
Consider making a salaried, or even hourly worker more efficient and claiming a cash savings. If there were cash savings from the $100 thousand employee mentioned above, we should see a reduction in money spent, but if she is still receiving the same salary, there will not be a transaction representing the $10 thousand reduction. This is a version of the calculation Oracle used, admittedly, for the $1.45 billion portion of its savings that it didn’t realize.
Let’s think about product, service, a activity costs. Assume a company determines it costs them $3.75 to make a product. If that cost were money, we should see a transaction for $3.75 every time the company makes the product. They should save $3.75 when they don’t. Do we see this? No. If it costs $35 to do a dental cleaning, do we see a cash transaction for every time a salaried hygienist does a cleaning? Does the dental office save $35 when she doesn’t do a cleaning? No. When determined an activity such as processing an invoice costs $100, do we see a transaction for $100 every time an invoice is processed? No.
With the answer being “No” in each of these situations, think about cost savings; if the costs do not represent cash, the savings that are based on them will not be cash. Returning to the $3.75 product cost, if that’s not money, reducing it to $3.25 from improvements will not lead to a 50¢ cash savings per unit.
Accounting does not deal with cash in this way and with this level of context. The closest accounting values to true cash are those found on the cash flow statement. Using the direct method where there are no accruals, the statement models cash. With the indirect method, however, accruals are involved, and whenever accruals are used, it’s less certain. With cash flow statements, the information you get is that money was spent and not how or why. You know that you spent $100 thousand in labor last month, but that’s it. You cannot look at that number and determine how many people you paid, what you paid them, or whether overtime was involved. In general, you may also not understand “why” you spent $100 thousand. You may normally spend $75 thousand per month, so is the extra $25 thousand overtime? Time and a half? Double time? Temporary laborers used to fill gaps in capacity? In other words, key context is lost, which limits the utility of the statements of cash flow as a managerial tool. Interestingly enough, even if the best cash information is found on the cash flow statements, one CEO confessed to me that he rarely looked at or used it.
Understanding the Dynamics of Cash
Making money is about cash transactions: money that comes in and leaves your company. Say, you wake up in the morning with $10 in your pocket, you make $7, and you spend $5 throughout the day. At the end of the day, you will have $12. You’ve made $2. This, itself, is another fairly benign notion. The key attributes are:
1. How much money did you start with ($10)?
2. How much money did you bring in ($7)?
3. How much money did you spend ($5)?
4. What was the time period (one day)?
The cash you end up with is equal to what you started the day with, plus what you received during the day, minus what you spent during the day.
This situation can be modeled with Equation 3.1 shown with the accompanying diagram in Figure 3.1.

Figure 3.1 If we put a box around you and measure how much cash you have at the beginning of a period, we will know how much cash you have at the end by measuring what cash flows in and out during the period
![]()
Where,
CashEND is the cash at the end of the period;
CashBEGINNING is the cash at the beginning of the period;
CashIN is the cash that enters during the period;
CashOUT is the cash that leaves during the period.
The same model works with organizations. We put a box called the Cash-In/Cash-Out or CiCo Border around the entire company and we look at cashIN and cashOUT over an analysis period. The difference between the two will tell us whether the company made or lost cash during the period (Figure 3.2). How much the organization has at the end of the period is determined using Equation 3.1. Note, we do not need accounting profit and cost information to determine this.
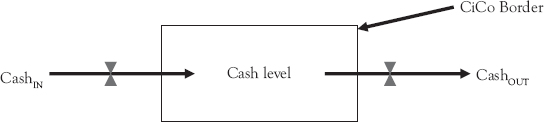
Figure 3.2 As with an individual, if we put a box around the company, we can understand how its cash changes over time, and we can predict and project cash values. The box we put around the company is called the cashIN cashOUT or CiCo Border. It must go around the entire company, not departments, divisions, cost centers, or profit centers
As suggested, it is important to look at the entire organization and not, for instance, a department or a division. The reason is, a department can transfer cash from its budget to another department’s budget. While the first department no longer has the money, no additional cash has left the organization as a result of the transfer, so nothing has changed regarding how much cash the organization has. This is why it costs the organization nothing for the $20 thousand resource mentioned previously. Although there may be a budget transfer within the organization, there is no cash impact. If, instead, the company spent money on an outside resource, that would affect cashOUT and lead to the organization being $15 thousand poorer as a result.
An example of this is found by considering a situation I once encountered with a previous employer. I was a professor at a school that had a shared services copy center. The school decided to charge departments for their copies, which makes sense on the surface. If we have a cost center, let’s justify it by having folks pay for the products or services offered. The idea is, this should cover, or in some cases, justify the expense.
Let’s say they decide to charge 5¢ for a copy. To our department, that is a cash cost because it leaves our budget when we buy copies. As a group looking to manage our own budget, it makes sense for us to consider cheaper alternatives. If we can find another source that offers to sell us copies for less money, say 3¢, it makes sense to us to go outside the organization to buy copies from that source.
From a departmental perspective, the decision made perfect sense. It’s better to spend 3¢ rather than 5¢ for what is basically the same product. However, to the school, it’s a very different story. We have now increased the cash cost to the organization. Why? Because we will still be paying for the shared services center; the labor, paying for the materials we’ve purchased, and the equipment we’re buying or leasing. This money will be leaving regardless of whether they are making copies or not. So, when we decided to go outside to pay for copies, more money is leaving the school’s coffers, resulting in a poorer cash position than if we had paid 5¢ for the copies (Figure 3.3).

Figure 3.3 The focus should be on money that leaves the organization. If money does not leave, it does not affect cash. Buying copies internally had no impact on the school’s cash, but spending outside did
Looking at the entire organization from a cash perspective rather than departments or divisions will help avoid this and similar scenarios, such as those involved with calculating the cost of the project. This will be a very important consideration when thinking about project costs and comparing internal to external resources.
Cash Improvements From Improvement Projects
We use the same cash dynamics concepts and equations to calculate the cash benefits of improvement projects. The amount of money the project makes is the difference between what the company spent to implement the project, reiterating, money that left the organization due to spending not that allocated to the project, and the cash improvement that is realized as a result of the implementation. The cash improvement, we will find, can either be an increased rate of cash coming in, or a relative decrease in the rate of cash going out. The analysis period generally starts when the project begins and lasts until the end of the value realization period, however that is defined.
Going back to Figure 3.2, when cashIN is greater than cashOUT over a period, the amount of cash the company has will increase. It’s like water in a kitchen sink with waterIN being greater than waterOUT. When more water comes in than leaves, the water level in the sink rises. If more water leaves than comes in, the water level declines. If the objective is to raise the water level in the sink, we have to ensure waterIN is greater than waterOUT.
Similarly, the overall cash improvement must consider changes in both cashIN and cashOUT. If the cashIN associated with realizing benefit is greater than cashOUT from the implementation, the amount of cash the organization has will increase (Equation 3.2). The total amount of the change is calculated using Equation 3.2, and this simple equation will be the source of understanding when, if, and how our projects create cash improvements. This is a very important point to consider. It is quite possible that projects with inflated benefits may cause cashOUT to be greater than cashIN. Going back the scenarios from Chapter 1, in each case, the cash spent on consulting and software would have exceeded the cash benefits expected from the improvement, suggesting the companies would have lost, not gained cash.
![]()
Where,
Δ cashIN looks at any changes in the rate which the company receives cash as a result of implementing the project;
Δ cashOUT considers the rate at which the company spends cash on the project. This value includes all cash spent implementing the project and executing management activities necessary to realize the benefits.
Another useful metric is CROI. More traditional ROI, is also a significant metric for many companies. ROI is determined by taking the difference between anticipated savings and the cost to achieve these savings, or the investment, and dividing it by the investment (Equation 3.3). For instance, if you spend $1,000 and the improvement is $6,000, the ROI is 5:1 ($6,000 − $1,000) ÷ $1,000.
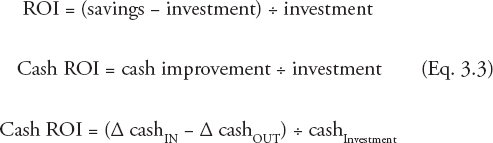
What is more important here is CROI. In this case, we are looking at the cash spent and the resulting improvement in cash. This means for CROI, we must look only at money entering and leaving the company. Efficiency savings, for example, would not be considered because they are not cash. Costs associated with the use of internal resources, too, will not factor in. As such, CROI tends to be smaller in cases involving using external resources because the investment is larger. However, with smaller investments from internal resources, the CROI may actually be higher, which is an important note. To illustrate, with the previous example, assume $750 of the $1,000 was tied to the value of an internal employee. If you receive the $6,000 benefit while spending $250, the CROI is actually 23:1 versus 5:1 if everything else remained the same.
All of this should seem straightforward. It if does, great. Now, let’s rock the boat a bit. Much of the information about savings and costs that is used in ROI calculations, we get from accounting information, tools and approaches. The problem is, accounting information, specifically cost and managerial accounting information, doesn’t give us what we think it gives us. It does not give us the cash information that we need to understand and calculate benefits and to calculate CROI.2 Consider a $120 thousand IT employee we are considering putting on our project. How do we calculate the cost of her time? Let’s say a project will improve her efficiency. How much money is being saved as a result? Although accounting can provide answers, they are neither cash oriented nor are the calculated values unique. Let’s consider each.
Not Cash Oriented
For the cash equation, Equation 3.1 to work, we need boundaries to allow us to measure the rate of cashIN and cashOUT. This is the CiCo Border mentioned previously and shown in Figure 3.2. Inside this border is the amount of money, cash, the company has at any given point in time. This is the cash level. If we measure cashIN and cashOUT of the box over time, we will know if, during a given period of time, the cash level increases or decreases. Cash coming in and leaving the organization are the only ways the cash level can be affected.
Accounting values do not necessarily reflect cash transactions, and most are, in fact, not cash at all. Consider accounting costs. They are simply opinions of value and nothing more.3 That’s a pretty strong statement. Let’s consider a simple cost and benefit scenario to demonstrate. Our IT employee is paid a salary of $120K per year. You want three weeks of her time on a project. How do you figure out the “cost” to have her on your project for budgeting purposes? Somehow, you need to convert the annual salary to three weeks, but how? Let’s say you divide $120K by 52. That’s approximately $2,300 per week. Every week she is on the project “costs” the company $2,300—or does it? You are paying her a salary, so the company does not see an increase of $2,300 in cashOUT for every week she works on your project. There is no company level $2,300 cash transaction for her time. In fact, as suggested previously, it costs the company nothing from a cash perspective for her to work with you.
You may or may not choose to backfill her position. The management issue you face is that by using her for three weeks, she isn’t available during that time to do her regularly assigned tasks. If you choose to backfill and you do so with a person you hired from the outside, that act of hiring someone from the outside and paying them a salary is where the cashOUT increases. Otherwise, you can assign her to the project, choose not to backfill, and not have the associated increase in cashOUT. In any case, the $2,300 per week for her time, itself, is not a cash cost. Instead, it represents what we believe is a reasonable value of a week of her time, and that is what often gets used for budgeting purposes.
The same holds true for benefits. Let’s say a task takes a person making $60,000 one hour. With the improvement, the person will now take 20 minutes to perform the same task. How much is saved? Assuming we use a 2,000-hour work year, we calculate a cost of $30 per hour as an hourly rate. Hence, we determine the task “costs” $30. With the improvement, we have unquestionably saved 40 minutes in time. However, one would be tempted to argue we have saved $20 since the task used to cost $30 and now costs $10. When looking at the cash level, cashOUT has not changed, so no cash was saved. Hence, the $20 is a value placed on the 40 minutes saved.
These cost and savings calculations are dangerous. On the cost side, it causes project managers and leaders to make bad choices in the name of managing their project’s profitability. We saw this previously on the cost side when comparing the $20 thousand internal resource to the $15 thousand external resource. On the benefit side, we have benefit inflation as we saw with Oracle. The consultant comes along and says, “Your department budget is $10M. If our software can make your department just 10 percent more efficient, we will save you $1M.” No, you won’t. These benefit calculations are not true from a cash perspective.
Not Unique
Let’s go back to the IT employee’s cost to our project. I proposed this is not a cost but, instead, an opinion of value. We chose to take her salary and divide it by 52 weeks to calculate a cost per week of $2,300. However, what if, instead, we decided to consider her three weeks of vacation? She’s really only being paid to work 49 weeks, so should we consider 49 versus 52 weeks? If we do, now her cost per week is $2,450. If we take out our 15 paid holidays, she’s now only working 46 weeks, so the cost per week has gone up to $2,600. We do this all, however, to determine what one week is worth.
The costs we calculated are tied to the assumptions we make and to arbitrary math. The assumptions we make are subjective. Do we choose holidays or not? Do we choose vacation time or not? These are subjective choices. It is this subjectivity associated with the choices that leads me to describe costs as opinions of value. Opinions led to the parameters chosen and used to define value. There is also the question of which approach one chooses to calculate costs. Should one use activity-based costing? Another approach? If so, which one? The choice of approach, too, is subjective.
Regarding the arbitrary relationships, consider this. The cash cost to a company does not change based on the work an employee does for it. The employee gets paid $120K per year or $10K per month regardless of what work she does. So, whether she is on a project 0 weeks or all 52, her salary does not change (Figure 3.4).

Figure 3.4 Although a simple chart, the idea is powerful. The labor you buy and how you use them are unrelated from a cash perspective
When you buy capacity, what you pay for the capacity and how you use it are unrelated from a cash perspective. This suggests that what she is paid and what she does during the year are mathematically independent. There is no relationship between the two. None. Want proof? Does your salary change based on the work you do? No. Even if you’re commission-based, you only get commission when the customer buys what you’re selling, and the transaction meets the requirements of your company. The work leading up to it does not change your salary.
Since there is no relationship between her pay and the number of weeks she is on a project, to create a cost per week involves making up a mathematical relationship between two things that are mathematically independent of one another. When you do this, the mathematical relationship is arbitrary. For example, you can create a relationship between the number of houses in your neighborhood and the number of planes that fly over the neighborhood during the course of a day, but that number has no mathematical relevance. It’s not as if another 3.8 houses will somehow pop up if one more plane is diverted over your neighborhood. The relationship means nothing. In the case of the worker, you can divide her salary by 52, 49, 46, or any number of weeks you want, but it won’t represent cash and no single value is any more correct or valid mathematically than the other. And regardless, if she works another week on a project, the company isn’t going to be out another $2,300, $2,450, or $2,600 as a result.
Another challenge this creates is determining just how much accounting cost was saved. Consider a $60K per year employee. As with our IT resource, depending on how we calculated the hourly cost for the $60K per year employee, the savings will change. We know we saved 40 minutes of her time, but what is this in terms of value? Is it $20 (2K hours per year), $19.23 (52 weeks and 40 hours/week), $22 (46 weeks and 40 hours per week) or $19.32 (46 weeks and 45 hours/week)? The issue for leaders looking for accounting value isn’t the reality that 40 minutes saved. Instead, the issue is about how we choose to represent the value of the 40 minutes
These factors create significant challenges when trying to understand the impact of improving an organization’s performance using accounting information. There should be a way to have an unambiguous approach to describe, model, and quantify the impact of improvement projects. That is the topic of the next chapter.
Key Takeaways
1. When improvement projects are about generating cash, accounting information will not work. You must use a cash-based analysis and avoid accounting costs and accounting profit.
2. Cash can only be affected by money that comes into and leaves an organization over the same period. Efficiency usually has no effect on cash savings because it doesn’t affect the rate of cash leaving the company.
3. When considering both cash costs and benefits, focus on how the rate of change of cash is affected. That way you will be able to project the cash impact of both the project cost and the project’s benefits.
1 Lee 2016.
2 Ibid.
3 Lee 2018.