The Cash Value Realization Process
Cash value realization does not just happen. It takes diligence and an effective process that leads your firm down the path to cash value realization. This involves selecting the right projects, justifying them from a cash perspective while distinguishing the differences between cash and noncash costs and improvements, planning the implementation, and executing the implementation plan with an emphasis on value realization.
Lean. Six-Sigma. IT investments. Business transformations. There are several ways companies look to increase business performance. Key elements to this increase in performance are the improvement projects that companies undertake. Although these improvements may include both operational and financial performance, there is a general expectation that the project will make money for the organization. That doesn’t mean they always do or need to. There may be situations such as safety or compliance issues that a project must address and the solution may not be the type that will lead to financial improvements.
The money we expect improvement projects to make should both cover the cash cost of the project and generate more money than it would have, had the project not been implemented. In other words, it is expected that the project will be cash-wise profitable. However, many that intend to be are not, and even more do not live up to the promises made in terms of the value that the project delivered.
Consider the software company, Oracle. Several years ago, they announced their company would save $500 million using their own software tools as a basis for the improvement. This number was later increased to $2 billion.1 Reviews of their financials suggested the savings were not there, either from an accounting perspective or a cash perspective.2 Think, for a moment, about what it would take for a company to save $2 billion in cash. Using a quick “back of the napkin” approach similar to the company mentioned at the beginning of Chapter 1, it would be the equivalent of laying off 20,000 people making $100K per year. There was nothing even remotely close to that on their books or in the press. Such a change is significant. If the company known for their ERP software and consulting capabilities is misrepresenting the value their own solutions create internally, how can we expect them to represent value any better for others?
Consider the billions of dollars spent on large global consultancies such as the Big 4, McKinsey, Tata, Infosys, and all the others. There is an expectation they will improve financial performance by reducing costs and improving profit. Let’s say the global spend on all consultancies is an even $200 billion. To get a 5:1 cash ROI, they would need to find $1.2 trillion in cash and not accounting cost reductions, which aren’t really cash.3 I mean real money.4
There is no evidence that $1.2 trillion is being created annually by these consultancies and the improvement projects they’re selling to their customers. There should be evidence—a smoking gun, because $1.2 trillion is a significant amount of money. These consultancies most likely created business cases for their work, and these business cases likely suggested their customers would realize the $1.2 trillion in aggregate. Why would their customers buy projects that cost tens of millions of dollars if there weren’t justification for the investment? They generally wouldn’t, so we should be able to find the value.
What about the consultants themselves and their own descriptions of their cost-cutting exploits? Throughout my career in the cash improvement space, I’ve heard countless consultants brag about how much “money” they’ve saved companies or how focused their solutions are on cost savings. They wear their results as a badge of honor; “I, alone, have saved companies a total of a billion dollars over my career!” Considering the executive’s question in Scenario 3 in Chapter 1, where is the proof that companies spent $1 billion less in cash with this consultant, or $1.2 trillion less in cash annually with the various consultancies? In most cases, a little due diligence will show that the promised dollar savings are simply not there in cash.
The problem is not that consultants and consultancies are intentionally lying and offering false promises. They just don’t know any better. They believe what their approaches are telling them. However, the processes and techniques they use are ineffective when it comes to understanding and calculating cost savings from a cash perspective. Additionally, the approaches are based on outdated and mathematically inaccurate accounting-based models. What makes the situation worse is the notion that the consultants’ prospects do not have effective processes to both challenge the consultants’ promises of significant savings and to take the project from concept to value realization via their own improvement project process or methodology.
An effective approach to addressing both concerns would include effective cash-based value quantification and an implementation process that would limit the influence and impact of the lies and false promises would have on decision making. Let’s look at this in more detail.
The Process to Achieve Value
A process is a step or series of steps that convert some beginning points or inputs into an ending point, outcome, or set of outcomes. For instance, there are processes involved with hiring someone, paying invoices, repairing a customer’s furnace, or creating a product that will be sold to the market. Value realization processes should start with an input, which could be a problem or ideas of where the company should improve, such as underperforming processes or people, high costs, low output rates, or poor quality, and then performing the steps of the process, leading to the creation of a tangible, cash-based outcome for the purposes of this book.
In general, when it comes to process performance, not all processes are the same. Some processes use available inputs or capacity such as people, technology, materials, and space, to create output better, more efficiently or more effectively than others. Some are faster or produce fewer errors than others. Some create more goodwill with the market than others.
When looking at processes and process performance, one can create a scale that represents process performance and effectiveness. This scale can be used to assess key performance attributes of a process. An example of a scale is shown in Figure 2.1. They generally go from a process not existing at all (0), as is the case with ad hoc processes in start-up companies, for instance, to well-defined, best-in-class processes you may find with highly functioning, well established organizations (4).
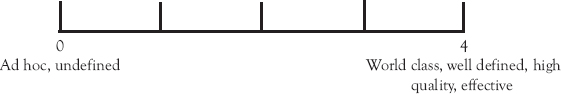
Figure 2.1 Processes can be assessed by looking at and plotting their capabilities on a defined scale. When doing so, it’s important to avoid the likely politics that will surface by having a third party, whether internal or external, review the work. Fewer people than there should be will agree to the idea that the process they oversee is underperforming
In this example and in my own work, I use 0 to 4, but the scale can be changed to whatever fits your purpose. However, it needs to be functional and provide enough clarity in terms of creating performance differentiation at each point on the scale. For instance, with just two points, the options are pretty limited. This may create a binary situation where either the process does something, or it doesn’t. With too many steps, the arguments end up being one of differentiation; “Why is this a 7 and not an 8?” If there are not clear and concise definitions between the two, arguments may ensue about a particular rank or value chosen, which can hamper progress.
The suggestion here is to assess both the value realization process and related subprocesses using this scale to determine how effective and mature the processes are and to find any deficiencies in the processes that can be improved to deliver greater value. It should be noted that the assessment should be performed by as neutral of a party as possible to avoid any biases regarding how effectively the process is performing.
To understand how this works, think about accounts payable at a start-up firm. Several people at the firm buy products individually that they use for work and either pay themselves or they are sent an invoice. If not paid for when the transaction takes place, they may pay the invoice at a later date themselves and request reimbursements from Susan, also known as the accounting department, in an e-mail or in a passing conversation. Sometimes they may submit the invoice to Susan and ask her to pay it directly. Susan may also combine it with other invoices from the same vendor and pay all that are due when she has time or during her designated accounts payable periods.
That is the level of sophistication that this process has within the organization. We see there is no formal process to pay the vendor. They just do what makes sense or is convenient at that moment. There may not be any matching of the invoice to what was purchased or received. There may be no consideration regarding available pricing discounts per a contract or review of the accuracy of pricing. There may be no consideration for the timing of the payment and possible discounts available for early payment and when no discounts are available, consideration for the best time to pay the invoice to improve working capital management. There are no checks to see whether there are penalties for late payments or whether the bill had already been paid by someone else. Instead, she just sends a check based on a request for her to do so. Invoices arrive and someone hopefully pays them. This would be considered more of an ad hoc process; no standardization, rules, repeatability, metrics, controls, or governance.
On the other end of the scale, there is a well-thought-out formal process that is automated, documented, repeatable, effective, efficient, fast, with proper controls, and low risk. Purchases are made via the company’s e-procurement system. All invoices are sent electronically to a processing center, which could still be Susan, where the data on the invoice are automatically checked against a contract and against the actual transaction: what was bought, received, when, and by whom? The system automatically verifies that the invoice has not been paid previously to eliminate duplicate payments. It then checks to find the ideal time to pay the invoices to optimize working capital. If there is a reduction in price for early payments, the payment will be sent electronically at a time that will follow the terms to realize the reduction, but not sooner. If there is no discount, payment will be made on the due date and not before, so the company can hold on to its cash for investment purposes. A process like this may be on the opposite end of the scale.
Reconsidering value realization, most companies have processes with capabilities that are somewhere in the middle of this scale. Based on my experience, if I were to plot the value realization processes that I’ve seen in organizations large and small, most would tend to be on the left side of the scale; many on the far left. The process may not be defined, documented, or repeatable with standard procedures, techniques, or controls in place. In other instances, these factors may be in place, but they are often rudimentary.
Consider the process of justifying improvement projects financially. At a high level, we know we need the project scope, objectives, plan, tasks, and deliverables, a CBA, and an approval from management, so we prepare them all for review and consideration. Each iteration looks different and uses different techniques and assumptions to determine scope, assess strategic importance to the company, and to calculate, and analyze the benefits. There is no standard way to categorize and prioritize potential projects.
With such approaches come risks. How does one know the approach used appropriately represents the value opportunity? Did they use acceptable tools, techniques, and assumptions to represent the projects? How does one compare projects, investment opportunities, and returns if each team uses a bespoke approach? How do we know one investment opportunity is better than another in terms of the importance of the process in the eyes of customers or its ability to create cash returns for the firm?
Companies with more evolved processes will generally focus on standardization, efficiency, and effectiveness. There may be, for example, one technique or template for CBAs, and a formal review of project opportunities. However, a full blown, highly effective process for selecting, justifying, and realizing the value may still not exist. Even if it did that would still not guarantee success. Let’s think about why.
Ineffective Steps to Cash Value
When one looks at a cash value realization process, oftentimes the steps are ineffective in the context of how they guide companies along the path to value. There are generally five steps along the path to cash value realization:
1. Project identification and selection;
2. Project justification;
3. Define path to value realization;
4. Benefit articulation and projection;
5. Implementation and value realization.
Let’s consider in turn.
Project Identification and Selection
The first step in identifying improvement opportunities is asking whether there is truly a problem or opportunity. In their book, Let’s Get Real or Let’s Not Play, the authors, Mayan Khalsa and Randy Illig make a strong argument for justifying whether there is truly a problem deserving of improvement or change and understanding more about why it may or may not be a problem. We may believe there is a problem notionally, but what proof is there? How do we know there is a problem? To address these issues, the authors offer an “opportunity checklist” that companies should consider when looking at improvement opportunities:
Issues: What problems or results [are we] trying to address? In what priority?
Evidence: How do we define the problem? How do we measure success?
Impact: What are the financial, [nonfinancial], and intangible costs and benefits?
Context: Who or what else is affected by the issues and the solution?
Constraints: What has stopped (or might stop) the organization from resolving these issues?5
I find this to be a very good way to start down the process of identifying improvement opportunities. From personal experience, many individuals in organizations don’t have an effective approach to ensure there is, in fact, a problem worthy of being addressed. They talk past each other, create assumptions about issues without gathering facts, use terms without an agreed upon operating definition, and assume we are talking about, and addressing the same problem without having defined the problem effectively.
The evidence portion is critical, yet oftentimes, we don’t pay enough attention to it. How do we know we have a problem? When we fix it, how do we know we’re successful? In some cases, it’s clear and in others, it’s nonexistent. For instance, I was asked to serve on a diversity and inclusion initiative committee at a university. In the first meeting, there was talk about creating a mentorship program for minority faculty. I asked if we knew there was a problem and although many answered in the affirmative, no one had any actual proof. There were no data presented that supported this notion and the problem the mentorship program was supposed to address had not been defined. Hence, the group was looking to create a solution to a problem that had not been defined or proven to be an issue.
How do you create a solution to address something that has not been defined? How would success be determined? We could have spent money to address a problem that may not even exist, and true success would be fleeting if it existed at all because there was no problem resolution defined for the solution to address. Without asking tough questions such as those proposed by Khalsa and Illig, companies can needlessly chase opportunities, wasting money and other resources along the way.
With impact, we want to create an understanding of what success will be to the organization. Will there be improvements in profit? Cash? Will we free up capacity for other uses? Are the improvements difficult to measure, but nevertheless important, such as when we consider factors like goodwill? Context, too, is important here. Whose work or output is affected by the issue, and how will they be affected by the solution, both positively and negatively?
Lastly, if this is an issue or problem for the organization, what has kept the organization from fixing it in the past? Will the previous resistance or lack of action create constraints in moving forward? One may define a solution that seems grand or obvious. Key questions may be, “If this is such a great idea, why haven’t we implemented it before?” or “Have we tried this before, and if so, why wasn’t it successful?” Such questions identify potential red flags that may obstruct the value realization process.
Thinking through these factors will help validate whether the problem is something worth considering at all.
The second step in project identification and selection is considering the extent to which the improvement opportunity is aligned with the corporate strategy. It’s likely that at any given point in time for a larger organization, multiple people will find problems related to their areas. In fact, there is often no shortage of improvement project opportunities for companies of all sizes. The question is, which projects should they select, and which are either shelved or thrown out altogether? The justification is often value based, anecdotal, or politically motivated. What you don’t often see are the following two scenarios.
Scenario 1
Alignment with the corporate strategy should be an important criterion when considering improvement projects. This will ensure improvement efforts and the requisite investments in them will have an impact on the execution of the strategy. The process of considering and ensuring strategic alignment forces us to consider the strategic importance of the project, and as a result, should play an important role in the prioritization process.
When strategic alignment isn’t considered, decisions can be made that may not be effective in advancing the strategy. Let’s say process A is customer facing and is important to sales and growth. Process B is a back-office process that touches many people and has a highly vocal leader speaking in support of the improvement opportunity. If they have the same savings potential, there are limited funds for investment, and failing to fix process B will not lead to general outrage by employees, which one should you choose? It’s quite possible the back-office project may be selected, even though the customer facing process may be more strategically important because it is market facing.
This happens quite frequently. Why? Oftentimes, the issue being addressed may resonate more because the process is internal, may be seen by, or affect more people, and the negative effects of the poor process may appear to be greater than the one that is outward facing. This may cause the issue to be fresher or more salient in the minds of those involved in making the decision. It doesn’t hurt that the need for the improvement is made by a more outspoken leader. As a result, it may appear that this project should have a higher priority than the customer facing project.
Without an approach that sets clear parameters for strategic alignment, the selection process may be about fire and thunder, politics, emotion, or persuasion rather than the facts of the situation and what is truly most important for the company’s future growth and brand. Sometimes it’s better to invest in the back-office opportunity. However, in many cases, it’s more important to invest in those processes that affect relationships with the customer, sales, and market growth. We need, then, a set of criteria that will help us understand these circumstances and guide us toward this decision rather than relying on an ad hoc, discussion-based, anecdotal and politically driven decision-making process.
Having a process to assess strategic alignment is not about excluding processes because they’re deemed less important. Although certain processes and functional areas may have greater alignment with the strategy than others, this says nothing about relative importance of the process. All areas are important and play a role in the functioning of the organization. However, for a product-based company, product development may be more aligned with the corporate strategy than, for example, accounts payable. The improvement project selection process should recognize and acknowledge this and take a process’s strategic alignment into consideration when prioritizing projects.
Scenario 2
The next factor that is often overlooked is the type of project being proposed. There are generally three types of projects that companies buy or execute: information, plan, or implementation. The project type influences the cash savings potential and the timing. This will create context for what to expect in terms of benefit realization opportunities and when you can expect the benefits to occur. It will also provide context for what circumstances will lead to cash benefits and which will not. We know, for instance, that cash benefits will come primarily from implementing or executing a project. If you do not implement, you will not see cash improvements.
Going back to Chapter 1, companies may require a financial justification for every major expenditure, whether there is cash value or not. When there is no justification and you need it, what do you do? You make it up. To illustrate, let’s say you have a division of a company you’re looking to sell, and you engage a consulting firm for help. There may be elements of the opportunity for which you need clarity, so you hire the consultants to help you figure them out. The information they provide may be of value to you, but the result of their work, alone, will not lead to direct cash improvements for the organization. Hence, there will be no direct cash ROI.
However, I’ve seen financial justifications for projects that will only provide information, such as strategy projects and risk assessments. Information itself has no cash value proposition. It’s only when you act on information that cash can be affected. However, there may be a value proposition requirement imposed by leadership; “If we hire these consultants, what will be the benefit? We need a financial justification for this $1M.” In reality, these projects themselves save absolutely nothing. The savings are tied to the execution. So, what do you do? Do you start guessing at what the post implementation value of their benefit would be without even knowing what they will find and propose? How effective of a management approach is that? This isn’t to suggest information projects are not important. The information may be very important and highly valuable. However, requiring teams to document financial value for a project that cannot deliver it makes little managerial sense.
With project selection, there needs to be contextual information that will help prioritize projects based on project type when resources, budget, or time are limited.
The combination of the strategic importance to the company and the type of projects the company is considering can help leaders focus the company on which improvement project they should invest their cash, all things being equal. We will discuss this in more detail in Chapter 5.
Project Justification
The CBA, has several names, but the concept remains the same; what will the project cost and what financial benefits will be realized as a result of its implementation? For the purposes of this book and the cash value realization process, all CBAs should be cash focused. This does not mean other elements should not be considered. On the contrary, throughout the book, I will discuss noncash benefits and how to model them using capacity maps, but the main purpose of this book is specifically creating cash value.
There are typically four problems companies run into when attempting to create a cash-based a CBA:
1. Project costs aren’t always cash;
2. The benefits do not distinguish cash cost savings from noncash cost savings;
3. The size of the financial benefit is often inflated;
4. Lack of clarity regarding how to achieve the real cash savings opportunities.
Let’s discuss each briefly now, and in more detail later in the book.
Project Costs Aren’t Always Cash
The cost portion of the CBA typically focuses on the cost of the project and any associated fees. The key questions to be considered are, “What is the cost?” and a second, often overlooked question is, “Cost to whom?”
Consider labor costs for an IT project. A company has an internal resource who charges a department budget $60 per hour for her IT-related work. Compare this to having an external resource who charges $60 per hour to the same project budget. The manager overseeing the budget and asking the question “What is the cost?” will see the $60 per hour is the same with either resource. When she asks “Cost to whom?” there is a different story.
To her company, there is a significant difference. The $60 per hour internal employee works at the firm and is often salaried. This means she will be paid whether she works on the project or not. Her firm has committed to paying her to do her job, which may or may not include the project for which she is being considered. Her salary is the money spent by the company and has nothing to do, abstractly, with the work she is doing.6 The external resource causes the firm to spend additional money; money that would not have been spent otherwise. In other words, when they hire the additional resource, an additional $60 leaves the company for every hour of work, which, again, is not the case for the internal worker. In a worst case scenario, if the internal IT resource works for the company yet the project manager chooses the outside resource instead citing the same cost, the company is actually in a worse situation. The money paid outside the firm means the firm pays for the IT staff employee and for the external support, which is a greater cash hit to the firm.
There is a cash cost associated with hiring the outside resource. An example of a cash cost is something for which there is a cash transaction.7 For instance, when you buy materials for inventory, there will be a cash transaction associated with paying for the inventory. However, when you consume the material you bought, there is no cash transaction involved.8 You can put a value on the material consumed just as you could for an hour of the inside IT staffer’s time but imputing a cost does not automatically make the resulting financial value monetarily based.
An example I like to use as to illustrate this point is the following. Assume I like to bake, and I bought a 10-pound bag of flour for $10. The cash transaction was $10 for 10 pounds of flour. If I use one pound of the flour, I can say the cost of the flour used is one dollar. However, there was no cash transaction for one dollar when I use the flour I had already paid for. And the one dollar isn’t exact either. If I use one pound and throw away the remaining nine pounds, is that one pound still worth $1 or is it worth $10? The answer is “it depends.” We will see later in the book the $1 is a function of how we chose to calculate the cost. It could just as easily have been 79¢ or $1.24. If it were a cash cost, however, it would not depend on any extraneous factors. Cash is exact; its value and quantity are solid and irrefutable. That we paid $10 for the flour or not is indisputable; what is disputable is how we choose to value the one pound of flour we consumed.
This will be important when considering value quantification. Some attempt to dismiss this notion of noncash and cash costs as the difference between soft and hard costs, and suggest hard costs are cash oriented. Few things could be further from the truth. There are some seemingly very hard costs that, when reduced, have no cash savings at all. In fact, they have nothing to do with cash. Consider one of the hardest costs there is, product costs. Product costs are composed of direct material, direct labor, and overhead costs. Direct materials and labor are considered variable costs in accounting because their values “change” with output. Because they are “clear” and documentable, we focus on them and trying to reduce them so we can improve our margins, our profitability.
Going back to the baking example where the $1 for flour can be practically any value between $0 and $10 as a direct material cost, companies often look at these costs and consider them hard costs. However, we will see both in the next section and the next chapter, these costs are as soft, mathematically, as something like the “cost” of goodwill and will have nothing to do with cash. Hard and soft costs are defined in the context of accounting information but not in the context of cash transactions.
Benefits Do Not Distinguish Cash and Noncash Costs
As with the costs of the project, there are cash and noncash benefits as well. Going back to the flour example, let’s say we have a laborer we pay $20 per hour. Assume she can make five loaves of bread per hour. We choose to divide her $20 by output to calculate a labor cost of $4 per loaf while maintaining the $1 per pound material cost. Assume a new technique or technology comes all that allows her to miraculously increase her output from 5 to 10 per hour. This is assumed to reduce the cost to produce the unit from $5 ($4 labor and $1 materials) to $3 ($2 labor and $1 materials). We still pay $10 for every 10-pound bag of flour and $20 for each hour of labor. Nothing has changed from a cash perspective. However, if we take advantage of the improvement and make loaves faster, our output rate will increase. If so, since we are going through the flour at a faster rate, cash leaving the company will increases because we are buying more materials. So, where is $2 being saved from a cash perspective? The answer is, there isn’t $2 cash being saved.
This is a noncash improvement. Just considering the cash of the matter, we paid for the 10 pounds of flour to be there. It is available to be used whether we use it or not. Additionally, the cash we paid to have this flour will not change as a result of consuming it. The same happens with labor. What we paid the worker did not change with output. If she is there on the clock, she will get her $20 whether she produces 5, 10, 0, or an infinite number of loaves. The cash, in this situation, does not change even though there is a calculated cost savings to what is typically considered a hard cost.9
Noncash costs result from calculated accounting costs. If you must figure out what something costs, chances are, it’s not a cash cost.10 For instance, we knew we paid the laborer $20 to work one hour. That is clear. However, when you want a labor cost for a loaf, you must figure it out. Do you take the total output created and divide that into the hourly pay rate as I did? Do you come up with a cost per minute rate? For instance, for the laborer making five units per hour, the cost per unit may be $4 using the previous calculation of dividing the hourly wage by output. However, what if each loaf takes nine minutes to make? Now, we’re consuming 45 minutes rather than the full 60 minutes. If we have a calculated cost of 33¢ per minute ($20÷60 minutes), that suggests each loaf costs $3 in labor, not $4. In either case, the cash remains the same. What is different is how you put a value on the consumption of the labor.
As we will see throughout this book, it will be very important to understand the difference between cash and noncash savings. You may be asking yourself, “What does this have to do with improvement projects?” Well, a lot. This is how value propositions are often calculated. I’ve often heard consultants and software salespeople say they can make your $2 million department 5 percent more efficient, saving you $50K. This is how the $20 million and $50 million software value propositions mentioned in Chapter 1 were calculated.
This technique leads to totally bogus values placed on improvements. Let’s go back to Oracle. According to CFO magazine, “only a small portion (about 13 percent) of the $2 billion gain Oracle anticipates will come from outright savings on IT costs.” Let’s assume, for the moment, that the IT costs represent money spent. Most of the value will derive from increased productivity. The CFO explains: “If 80 percent of our 40,000 employees are customer-facing, and if we can boost their productivity 20 percent to 30 percent thanks to an integrated suite of web-enabled applications, that equals about $1.45 billion a year reaching the bottom line.”
Benefit Inflation
The Oracle proclamations are examples of benefit inflation. Two billion dollars is certainly an impressive number. However, if the real savings are 13 percent of this, we’re talking $260 million. This is not insignificant, of course, but it’s not $2 billion. As is more often the case than not in my experience, companies claim to save, or promise to save, a significant amount of money when, in fact, they have not or will not save anything close to the value. Noncash costs have the same units as cash costs; they’re all monetary units such as dollars. So, the $2 in savings from the improvement described in the baking example earlier appears the same as cash cost savings, since the unit of measure is dollars in both cases. There is nothing on the surface to distinguish this noncash savings from a true cash savings. This creates a challenge when we calculate the saving.
When we add the noncash savings to the cash savings, the total amount in dollars is higher than if we only considered cash savings. This is benefit inflation (Figure 2.2). Benefit inflation is real, and it is a significant issue. Go back to Oracle. Of the purported $2 billion in savings, a full $1.45 billion was noncash as mentioned previously, approximately 72 percent (Figure 2.3). The CFO mentioned the $1.45 would hit the bottom line, but how? Through increased sales? Increasing sales isn’t savings, it’s generating revenue. Did Oracle’s sales increase by $1.45 billion due only to their software savings? Not likely. To achieve a $1.45 billion boost to the bottom line as the CFO promised, with a 77% gross margin and a 30% tax rate, Oracle customer facing people alone would have to create a marginal increase in sales of $2.69 billion over the organic growth the company was experiencing. The savings will certainly not come from the productivity increases that hit sales, general, and administrative (SGA) because if the people still work there and their salaries were not reduced, how would SGA change? In the end, one must question just how much money had been saved.
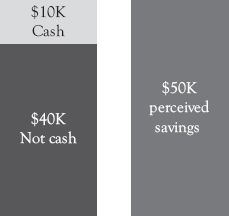
Figure 2.2 In many cases, value propositions are created with both cash and noncash elements. The noncash savings are the source of benefit inflation. They’re often easy to create and large in scale
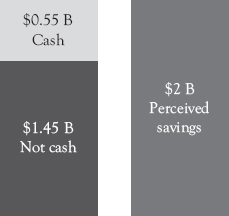
Figure 2.3 More than 72 percent of the savings promised by Oracle’s CFO is not cash. Two billion dollars certainly sounds much more impressive than $0.5 billion. This is an extreme case of benefit inflation
Note: The math is inconsistent as per the CFO’s comments. This figure represents the $1.45 billion in promised savings with the difference being cash. However, IT savings as laid out in the article would be $260 million not $550 million.
We learned early in life we can’t do things like add apples and oranges. My ten-year-old son, to whom this book is dedicated, knows this. They’re dissimilar. The same is still true when calculating the benefits from improvement projects. When we calculate savings, the calculations often include both cash and noncash costs due to the similar unit of measure and a lack of distinguishing whether the value is cash or not. When we do this, we are adding dissimilar things assuming they are the same. This violates a basic rule of arithmetic.
Let’s go back to the $20 per hour laborer who is making loaves of bread. Assume we came up with a way to not only improve labor efficiency (10 loaves in an hour versus 5), but we can also buy cheaper materials; $8 for 10 pounds versus $10 for 10 pounds. The savings in material costs are real. We used to spend $10 and now we spend $8 for the same amount of material input. This is a savings of $2 per 10 pounds every time we buy flour. However, when considering total cost savings, this true cash savings is mixed with an artificial savings of $2 per unit in direct labor costs. This creates confusion regarding the source and extent of the cost savings and inflates the true savings. Consider Table 2.1.
Walking through this example, the company initially made 200 loaves of bread per week (five per hour over 40 hours). They spent $200 cash on materials and $800 cash on labor for the week. As the company increased output due to improved labor efficiency, the number of hours bought stayed the same, so the cash cost for labor is still $800. However, the increased output can only be sustained by buying more material, so the cash required for flour increases. We can see, then, that our cash costs have increased as a result of this improvement. However, there was supposed to be a cost reduction from being more efficient since labor costs have gone from $4 per unit to $2 per unit. Considering flour, the cost per loaf should have gone from $5 to $3, so the cost savings for producing 400 loaves should be $800. However, we do not see it directly, as cash leaving the organization, or cashOUT, for the labor in both cases was the same.
This would suggest that there is not a cash savings from the efficiency improvement itself. The same amount is spent on labor in the first and second cases. As mentioned earlier in the chapter, this calculated noncash savings is one of the hard cost savings that is truly soft. When we reduced the labor cost per unit, we did not see a corresponding reduction in spend. As we will see later, the increased performance can lead to opportunities to make cash improvements but will not do so on its own accord.11
Table 2.1 We can see the impact of cash and noncash costs by creating an example such as this and assessing how, when, and why cash flows out of the company
Output/ week | Material cost per week | Labor cost per week | Cash spent per week | Labor cost per item | Aggregated cost savings per week | Cash savings per week | |
Initial | 200 units | $200 | 800 | $1000 | $4 | 0 | $0 |
Improve labor | 400 units | $400 | 800 | $1200 | $2 | $800 | −$200 |
Improve materials | 200 units | $160 | 800 | $960 | $4 | $40 | $40 |
Improve labor and materials | 400 units | $320 | 800 | $1120 | $2 | $880 | $80 |
In the next scenario, we are looking at money spent on materials. To make 200 units, we initially paid $200 for flour. With the improvement in price, we now pay $160. We can see here there is a clear difference of $40; the company will spend $40 less per week on flour for the same output levels than they did previously. That is true cash savings.
Considering both improvements, we see that when the cash and noncash savings are combined, there is a pretty large improvement opportunity; $880. However, since the labor will not change, the only true cash savings is from the cost of materials. The improvement opportunity, as defined using the combination of cash and noncash costs, is over 10 times larger than the cash improvement opportunity in this case: $880 versus $80. This is benefit inflation. It’s easy to see the excitement that the company might have, believing they have saved both material and labor costs. However, the only real savings from a cash perspective will be from materials. What is sad in this example is the likelihood that someone may be willing to buy services for $10 to save the artificial improvement of $800 but may turn down the opportunity to truly save $40 in cash because it is too small! The comparison one considers is 79:1 ROI for $800 to 3:1 for $40, although the 3:1 creates cash and the 79:1 does not. We can start seeing the importance of focusing on cash here. If we increase this by three orders of magnitude, it says folks would rather spend $10 thousand to save $800 thousand in noncash, but less likely to spend the money for a $40 thousand cash benefit.
Artificial savings are calculated frequently when determining the benefits of improvement projects. Without understanding the fact there are cash and noncash costs and without distinguishing between the two, benefit inflation will occur. And note, benefit inflation is often an indirect desire or manifestation of those selling the opportunity, whether it’s an external vendor or an internal department head. The bigger the benefit opportunity, the greater the articulated ROI. This helps them build a stronger business case to move forward. The university director mentioned in Chapter 1 tried to inflate her benefits by not only including areas that would receive primary and secondary sources of benefit, but she also reached out to areas that may have been only remotely affected if at all. This led to a much higher articulation of benefits than would ever be realized by her project.
Lack of Clarity of the Path to Achieve Savings
True cash savings come from doing something; an act that affects the rate of cashOUT. For instance, material savings in the previous example involved buying cheaper material. Sometimes, however, the act, corresponding details, and those responsible for acting are left out of the situation. The most common occurrences I’ve seen have been tied to “if-then” statements; if we buy or implement X, then Y will happen. For instance, if we buy this software, then inventory will go down; then costs will go down; then sales will go up. The question is, “How?” For inventory to go down, how, specifically, will this happen? Who is responsible for making it happen? What steps must occur for it to be true?
Oftentimes, consultants and others may use benchmarks, wild guesses or even resort to pulling estimates from the insides of their lower digestive track to create savings values. These numbers often have no factual basis that are tied to your specific company and details describing the path to achieving the benefit are left out. In many cases, the path to achieving the benefit is the most important criterion for achieving lasting, meaningful change.12
An example is the situation from Chapter 1 where $20 million in savings was promised by a consulting firm to a former customer. The question, of course, was, “How will this happen?” What will change so that the company will be spending $20 million fewer dollars? For this to occur from a cash perspective, practically the entire engineering staff would have had to be fired. For that to happen, someone would have to lead the effort to fire each engineer. There are risks, however. What if they do not release the engineer? If she still works there, the improvement has not led to her being a part of the anticipated cost savings. Had they thought through what might happen if engineers got word their jobs were going to be eliminated prematurely? What is the contingency plan for the work if the entire engineering department is let go, who is responsible for it, and when might it be executed? What would they have to pay in severance and when? There was no clear plan of action to achieve the $20 million and considering the previous example in the section on benefit inflation, our analysis of the $20 million in savings promised showed the true value proposition was about an order of magnitude off. In other words, the maximum cash value proposition was $2 million, being generous, versus the proposed $20 million.
The path to savings is one of the most important steps to value realization, yet the detailed plan telling us how to achieve value is often lacking or needs significant work, putting value realization, especially cash value realization, at risk.
Benefit Projection
Benefit articulation and value projection involves the following steps:
1. Clearly identify the benefits of the project, which are most often improvements in capacity efficiency as we will find later in the book
2. Determine the magnitude of the benefit from implementation and the management steps required to achieve the benefit,
3. Articulate the benefit in both timing and magnitude, and
4. Project the managerial activities, timing, and benefits to create a forecast or schedule of anticipated operations and cash improvements.
These steps serve three primary purposes. First, they will paint a picture of the opportunity available to the company, in time, effort, spend, resources required, and benefits. This summary will serve as a basis for understanding the project, what is possible, and where some of the risks associated with benefit suboptimization may be.
Second, we can look at the timing of cash outflows and inflows to assess when the expenditures and benefits will occur, and why. For instance, when we know the cash outflows, we can compare that with the timing of realizing benefits to determine if the timing is acceptable.
For one customer, the difference between spending money and the realization of benefit was much too long. The cash payback was 72 months. By looking at the chart highlighting the cash expenditures and savings and understanding the sources of both, we were able to break the project into manageable chunks in a way that somewhat mimicked an agile project by using pseudo scrums. We were able to identify smaller chunks with smaller investments and faster cash value realization. This shifted the risk of the project and ultimately made it self-funding.
The third purpose is to serve as a baseline for comparison during implementation. The project execution and management action will be based on the assumptions going into implementation. Once in the implementation phase, we will be able to compare actual value realization to projected value realization. This does a three things. First, it helps us understand whether we are ahead of, on, or behind schedule. Second, it helps us understand why we are where we are by comparing the assumptions and actions necessary to achieve the benefit to what happened. In other words, did the required, planned actions occur or not? If not, why not? Last, information from plan deviations can be captured in after action reviews for use in future projects.13 This can range from assumptions being incorrect going into the project to improperly calculating the benefits to not properly considering or documenting the upside resulting from execution.
Benefits Realization
Two key considerations regarding benefit realization are execution with an emphasis on value realization and auditing the execution. The problem is, many don’t do either, or they don’t do them well. Oftentimes, the focus is on getting the projects approved. Once approved, it is often off to the next opportunity for leadership while the implementation team focuses on their work. Afterwards, the team is focused on project completion rather than value realization. For instance, the emphasis may be on getting the software up and running, which is an important step, but the specific activities involved with reducing the inventory to targeted levels may be compromised. This leaves a big opportunity hole for the company. Little or no benefit will be realized until the steps taken along the path to realizing benefit are executed. When the path, along with associated and necessary management action, does not exist or are poorly defined or poorly executed, realizable value is compromised. Of course, companies do execute because projects do get implemented. The questions are, “How effective were the plan and the path?”; “How effectively were they implemented?”; and possibly most importantly, “How much of the realizable value was actually realized?” We know this by comparing the value realized to the projected value as discussed previously. Sometimes this can be determined by looking at the financial statements. Going back to Oracle’s $2 billion promise, when reviewing their financial statements, for instance, there was no definitive proof or obvious smoking gun that reflected the CFO’s statement about value.
If benefits have been realized at the expected or an even greater rate, the questions are, “Why?” and “What can we learn from this for subsequent applications?” If you are behind projections, again, there are several questions such as, “Why?” “Were the benefits inflated?” “Were the assumptions not properly documented or handed off to the responsible parties effectively?” “Were the management actions not executed or did they fail?” All of these questions, both positive and negative, should be addressed in the after action review.
The second area is auditing the benefit realization. This is how we gain the information mentioned previously. The actual plan will vary from the projected plan for several reasons. As a result, it is imperative to review the execution plan so that actual benefit realization can be compared to projected. This will help identify both deficiencies with the implementation as well as unanticipated benefits. In the end, without purposefully auditing progress, comparing reality to projections, and looking to understand the variances, there is no assurance many, if any, of the anticipated benefits have, or will be realized. This is key information when implementing both the current project and when defining and implementing future projects.
The rest of the book will focus on both the process and the techniques. The objective is to provide you with tools that will help ensure greater cash ROI. Next chapter, I will focus on explaining why the traditional ways of financial value quantification limit, and sometimes even deter cash value realization, and how we can look at the process differently.
1. For the purpose of this book, realizing cash value is key. Accounting information is of little use at best, and is harmful at worse.
2. An effective, repeatable process must be in place for true cash value realization for all projects.
3. Companies must separate cash and noncash costs and savings and avoid combining them to inflate the benefit opportunity.
4. Oftentimes, implementing the project is not enough. There will be additional management action that is enabled by the improvement project, and it is this management action that will lead to cash value realization.
1 S. Leibs. July 01, 2000. “ORACLE’S billion-dollar BOAST.” Retrieved March 05, 2020, from www.cfo.com/2000/07/oracles-billion-dollar-boast/
2 R.T. Yu-Lee. July-August, 2005. “Margin Improvement: More than a notion?” Industrial Management, pp. 21–26.
3 R.T. Lee. 2018. “Strategic Cost Transformation: Using Business Domain Management to Improve Cost Data, Analysis, and Management.” Business Expert Press.
4 I will show that accounting cost reduction is not real cash.
5 M. Khalsa and R. Illig. 2008. Let’s Get Real or Let’s Not Play: Transforming the Buyer/Seller Relationship, 72. New York: Portfolio.
6 Lee 2018.
7 R.T. Lee. 2016. “Lies, Damned Lies, and Cost Accounting: How Capacity Management Enables Improved Cost and Cash Flow Management,” Business Expert Press.
8 Ibid.
9 Some may suggest, “Yes, but we can sell more.” There are three issues with this statement. First, sales is a revenue issue, not a cost issue. Second, there is an assumption that there is demand for the increased output. This may not be the case. Third, not all processes create salable output, so this suggestion is not generally applicable to improvements throughout the organization.
10 Ibid.
11 Lee 2018.
12 C. Heath and D. Heath. 2010. “Switch: How to Change Things When Change Is Hard.” Broadway Books.
13 R.J. Baker. 2007. Mind Over Matter: Why Intellectual Capital is the Chief Source of Wealth. Wiley.