Design Improvements in the OC Domain
Capacity maps and the BCC Model describe capacity dynamics; how much we have, how it’s used, and the output we create with it. Improvement projects will change how we use the capacity or what we can create with it. In limited situations, cash improvements will occur, such as when more output leads directly to more sales. However, in most cases, managers will be required to make changes to realize cash benefits. Capacity maps, used to model the OC Domain, will help us define the impact of our improvement projects, and determine the subsequent steps managers must take to realize cash benefits.
Chapter 6 focused on the source of operational and cash value; how improvement projects improve the use of capacity. Chapter 8 focuses on the financial benefits of improvement projects. This chapter focuses on how to describe the extent to which the project may affect how you operate and will show you how to define the management actions that will be required to achieve cash value. There is a temptation to discuss improvement strategies such as what to do in an expanding, declining, or steady market here. For example, if the market is expanding or declining, what should the capacity strategy be? However, this book focuses on the techniques of documenting and managing the improvement, rather than which tactics or strategies a company should employ.
The documentation happens in four steps:
1. Document current state using As-Is capacity maps.
2. Create improved state using Working capacity maps.
3. Define future state To-Be capacity maps.
4. Describe management action path from As-Is capacity maps to To-Be capacity maps.
From these four steps, we will have a clear picture of how the OC Domain will be transformed by the improvement, and what specific managerial actions will be needed to make the improvement. Let’s go through each step.
As-Is Capacity Maps
When documenting the current state, we want to create capacity maps of the process or process steps we want to improve. We begin with the BCC Model by mapping how much capacity we’ve purchased in its consumption units. For instance, if we buy time, we want to document the amount of input capacity we purchased in time units such as hours, shifts, days, weeks, or months. If we buy space, we document in square feet or square meters. Documenting input capacity in this way allows us to compare the amount of capacity purchased to the amount consumed when creating output.
The next step is to determine the approximate average consumption rates. The last part of the sentence was very carefully worded. There is a desire to want to focus on doing detailed analyses to determine precise consumption rates. It may be tempting to focus on time studies or time sheets to determine these values. My experience suggests this is, at a minimum, overkill and maximally, disruptive and questionably unproductive. Consumption rates for the same task will vary and, at times, significantly. Sometimes the variation is due to a definable cause and sometimes because of natural variation; some days are better than others for an individual, and some people are more efficient than others. To gather precision here may put you in a position of diminishing returns. Does it matter in the OC Domain if you determine a space consumption rate of 5,026 square feet or is approximately 5,000 good enough? The rate of 5,000 as an approximation is fairly easy to come by without hiring a company or assigning tasks to workers who have other things to do, thereby increasing their consumption rates, too. This is especially true when we will be rounding cost and benefit estimates.
Timesheets are even worse. It is common knowledge that practically everyone has at one time or another, put false information on their timesheets. My friend Ed Kless is known to ask rooms filled with professionals if there is anyone who has never put false information on a timesheet. To my knowledge, he has not found a single individual who has never fudged data on a timesheet, and there are a lot of data points because Ed is a very highly sought-after speaker. Sometimes we do not remember how long a task took. Other times, meeting expectations, such as time spent on a task, may cause someone to be less than truthful. The latter is especially true when folks are managing the “cost” of a project. If a task is estimated and therefore budgeted to take two hours and it takes three, there are times where there is pressure to report two rather than three to help manage the “cost” and “profitability” of the project.
We are all estimating; some of the estimation has good intentions (“I honestly believe it took 1.25 hours”) to deception (“It was supposed to take one hour, so I will put one hour although it really took 1.25 hours”). When this happens, it consumes capacity to create false numbers, so the questions are, why do it in the first place?, and if we know there are lies, why isn’t the information considered highly questionable?
The next step is to determine the output or demand required for the operation or process. Demand is important because when designing our improvements, the idea is to align output with demand. By defining demand here, we can see where we have over- or underproduced. If we overproduced, made more than demand required, it is likely we consumed more capacity than we needed to. To consume it, we must have it, so there is also the chance we spent more on capacity than we needed to, possibly leading to higher cashOUT than necessary. If we underproduced revenue generating items, we may have foregone revenue because we did not have enough output for the market, leading to lower cashIN than is possible. For internal processes and those that are not salable, we’re looking at work potentially being delayed or, in some cases, not being completed at all without increasing the capacity available to do the work.
There are two types of demand: essential and extraneous. Essential demand is that which is required by a customer, whether internal or external. It is demand that we use as a basis to determine whether we are being effective in the context of those who require the demand of us. Extraneous demand is any other demand that is not required by a customer. This is not meant to be a judgment or an assessment of demand. However, extraneous demand, when not managed or scrutinized, inflates the perception of the capacity needed (Figure 7.1). When demand is inflated, the perception of the amount of capacity required, too, is inflated, leading to higher than required capacity being purchased.
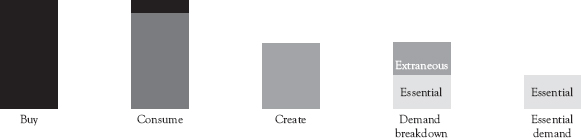
Figure 7.1 When we add extraneous demand to essential demand, we inflate total demand. When we have inflated demand, we tend to justify carrying excess capacity to create output to meet this demand. However, if we reduce extraneous demand, the real demand is lower, which may allow us to meet this demand with less input capacity
Once we have documented the demand, we should have a clear picture of the current state and can use this as a foundation for improvement.
Working Capacity Maps
After the current state is documented, we shift to thinking about how the improvement will affect the OC Domain. Something will be different, and our objective is to identify and document the difference, and the extent of the change. This is where Working capacity maps, or Working maps, come in. We will use Working maps in two ways. The first is to document options for how the improvement may change the As-Is scenario. The second is to show the key implementation steps that will take us from As-Is to To-Be. Let’s look at both.
Documenting Improvement
As mentioned in Chapter 6, most of the improvements will result from increases in efficiency. Recall, this is either in the form of creating the same or similar output with less input or creating more output from the same level of input. At this stage, we can understand, notionally, what will change. For instance, we may know that we can process invoices faster or handle more service calls than before. However, we need to take it to the next level of precision. Now, what is important is not only what will change, but also the extent to which it will change. If the improvement enables the creation of more dynamic capacity, how much more will it create, how, and how might that affect output and output potential? Recalling the example from Figure 6.6 as Figure 7.2 here, we often find that we have options. A shows the As-Is map. From the improvement, one option might be B, where we choose to buy seven instead of eight hours. Option C, too, is available to us. By showing both options in this case, conversations can occur among leaders and stakeholders to decide just how far they want to go with the improvement. By showing both B and C, implications of both can be considered and based on the considerations, a direction can be chosen.

Figure 7.2 Working capacity maps show us options that are available as a result of improvements. They work well with scenario planning
After the direction is chosen, we have to document the specific managerial actions that need to be taken. For instance, with B, the action is to buy one hour less of input capacity. Looking at this situation, two conclusions should be noted. First, the person is still creating extraneous demand, as the essential demand is for 50 and the output is 56. Management is accepting the notion they are being overproductive in this case. Second, there may be temptation to have the worker do something else with the extra time. That is fine, but since cashOUT is not affected when workers are reassiged, there will be no cash savings.
If C is chosen, the company is taking the extra step to eliminate extraneous demand and is instead, focusing on aligning output with essential demand and reducing input capacity. This will reduce cashOUT for the company because it is buying less labor input and there may be reductions in the amount of material capacity it is buying as well in a products-based environment. This leaves the company with a smaller margin of error, but if they are comfortable with this after the conversations comparing B and C, that is the risk they will take.
Steps Toward To-Be
The other way to use Working maps is to document how and when capacity levels will change as we traverse the path to the To-Be state. Consider a situation where a company may look to lower costs by buying less warehouse space. Initially, the company has 100 thousand square feet of warehouse space, and they are consuming 90 thousand. As a result of the improvement project, they now only need 60 thousand square feet. The company will find and lease 75 thousand square feet at a new location. However, there will be a period where the company will have warehouse capacity at both locations until the move is completed. Once completed, they will move out of the first location and end the lease (Figure 7.3).

Figure 7.3 Working maps can also describe the progression of improvements that can lead to the desired future state
A Working map used this way does two things. First, it shows the interim steps of the implementation visually. This will help those involved see the steps and understand the changes that are proposed to be made during the implementation. Doing so also demonstrates the team understands the changes that need to be made and the impact they will have on the organization. Second, because the steps are salient, leaders can see that there will be situations where there may be waste during the transition. For example, at step 3, we have a significant amount of extra warehouse capacity. This should create an incentive to move quickly through this step so that the company can minimize cashOUT tied to paying for both warehouses.
To-Be Capacity Maps
The final maps are the To-Be capacity maps. To-Be capacity maps demonstrate the projected future state after the improvement project is completed. Designing the maps involves the same steps as before, however, their use is what is key here. Once determined, To-Be maps should not change until management and the project team agree to do so. They serve as a baseline for improvement and model what the improvement is expected to be. As such, any variances from the To-Be map may affect the benefits expected from implementing the project. For instance, if the organization designed a To-Be map that had 75 thousand square feet of warehouse space but the company ended up with 100 thousand, the reasons this happened and the resulting implications should be documented and discussed. One hundred thousand square feet means they now have an additional 25 thousand square feet. The questions are, why is there a difference? and what is the implication of this difference? Is the lease a lower monthly cost for instance? If someone found a deal and the total cash cost of moving to the 100 thousand square feet location is lower, it might make sense to do so. At that point, the team may agree that the To-Be state will be 100 thousand square feet versus 75 thousand, and the To-Be map and the expected benefits are documented and updated accordingly. Only when there is a change and that change is approved and signed off on, should the To-Be map change.
As mentioned in Chapter 6, and earlier in this chapter, improvements, in most cases, are caused by increases in efficiency. They affect efficiency by affecting output or dynamic capacity. Recall, we either make more output consuming the same capacity, or we create the same output by consuming less input capacity. Although the cost per unit of output may have decreased, this is a costNC reduction. As long as the capacity levels remain the same and unless there is an increase in output that leads directly to sales and not the hope for increased sales, there will be no improvements to cash performance.
The way we get cash benefit is through changing the rate that cash enters and leaves; by changing cashIN and cashOUT. Generally, once the improvement is in the implementation phase, changes to cashIN and cashOUT happen through management action. As we’ve seen, by increasing our efficiency, we position ourselves to have excess input capacity. It is the combination of reducing extraneous demand and making changes to the level of input capacity that will change the input capacity required and, therefore, the amount of input capacity we have to buy. Buying less capacity reduces cashOUT. Another option to reduce cashOUT is to buy cheaper capacity.
The process to realize cash benefits from a cost reduction perspective involves looking at the To-Be map and deciding what decisions can lead to reductions in cashOUT with an acceptable level of risk. For instance, we may need to change how much labor or material capacity we buy. In the case of moving space, we may have to spend cash to break a lease before we realize the benefit of cheaper space capacity.
All of the decisions involving changing capacity levels should be identified and documented, both using the Working capacity maps and in the project plan that will be created for the implementation. These are the steps that we will need to take to help us achieve the cash value and that, if we do not execute them, the value potential is reduced. For instance, shifting to a perpetual inventory management system that keeps track of inventory is nice in terms of understanding how much inventory we have. However, if the objective is to reduce inventory, we have to purposefully slow the rate of buying and creating inventory so that demand and the subsequent consumption can reduce it to the desired levels. This may mean a combination of changes made in procurement, production control or order release, and possibly sales so that demand is greater than production, leading to lower inventory levels. Someone must ensure these changes occur, and that’s management.
Sometimes the specifics regarding management activities are difficult to identify because of the uncertainty involved. Uncertainty prohibits us, in many cases, from having a specific improvement projection. For instance, it’s often hard to suggest that software that prescreens customer service calls will increase the output of a customer service rep by exactly three calls per hour. When this happens, a technique that works is to bound the potential values. Generally, there is an upper bound that is more optimistic, and a lower bound that is more pessimistic. We establish these bounds to reflect the uncertainty that is involved with implementation. In this example, considering the dynamics of the improvement, we might be able to determine that the improvement may increase the output by between two and five calls. We can lay out the assumptions regarding why it may be two and why it may be five.
We want to describe the situation by asking questions such as what must occur or what must be true to achieve the upper bound. On the lower bound, we ask questions that will paint a clear picture of what may be the cause of us only achieving the lower bound improvement. For instance, considering the upper bound, we may ask, “To achieve five, what must be true?” or “What must we do or what must happen for us to achieve the five?” This will identify the management action that would lead to the upper bound. Similarly, “What conditions must exist for us to only achieve a two call improvement?” or “If these things don’t happen, our increase will be limited to just two.”
By bounding the opportunity and the associated assumptions and answers to questions, you do two things. First, you reduce doubt that may affect the decision to move forward. For instance, assume you suggest your project improvement will yield a four call improvement. If someone has reservations regarding whether exactly four will be achieved, the improvement may be halted, delayed, or questioned because the value, itself, may be questioned; four or not four becomes the defining criterion. If someone does not believe the improvement may yield a four call improvement, they may hinder the process by arguing the projection is incorrect. When bounding the value opportunity, there’s usually not a yes or no question being pondered. Instead, the conversation shifts to where, between the bounds in the improvement opportunity continuum, are we most likely to fall and the extent to which the assumptions can be affected or influenced by management action (Figure 7.4). This is covered in a bit more detail in Chapter 8 as we think about the specifics regarding documenting how much benefit will result from the implementation.

Figure 7.4 The improvement opportunity continuum represents where the team believes the potential value will be. Both the upper and lower bounds should be identified with associated assumptions and management action supporting the bounded values. It’s important to have broad conversations about the assumptions and the value with key stakeholders. This will help gain their buy-in and reduce the risk of an aborted or delayed project
Once we have identified the future state, the path to achieving the future state, the managerial actions required, and the range of possibility for the improvements due to uncertainty, we look to determine the financial benefits generated and project those benefits into the future. That is the subject of the next chapter.
Key Takeaways
1. All improvements should be modeled in the OC Domain. The Business Activity Framework serves as the basis for how the business operates, what we are looking to change, and the cash impact of the change. Note, the Accounting Domain has no role in this process.
2. We can model the improvements using capacity maps. As-Is, Working, and To-Be capacity maps show the current state, the future state, and the steps that are involved to traverse the path to improvement.
3. When going from the As-Is map to the To-Be map, there will be management steps required to change components of the Business Activity Framework so that cash improvements will be realized. It is important to begin documenting these activities as we think about what is required to achieve the improvements.
4. It is highly recommended that improvement projections are bounded showing an upper and lower bound. This will help avoid lengthy debates. It will also help the team understand the potential improvement, what assumptions must be addressed, and the management steps necessary to achieve the desired level of performance and to avoid the undesired.