
We construct our own widget from basic graphic elements on a canvas. The existing slide control widget available from Tkinter looks a bit large and cumbersome sometimes. If we need a more neat and compact slide-type user input device we can manufacture our own.
The choice made here is to assemble the essential slider functions as graphic and text elements on a Tkinter canvas.
What we see in the following code are three similar groups of code separated by double lines and a callback function that focuses on one of the three segments depending on the value of a variable named focus_flag. Execute the program shown in the usual way.
# mini_slider_widget_1.py
#>>>>>>>>>>>>>>>>>>>>
from Tkinter import *
import math
root = Tk()
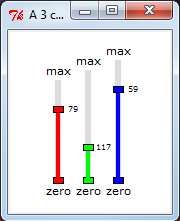
root.title("A 3 color linear slider control gadget")
cw = 200 # canvas width
ch = 200 # canvas height
chart_1 = Canvas(root, width=cw, height=ch, background="#ffffff")
chart_1.grid(row=1, column=1)
#============================================
# Mini slider canvas widget
focus_flag = 0 # 0-> uncommited, 1 -> slider #1, 2 -> slider #2 etc.
x_1 = 50 # Position of slider #1 base.
y_1 = 150
x_2 = 80 # Position of slider #2 base.
y_2 = 150
x_3 = 110 # Position of slider #3 base.
y_3 = 150
length_1 = 100 # Length of slider #1 (pixels) - constant.
length_2 = 110
length_3 = 120
slide_1 = y_1 # Position of slider handle #1 - variable.
slide_2 = y_2
slide_3 = y_3
#==============================================
def separation(x_now, y_now, x_dot, y_dot): # distance # measurement
# Distance to points - used to find out if the mouse clicked # inside a circle
sum_squares = (x_now - x_dot)**2 + (y_now -y_dot)**2
distance= int(math.sqrt(sum_squares)) # get #pythagorean distance
widgetsconstructingreturn( distance)
#==============================================
def canv_slider(xn, yn, length, kula):
# Draw the background slider gadgets.
y_top = yn -length
chart_1.create_line(xn, yn, xn, y_top, fill="gainsboro", width = 6)
chart_1.create_rectangle(xn - 5, yn -3, xn + 5, yn + 3, fill=kula, tag="knob_active")
chart_1.create_text(xn, yn + 10, text='zero',font=('verdana', 8))
chart_1.create_text(xn, y_top - 10, text='max',font=('verdana', 8))
canv_slider(x_1, y_1, length_1, "red")
canv_slider(x_2, y_2, length_2, "green")
canv_slider(x_3, y_3, length_3, "blue")
#==============================================
def dyn_slider(xn, yn, slide_val, kula, tagn):
# Draw the dynamic slider position.
chart_1.delete(tagn)
chart_1.create_line(xn, yn, xn, slide_val, fill=kula, width=4, tag =tagn)
chart_1.create_rectangle(xn - 5, slide_val -3 , xn + 5,slide_val + 3, fill=kula, tag=tagn)
chart_1.create_text(xn + 15, slide_val, text=str(slide_val), font=('verdana', 6),tag =tagn)
#==============================================
def callback_1(event):
# LEFT CLICK event processor.
global x_1, y_1, x_2, y_2, x_3, y_3, focus_flag
global slide_1, slide_2, slide_3
# Measure distances to identify which point has been clicked on.
d1 = separation(event.x, event.y, x_1, slide_1)
d2 = separation(event.x, event.y, x_2, slide_2)
d3 = separation(event.x, event.y, x_3, slide_3)
if d1 <= 5:
focus_flag = 1
if d2 <= 5:
focus_flag = 2
if d3 <= 5:
focus_flag = 3
def callback_2(event):
widgetsconstructing# LEFT DRAG event processor.
global length_1, length_2, length_3
global x_1, y_1, x_2, y_2, x_3, y_3, focus_flag
global slide_1, slide_2, slide_3
pos_x = event.x
slide_val = event.y
if focus_flag == 1 and slide_val <= y_1 and slide_val >= y_1 - length_1
and pos_x <= x_1 + 10 and pos_x >= x_1 - 10:
dyn_slider(x_1, y_1, slide_val, "red", "slide_red")
slide_1 = slide_val
if focus_flag == 2 and slide_val <= y_2 and slide_val >= y_2 - length_2
and pos_x <= x_2 + 10 and pos_x >= x_2 - 10:
dyn_slider(x_2, y_2, slide_val, "green", "slide_green")
slide_2 = slide_val
if focus_flag == 3 and slide_val <= y_3 and slide_val >= y_3 - length_3
and pos_x <= x_3 + 10 and pos_x >= x_3 - 10:
dyn_slider(x_3, y_3, slide_val, "blue", "slide_blue" )
slide_3 = slide_val
#==============================
chart_1.bind("<Button-1>", callback_1)
chart_1.bind("<B1-Motion>", callback_2)
root.mainloop()
This is an array of numerical input gadgets that give users feedback using the length of a colored bar as well as a numerical readout.
The function callback_1 reacts to a click of the left mouse while callback_2 responds to the mouse being dragged while the button is held down. Which of the three sets of controls is controlled by a mouse left-click is determined by measuring the position of the mouse when the left button is clicked. This measurement is performed by the function separation(x_now, y_now, x_dot, y_dot). It measures the distance between where the mouse is clicked and each of the slide control rectangles. If it is close (within 5 pixels) to a control rectangle, then the value of focus_flag is set to an integer that we associate with that position.
It works on a similar principle to the official Tkinter scale/slider widget.
It is useful when you want to place a slide controller onto a canvas.
They occupy less screen area than the Ttkinter scale widget.