
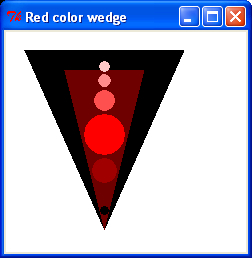
We create a wedge-shaped segment to form a logical pattern that can be incorporated into a wheel arrangement intended to show the relationships between different colors.
The code structure used in the previous recipe is re-used here. When you execute the following code you will see a neat row of colored disks laid onto a dark shaded triangular wedge going from dark to light shades of red. The following screenshot shows the Graded Color Wedge.
# red_color_segment_1.py
#>>>>>>>>>>>>>>>>>>>
from Tkinter import *
root = Tk()
root.title("Red color wedge")
cw = 240 # canvas width
ch = 220 # canvas height
chart_1 = Canvas(root, width=cw, height=ch, background="white")
chart_1.grid(row=0, column=0)
theta_deg = 0.0
x_orig = 100
y_orig = 200
x_width = 80
y_hite = 180
xy0 = [x_orig, y_orig]
wedge-shaped segmentcreatingxy1 = [x_orig - x_width, y_orig - y_hite]
xy2 = [x_orig + x_width, y_orig - y_hite ]
wedge =[ xy0, xy1 , xy2 ]
width= 40 #standard disk diameter
hite = 80 # median wedge height.
hFac = [0.25, 0.45, 0.75, 1.2, 1.63, 1.87, 2.05] # Radial # factors
wFac = [ 0.2, 0.36, 0.6, 1.0, 0.5, 0.3, 0.25] # disk # diameter factors
# Color list. Elements increasing in darkness.
kulaRed = ["#000000","#6e0000","#a00000","#ff0000",
"#ff5050", "#ff8c8c", "#ffc8c8",  "#440000" ]
kula = kulaRed
wedge =[ xy0, xy1 , xy2 ] # black background
chart_1.create_polygon(wedge,fill=kula[0])
x_width = 40 # dark red wedge
y_hite = 160
xy1 = [x_orig - x_width, y_orig - y_hite]
xy2 = [x_orig + x_width, y_orig - y_hite ]
wedge =[ xy0, xy1 , xy2 ]
chart_1.create_polygon(wedge,fill=kula[1])
for i in range(0, 7): # red disks
x0_disk = xy0[0] - width * wFac[i]/2 # bottom left
y0_disk = xy0[1] - hite * hFac[i] + width * wFac[i]/2
xya = [x0_disk, y0_disk] # BOTTOM LEFT
x1_disk = xy0[0] + width * wFac[i]/2 # top right
y1_disk = xy0[1] - hite * hFac[i] - width * wFac[i]/2
xyb = [x1_disk, y1_disk] #TOP RIGHT
chart_1.create_oval(xya ,xyb , fill=kula[i], outline=kula[i])
root.mainloop()
..................Content has been hidden....................
You can't read the all page of ebook, please click here login for view all page.