
Introduction to Pandas Library for Data Analysis
4.1. Introduction
In this chapter, you will see how to use Python’s Pandas library for data analysis. In the next chapter, you will see how to use the Pandas library for data visualization by plotting different types of plots.
Execute the following script on your command prompt to download the Pandas library.
$ pip install pandas
The following script imports the Pandas library in your application. Execute the script at the type of all Python codes that are provided in this chapter.
import pandas as pd
Furthermore, the following are the libraries that you need to install before running scripts in this chapter.
| Requirements – Anaconda, Jupyter, and Matplotlib |
•Every script in this book has been executed via Jupyter Notebook. Therefore, you should have Jupyter Notebook installed. |
•It goes without saying that we will be using the Matplotlib library. |
•The Numpy and Pandas libraries should also be installed before this chapter. |
| Hands-on Time – Source Codes |
| All IPython notebooks for the source code of all the scripts in this chapter can be found in the Source Codes folder in the GitHub repository. I would suggest that you write all the code in this chapter yourself and see if you can get the same output as mentioned in this chapter. |
4.2. Reading Data into Pandas Dataframe
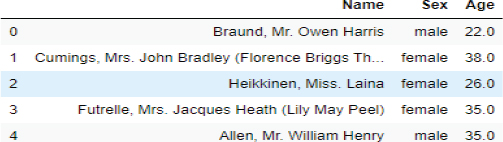
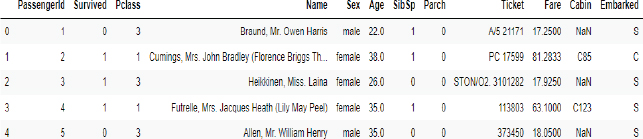
In the second chapter of this book, you saw how the Pandas library can be used to read CSV and TSV files. Here, we will briefly recap how to read a CSV file with Pandas. The following script reads the “titanic_data.csv” file from the Datasets folder in the GitHub repository. The first five rows of the Titanic dataset have been printed via the head() method of the Pandas dataframe containing the Titanic dataset.
Script 1:
1. import pandas as pd
2. titanic_data = pd.read_csv(r”E:Data Visualization with PythonDatasets itanic_data.csv”)
3. titanic_data.head()
Output:

The read_csv() method reads data from a CSV or TSV file and stores it in a Pandas dataframe, which is a special object that stores data in the form of rows and columns.
4.3. Filtering Rows
One of the most routine tasks that you need to perform while handling Pandas dataframe is to filter rows based on column values.
To filter rows, you have to first identify the indexes of the rows to filter. For those indexes, you need to pass True to the opening and closing square brackets that follow the Pandas dataframe name.
The following script returns a series of True and False. True will be returned for indexes where the Pclass column has a value of 1.
Script 2:
1. titanic_pclass1= (titanic_data.Pclass == 1)
2. titanic_pclass1
Output:
| 0 | False |
| 1 | True |
| 2 | False |
| 3 | True |
| 4 | False |
| … | |
| 886 | False |
| 887 | True |
| 888 | False |
| 889 | True |
| 890 | False |
| Name: | Pclass, Length: 891, dtype: bool |
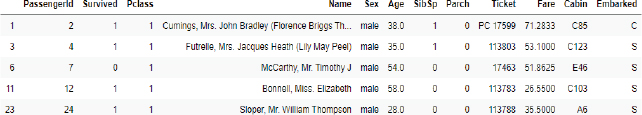
Now, the titanic_pclass1 series, which contains True or False, can be passed inside the opening and closing square brackets that follow the titanic_data dataframe. The result will be a Titanic dataset containing only those records where the Pclass column contains 1.
Script 3:
1. titanic_pclass1= (titanic_data.Pclass == 1)
2. titanic_pclass1_data = titanic_data[titanic_pclass1]
3. titanic_pclass1_data.head()
Output:
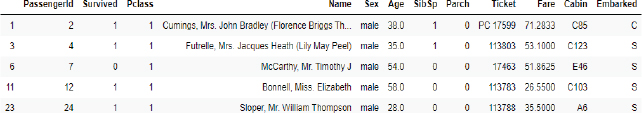
The comparison between the column values and filtering of rows can be done in a single line as shown below:
Script 4:
1. titanic_pclass_data = titanic_data[titanic_data.Pclass == 1]
2. titanic_pclass_data.head()
Output:
Another commonly used operator to filter rows is the isin operator. The isin operator takes a list of values and returns only those rows where the column used for comparison contains values from the list passed to the isin operator as a parameter. For instance, the following script filters those rows where age is 20, 21, or 22.
Script 5:
1. ages = [20,21,22]
2. age_dataset = titanic_data[titanic_data[“Age”].isin(ages)]
3. age_dataset.head()
Output:
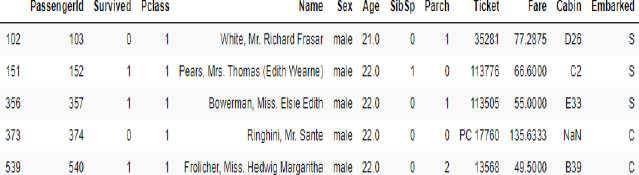
You can filter rows in a Pandas dataframe based on multiple conditions using logical and (&) and or (|) operators. The following script returns those rows from the Pandas dataframe where passenger class is 1 and passenger age is 20, 21, and 22.
Script 6:
1. ages = [20,21,22]
2. ageclass_dataset = titanic_data[titanic_data[“Age”].isin(ages) & (titanic_data[“Pclass”] == 1) ]
3. ageclass_dataset.head()
Output:
4.4. Filtering Columns
To filter columns from a Pandas dataframe, you can use the filter() method. The list of columns that you want to filter is passed to the filter() method. The following script filters Name, Sex, and Age columns from the Titanic dataset and ignores all the other columns.
Script 7:
1. titanic_data_filter = titanic_data.filter([“Name”, “Sex”, “Age”])
2. titanic_data_filter.head()
The output below shows that the dataset now contains only Name, Sex, and Age columns.
Output:
In addition to filtering columns, you can also drop columns that you don’t want in the dataset. To do so, you need to call the drop() method and pass it the list of columns that you want to drop. For instance, the following script drops the Name, Age, and Sex columns from the Titanic dataset and returns the remaining columns.
Script 8:
1. titanic_data_filter = titanic_data.drop([“Name”, “Sex”, “Age”], axis = 1)
2. itanic_data_filter.head()
Output:

| Further Readings – Pandas Filter |
| To study more about the Pandas Filter method, please check Pandas’ official documentation for the filter method (https://bit.ly/2C8SWhB). Try to execute the filter method with a different set of attributes, as mentioned in the official documentation. |
4.5. Concatenating Dataframes
Oftentimes, you need to concatenate or join multiple Pandas dataframes horizontally or vertically. Let’s first see how to concatenate or join Pandas dataframes vertically. We will first create two Pandas dataframes using Titanic data. The first dataframe contains rows where the passenger class is 1, while the second dataframe contains rows where the passenger class is 2.
Script 9:
1. titanic_pclass1_data = titanic_data[titanic_data.Pclass == 1]
2. print(titanic_pclass1_data.shape)
3.
4. titanic_pclass2_data = titanic_data[titanic_data.Pclass == 2]
5. print(titanic_pclass2_data.shape)
Output:
(216, 12)
(184, 12)
The output shows that both the newly created dataframes have 12 columns. It is important to mention that while concatenating data vertically, both the dataframes should have an equal number of columns.
There are two ways to concatenate datasets horizontally. You can call the append() method via the first dataframe and pass the second dataframe as a parameter to the append() method. Look at the following script:
Script 10:
1. final_data = titanic_pclass1_data.append(titanic_pclass2_data, ignore_index=True)
2. print(final_data.shape)
Output:
(400, 12)
The output now shows that the total number of rows is 400, which is the sum of the number of rows in the two dataframes that we concatenated.
| Further Readings – Pandas append |
| To study more about the Pandas append method, please check Pandas’ official documentation for the append method (https://bit.ly/2CaSteR). Try to execute the append method with a different set of attributes, as mentioned in the official documentation. |
The other way to concatenate two dataframes is by passing both the dataframes as parameters to the concat() method of the Pandas module. The following script shows how to do that.
Script 11:
1. final_data = pd.concat([titanic_pclass1_data, titanic_pclass2_data])
2. print(final_data.shape)
Output:
(400, 12)
To concatenate dataframes horizontally, make sure that the dataframes have an equal number of rows. You can use the concat() method to concatenate dataframes horizontally as well. However, you will need to pass 1 as the value for the axis attribute. Furthermore, to reset dataset indexes, you need to pass True as the value for the ignore_index attribute.
Script 12:
1. df1 = final_data[:200]
2. print(df1.shape)
3. df2 = final_data[200:]
4. print(df2.shape)
5.
6. final_data2 = pd.concat([df1, df2], axis = 1, ignore_index = True)
7. print(final_data2.shape)
Output:
(200, 12)
(200, 12)
(400, 24)
| Further Readings – Pandas concat |
| To study more about the Pandas concat() method, please check Pandas’ official documentation for the concat method (https://bit.ly/2PDnDyJ). Try to execute the concat method with a different set of attributes, as mentioned in the official documentation. |
4.6. Sorting Dataframes
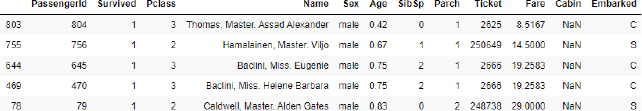
To sort the Pandas dataframe, you can use the sort_values() function of the Pandas dataframe. The list of columns used for sorting needs to be passed to the by attribute of the sort_ values() method. The following script sorts the Titanic dataset in ascending order of the passenger’s age.
Script 13:
1. age_sorted_data = titanic_data.sort_values(by=[‘Age’])
2. age_sorted_data.head()
Output:
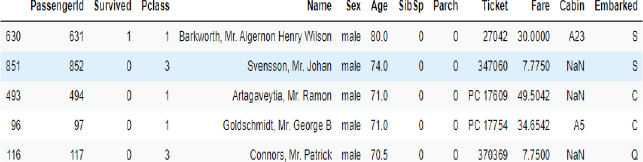
To sort by descending order, you need to pass alse as the value for the ascending attribute of the sort_values() function. The following script sorts the dataset by descending order of age.
Script 14:
1. age_sorted_data = titanic_data.sort_values(by=[‘Age’], ascending = False)
2. age_sorted_data.head()
Output:

You can also pass multiple columns to the by attribute of the sort_values() function. In such a case, the dataset will be sorted by the first column, and in case of equal values for two or more records, the dataset will be sorted by the second column and so on. The following script first sorts the data by Age and then by Fare, both by descending orders.
Script 15:
1. age_sorted_data = titanic_data.sort_values(by=[‘Age’,’Fare’], ascending = False)
2. age_sorted_data.head()
Output:
| Further Readings – Pandas sort_values |
| To study more about Pandas sort_values() method, please check Pandas’ official documentation for sort_values() method (https://bit.ly/2PD41dU). Try to execute the sort_values() method with a different set of attributes, as mentioned in the official documentation. |
4.7. Apply Function
The apply() function is used to apply a function on multiple rows or on rows of a particular column. A lambda expression is passed to the apply() function. The lambda expression basically specifies the operation performed by the apply() function. For instance, in the following, the apply() function adds 2 to all the values in the Pclass column of the Titanic dataset.
Script 16:
1. updated_class = titanic_data.Pclass.apply(lambda x : x + 2)
2. pdated_class.head()
The output shows that all the values in the Pclass column have been incremented by 2.
Output:
0 5
1 3
2 5
3 3
4 5
Name: Pclass, dtype: int64
In addition to a lambda expression, you can also pass a concrete function to the apply() method. In the following script, we define a mult() function, which multiplies the parameter passed to it by 2 and returns the resultant value. In the apply function, we simply pass the name of the mult() method. All the values in the Pclass column will be multiplied by 2, as shown in the output of the script 17.
Script 17:
1. def mult(x):
2. ![]() return x * 2
return x * 2
3.
4. updated_class = titanic_data.Pclass.apply(mult)
5. updated_class.head()
Output:
0 6
1 2
2 6
3 2
4 6
Name: Pclass, dtype: int64
| Further Readings – Pandas apply |
| To study more about the Pandas apply method, please check Pandas’ official documentation for the apply method (https://bit.ly/3kxvBb1). Try to execute the apply method with a different set of attributes, as mentioned in the official documentation. |
4.8. Pivot & Crosstab
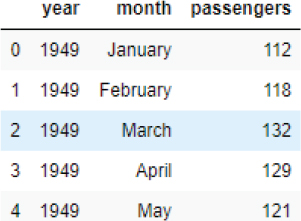
You have already seen the Pivot operator in action in the last chapter when we studied heat maps in Seaborn. Here, we will briefly revise the pivot operation via the Flights dataset. The following script downloads the Flights dataset.
Script 18:
1. import matplotlib.pyplot as plt
2. import seaborn as sns
3.
4.
5. flights_data = sns.load_dataset(‘flights’)
6.
7. flights_data.head()
Output:
Script 19:
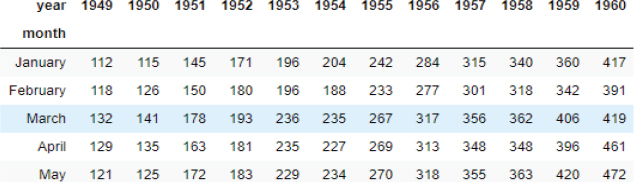
1. flights_data_pivot =flights_data.pivot_table(index=‘month’, columns=‘year’, values=‘passengers’)
2. flights_data_pivot.head()
Output:
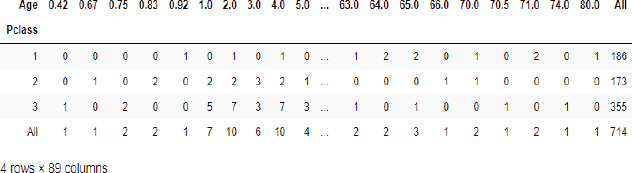
The crosstab() function is used to plot cross tabulation between two columns. Let’s plot a cross tab matrix between passenger class and age columns for the Titanic dataset.
Script 20:
1. import pandas as pd
2. titanic_data = pd.read_csv(r”E:Data Visualization with PythonDatasets itanic_data.csv”)
3. titanic_data.head()
4.
5. pd.crosstab(titanic_data.Pclass, titanic_data.Age, margins=True)
Output:
4.9. Arithmetic Operations with Where
The where clause from the numpy library can be used to perform arithmetic operations on Pandas dataframe. For instance, in the following script, the where clause is used to add 5 to the rows in the Fare column, where passengers’ ages are greater than 20.
Script 21:
1. import numpy as np
2. titanic_data.Fare = np.where( titanic_data.Age > 20, titanic_data.Fare +5, titanic_data.Fare)
3.
4. titanic_data.head()
Output:
| Hands-on Time – Exercise |
| Now, it is your turn. Follow the instructions in the exercises below to check your understanding of data analysis with the Pandas library. The answers to these exercises are provided after chapter 10 in this book. |
Exercise 4.1
Question 1
In order to horizontally concatenate two Pandas dataframes, the value for the axis attribute should be set to:
A.0
B.1
C.2
D.None of the above
Question 2
Which function is used to sort a Pandas dataframe by column value?
A.sort_dataframe()
B.sort_rows()
C.sort_values()
D.sort_records()
Question 3
To filter columns from a Pandas dataframe, you have to pass a list of column names to one of the following methods:
A.filter()
B.filter_columns()
C.apply_filter()
D.None of the above()
Exercise 4.2
Use the apply function to subtract 10 from the Fare column of the Titanic dataset, without using a lambda expression.