
Visual Studio offers a large set of debugging tools; PTVS inherits a lot of them, which helps Python developers to debug code by using step-by-step execution, runtime variable watch capabilities, breakpoints, and the ability to see where the code fails during a debugging session.
The ability to see where the code breaks can significantly speed up the debugging session. In the following screenshot, we can see an example of an untracked exception:
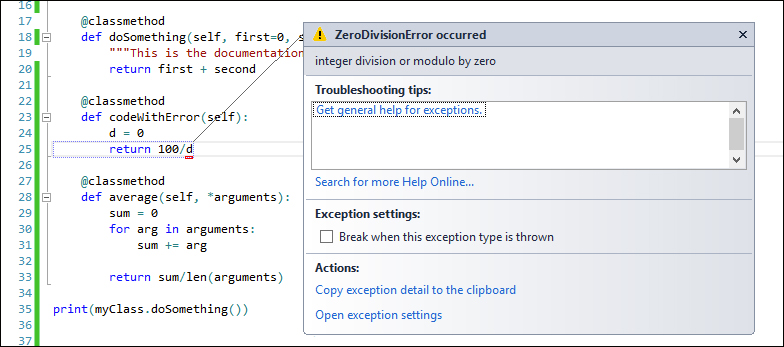
An example of error dialog box during debugging a Python application
When you run the code, Visual Studio will stop the execution because it detects the raised exception of a problematic code. It highlights the exact point where the error occurred while also suggesting ways to fix it—even if right now Visual Studio may not suggest useful solutions for the problem.
The debugging process is not only about understanding where exceptions are raised, but also to understand what happens in the code when it is not behaving as expected. This is where step-by-step execution and breakpoints come in handy.
A breakpoint is a point that you can define in the code to stop the execution. Visual Studio has made it very simple to set a breakpoint. It allows better visibility of the content of variables and it follows the flow of the code. A breakpoint can be set by clicking in the gutter of the code window, which will bring up a red circle. Select Insert Breakpoint in the Breakpoint submenu in the code contextual menu.
Once the breakpoint is set, you can see it in the code window as shown in the following screenshot:
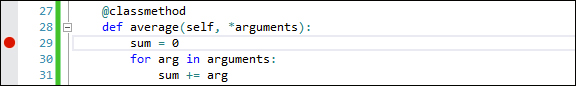
Now that the breakpoint is set, if you run the application, Visual Studio will stop its execution precisely at the breakpoint while following the flow of the code:
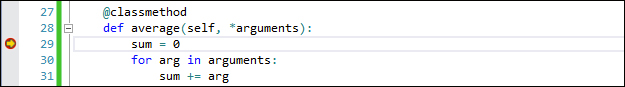
Indicated that line 29 as the breakpoint
The IDE puts the caret on the first column of the line of code in which we set the breakpoint. When hovering around the variables in that context, we can see the current value of the variable.
We can also create a watch entry on a variable in order to see how the value of a variable changes during the program flow. To watch a variable, right-click on it during the debugging process and click on Add Watch in the contextual menu. The variable will be added into the Watch window as shown in the following screenshot:
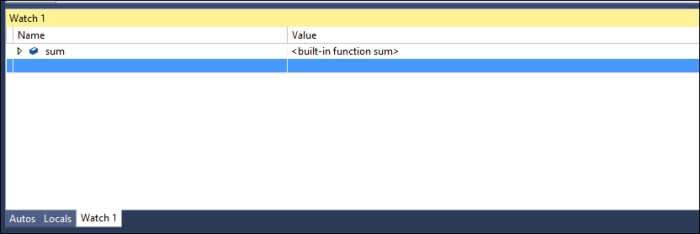
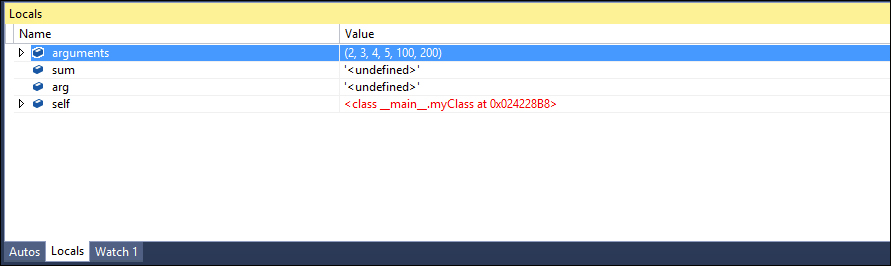
Besides the watch variable, it is also possible to see all the variables in the current scope from the Locals tab:
Once a breakpoint has been hit, it's possible to use one of the following three functions to move on in the program flow: Step Into, Step Over, and Step Out. These functions are accessible through the Debug menu or the buttons available in the toolbar. Alternatively, you can also use Run to Cursor (Ctrl + F10) to run through the program until you reach where the cursor is:
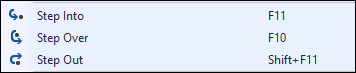
Step Into: This executes the next statement and stops. If the next statement is a call to a function, the debugger will stop at the first line of the function being called entering the function.Step Over: This executes the next statement. However, if the next statement is a function, calling it will not go into it. It's useful when you are not willing to follow the entire program flow of the function.Step Out: This executes the code until the end of the current function. It's useful when you do not wish to go through the entire program flow of the current function.
If you wish to just continue the execution of the program flow without going into a single line of code at the time, just press the Continue button in the toolbar or F5. If there are other breakpoints in your code, the execution will continue through all of them until the last one.