
In this chapter, we will see how PTVS interacts with two particularly useful Python extensions: IPython and IronPython.
Despite their names, they are very different from each other. IPython is more oriented toward extending the REPL interface in a way that can help you have a more interactive approach to the code, providing you with features such as on-the-fly graph plotting. IronPython provides .NET class access to your Python code and integrates Python in .NET applications.
IPython is a command shell for interactive computing for Python (also available for other language integrations) that offers enhanced type introspection—the possibility to examine the type or properties of an object at runtime—rich media, and REPL extensions.
As an interactive shell tool used for data analysis and math graph plotting, IPython comes from an academic-scientific computing background, but appeals to data scientists through the power of graphing integration.
An interesting feature of IPython is its ability to plot mathematical graphs of expressions in an interactive way, much like MATLAB.
PTVS supports IPython libraries and provides the ability to integrate the graph that is generated inside REPL.
We need to install IPython and its supporting dependencies such as matplotlib from a distribution that has all the code already compiled for Windows OS. The distribution of this package can be downloaded from http://www.lfd.uci.edu/~gohlke/pythonlibs/#scipy-stack. This web page, from the University of California in Irivine, contains an unofficial repository of Windows binaries for a large number of Python packages. There are different packages that are available, which depend on the version of the Python interpreter and the operating system you are using. For our proposal, we are going to install Python 2.7 for Windows 32-bit.
Note
As an alternative, you can use the Python (x, y) distribution that contains a whole range of Python libraries for scientific and engineering software. The installer can be downloaded from https://code.google.com/p/pythonxy/.
Running the installer gives you the ability to choose the libraries it offers; for our scope, ensure that you include the SciPy libraries and IPython.
Once you have the libraries from the source of your choice, we can test the whole installation by executing the following command from the command prompt:
ipython --pylab
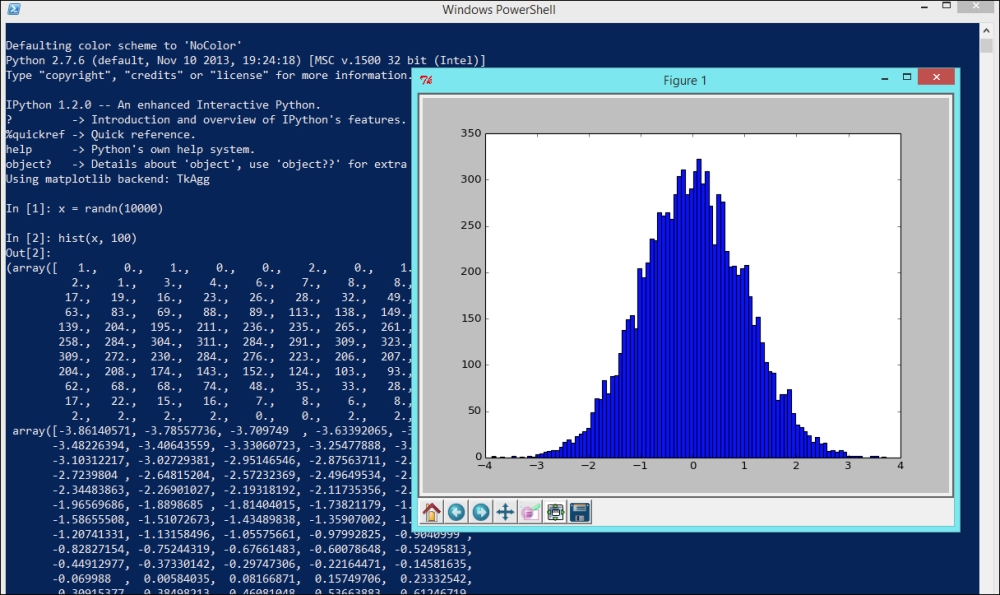
This command executes the IPython environment with the pylab extension. Also, it permits you to use the matplotlib library to plot graphs; this is a Python-plotting library that can be used with Python to plot graphs using mathematical functions. As an example, let's try to plot a histogram out of 10,000 random numbers that are clustered in 100 samples:
x = randn(10000)
hist(x, 100)
Typing the preceding code into the IPython shell will display the following result:
For more details on what the matplotlib library can do, refer to the library website at http://matplotlib.org/.
Now that IPython is up and working, let's instruct PTVS in a way that will allow REPL to talk to IPython to extend it along with its plotting capabilities. First, we need to find the Python interpreter's REPL options. You can quickly locate this from the Python Environments window by clicking on the Interactive Options label in the Python environment that is being used.

This will bring up the Options dialog box, as shown in the following screenshot:
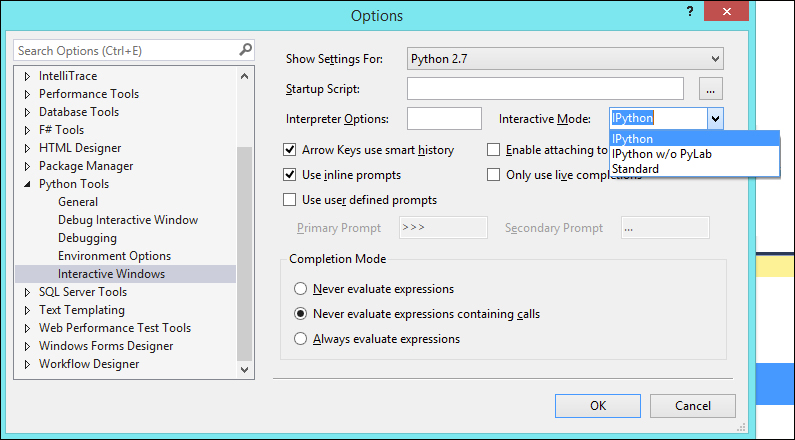
In the Interactive Mode drop-down menu, the different modes of the PTVS REPL tool are listed as follows:
- Standard: This mode offers the default REPL interactive window in which we can execute the Python code
- IPython: This mode permits us to see the graphs directly inside REPL when REPL interacts with the PyLab library directly
- IPython w/o PyLab: This mode permits us to see the graphs that are rendered in an independent window
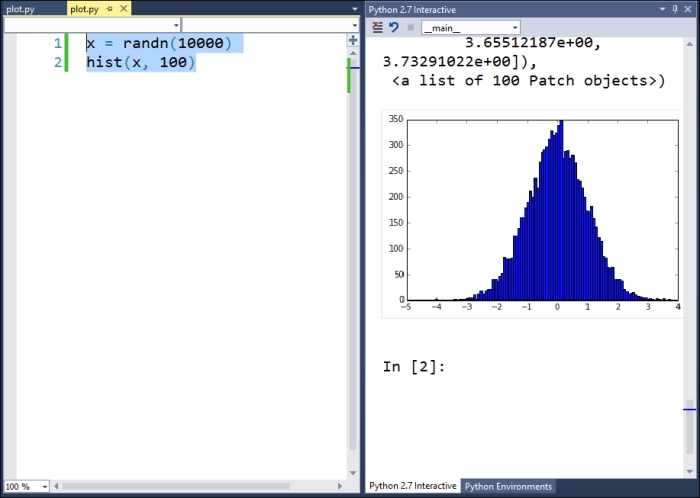
For our example, we are choosing the IPython mode. Now that we have set up Interactive Window, let's see how Visual Studio acts. Instead of writing the code of our previous example inside Interactive Window, you can write it in the code editor and then execute it in REPL through the Send to Interactive Window option in the contextual menu. As we have seen in Chapter 2, Python Tools in Visual Studio, the following is the result to be expected:
We can also execute the code in the file in a way through which we'll only see the resulting graph in an external window. However, before we can do this, we need to add some other code as follows:
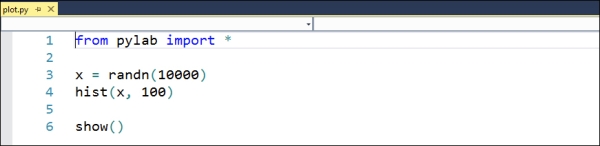
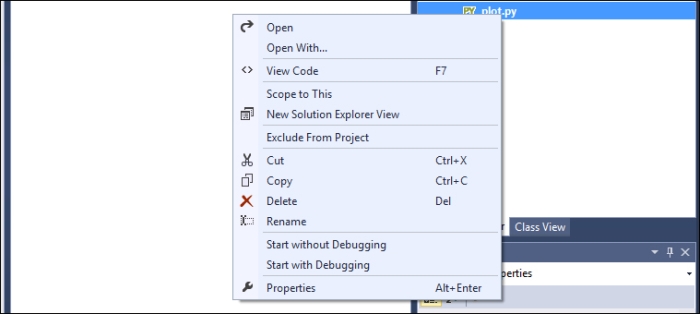
The first line in the preceding screenshot will reference the pylab libraries, and the last line will render the plot. To run the code in an external window, right-click on the file node in the Solution Explorer window and select the Start without debugging command as shown in the following screenshot:
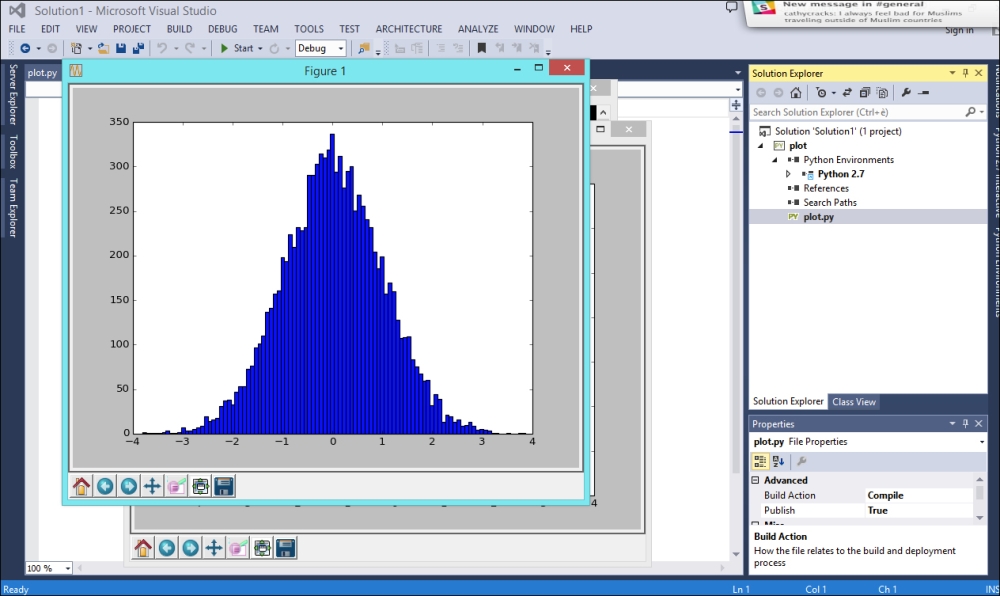
This will execute the code in the console, and the resulting rendering window will appear at the end of the execution:
The matplotlib library also offers the possibility to save the resulting plot into a file with just a line of code by adding the savefig command as follows:
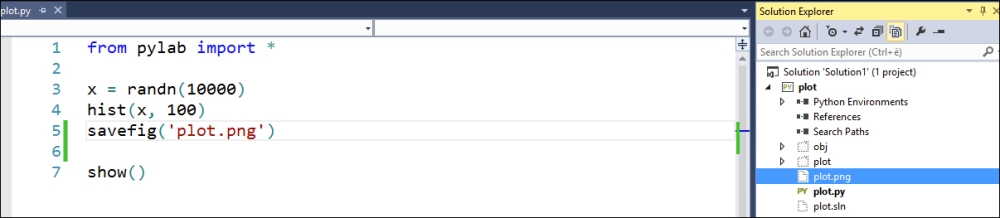
In this example, the resulting graph will be saved as a plot.png file in the root of the project folder.
For more in-depth functionalities and to dig deeper into the plotting functionalities offered by the IPython integration, please refer to the IPython website at http://ipython.org/. You can also refer to the matplotlib website at http://matplotlib.org/, which contains great documentation on this subject that are correlated with examples.
The only limitation of IPython is the fact that it cannot be used with the other library, IronPython, that we are going to explore right now. IronPython currently does not support IPython, despite the fact that you can select it on the Interactive Options form.